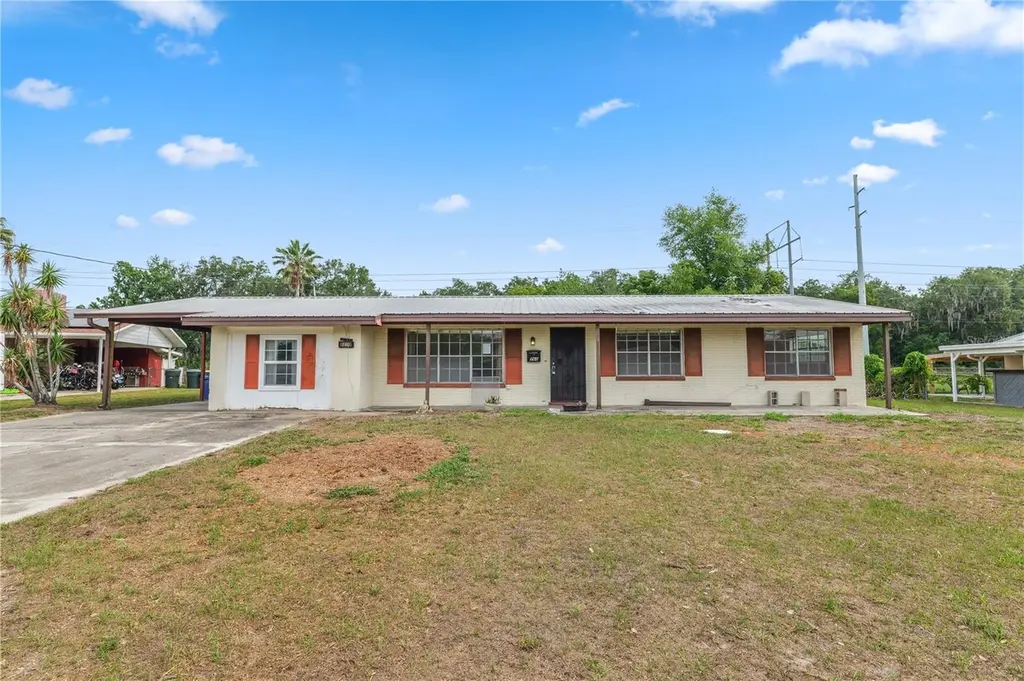
760 Manor Dr · Bartow, FL
Flood risk 1/10 · Minimal
- FEMA flood zone
- X (unshaded)
- Chance of flooding over 30 yrs
- 0.0%
- Est. flood insurance / yr
- $507 – $1,088
Fire risk 4/10 · Minor
- Est. fire insurance / yr
- $947 – $1,759
Heat risk 8/10 · Major
- Hot days now (above 107°F)
- 7 days/yr
- Hot days in 30 yrs
- 25 days/yr
Wind risk 9/10 · Severe
- Chance of severe wind over 30 yrs
- 99.0%
Air-quality risk 2/10 · Minimal
- Unhealthy air days now
- 2 days/yr
- Unhealthy air days in 30 yrs
- 2 days/yr
Risk factors via First Street. Map © Google.
Why this score? — see what drove the D grade
The composite is a weighted blend of 9 inputs, each scored 0–100. Each bar is that input's sub-score; the figure is the points it added to the 100-point composite (weight × sub-score).
- Cash flow +12.0/30.0
- ARV discount +7.5/15.0
- 1% rule +4.8/10.0
- DSCR +3.6/10.0
- Schools +3.5/10.0
- Livability +3.4/5.0
- Rent growth +3.2/5.0
- Condition / age +2.5/5.0
- Appreciation +0.0/10.0
$209,900
🖨 Deal sheet 📄 Offer letter ✓ Due diligence
Listing remarks
Short Sale. Bank Approved Price! Investor Special in the heart of Bartow! This 4 bedroom, 2 bath home offers strong potential for rental income, fix and flip, or long term hold opportunities. Spacious floor plan with ample living space, generously sized bedrooms, metal roof and a large lot with room to add value. Conveniently located near downtown Bartow, schools, shopping, and major highways for easy commuting. With solid bones and endless possibilities, this property is perfect for investors looking to expand their portfolio or capitalize on the growing Central Florida market. Don’t miss this opportunity to unlock the potential of this Bartow gem!
Key facts
- Solid bones
- Large lot
- 0.28 acre lot
Tags
Property features AI
Finance
- Other: Unfurnished; Zoned R-1A; No lease restrictions noted
Exterior
- Parking: Carport (1 space)
- Utilities: Public water; Public sewer; Cable available; High-speed internet available; Electricity available; Phone service available
- Home design: Single-family residence; One story; Facing south
- Construction: Block construction; Metal roof; Slab foundation; Built on approximately 0.28 acres
- Exterior features: Covered front porch; Outdoor storage; Level paved lot
Interior
- Kitchen: Microwave
- Bedrooms: 4 bedrooms
- Flooring: Carpet; Laminate
- Bathrooms: 2 full bathrooms
- Heating & cooling: Central heating; Central air conditioning; Wood-burning fireplace
- Interior features: Ceiling fans
- Laundry & utility: Laundry area (other)
Neighborhood map
What this means for you Summary
Snapshot
- This is a 3-bed/1.0-bath single-family listed at $210k.
Deal economics
- At list price, monthly cash flow is $-49 ($-589/yr) — negative.
- To cash-flow at today's rent, offer at most $201k (4.1% below list).
- To meet the 1% rule (rent ≥ 1% of price), the offer needs to be $205k (2.4% below list).
- Recommended offer: $201k (4.1% below list) — sets the bar for cash-flow.
Location & tenants
- Location reads 68/100 on livability (#526 in FL) — a middle-class / working-renter tenant base. Strengths: cost of living A+, housing A+; Watch: employment C-, crime D-, amenities F.
- Polk (suburban): math 39% / reading 43% proficiency, ranked #62 of 73 in FL (top 85%) — families likely to look elsewhere, expect single-tenant / working-renter base with shorter leases.
- Zoned schools: Spessard L Holland Elementary (math 47% / reading 49%, grade D, #1,171 of 2,144 statewide, top 55%, 766 students, 52% FRL); Bartow Senior High School (math 26% / reading 46%, grade F, #359 of 667 statewide, top 55%, 2,125 students, 44% FRL).
- Market conditions: Rents rising (+2.7%/yr); 386 active listings in the ZIP; 9 comparable units currently listed for rent nearby; rentals at typical pace (median 15d on market — plan ~3-4 weeks tenant-placement turnaround); 10,384 units permitted in Polk County in 2024 (1,716 in 5+ unit buildings).
- This rent runs 38% of the median local income ($64k/yr) — at the standard rent-burdened threshold; future hikes will face affordability resistance.
Forward outlook
- Local home prices are declining (-3.0%/yr); year-one equity from $1k of loan paydown is wiped out by about $6k of value loss. Plan a longer hold.
- Polk County population projected at +33% by 2050 — long-run rental-demand tailwind backs the buy-and-hold thesis.
Negotiation context
- It's been on market 35 days — a 3% lower offer ($204k) is reasonable based on typical stale-listing flexibility.
- Current owner paid $89k; list at $210k implies a 136% gain — meaningful room to come down on a strong offer.
Risks & watch-outs
- Watch-outs: property tax is 2.7% of price.
- Climate carrying-cost: severe wind risk, 99% chance of damaging wind over 30y; extreme-heat days projected 7→25/yr by 2055 (HVAC capex compounding) — expect insurance premiums to compound above CPI over the hold.
Questions for the listing agent
- What do current leases actually rent for vs. the listed asking? Can we see a recent rent roll and the last 12 months of T-12 income?
- It's been on market 35 days. Have you received any prior offers? Is the seller open to a 4% concession, seller financing, or rate buy-down credit?
- Built in 1962 — when were the roof, HVAC, electrical panel, plumbing, and water heater last replaced?
- Property tax is high relative to price — has the assessment been appealed recently, and will the sale trigger a re-assessment?
- Is there a deadline driving the sale (1031 exchange, divorce, estate, relocation)? That informs how much negotiation room exists.
- Crime grade is D in this area — have there been break-ins, vandalism, or insurance claims at this property in the last 3 years? What carrier currently insures it and at what premium?
- The area grade is low — what's the realistic commute time and amenity access for the typical tenant pool here? Any planned neighborhood developments (good or bad) we should know about?
- What's the average days-on-market for RENTAL listings here right now (not sales)? A rising rental-DOM trend means longer vacancies and softer asking-rent achievability than the comps imply.
- What's the recent tenant-quality profile in this submarket — average credit score on applications, eviction rate, late-payment / NSF rate, and stable-employment percentage? A property-management company in the area should have these aggregated.
- How much new for-sale + rental construction is in the pipeline within 1–3 miles? Heavy new supply typically softens prices + rents 12–24 months out; constrained supply supports both.
Investment metrics
- 1% rule
- 0.98% ✗
- Cap rate
- 6.01%
- Cash-on-cash
- -1.00%
- DSCR
- 0.96
- GRM
- 8.5
CMA / ARV
No comps found within radius.
Projected returns pro-forma
-3.0% appreciation · 2.72% rent growth · sell at horizon
- IRR
- -18.2%
- Equity multiple
- 0.36×
- Total profit
- $-37,551
- Equity at exit
- $31,297
- IRR
- -10.9%
- Equity multiple
- 0.35×
- Total profit
- $-38,407
- Equity at exit
- $18,148
Cash invested: $58,772 (down + closing). Projections, not guarantees.
Landlord ↔ Tenant lean methodology
- Overall (STATE)
- 87 Strongly Landlord-Friendly
- State Florida
- 87 Strongly Landlord-Friendly · R+3
- County
- — inherits STATE
- City
- — inherits STATE
ZIP-level market 33830
- Home prices YoY
- -19.8%
- Rents YoY
- 2.7%
- Active inventory
- 386
- Price-to-rent
- 8.5×
Monthly cashflow live
- Estimated rent
- $2,048 high interval (Pro) →
- Mortgage (P&I)
- −$1,101
- Tax from tax record
- −$478 /mo · $5,742/yr
- Insurance
- −$87
- HOA
- −$0
- Vacancy / Maint / Mgmt
- −$430
- Net cashflow
- $-49
Break-even live
UW: 25.0% down · 7.5% · 30yr · 1.5% tax · 5.0% vac · 8.0% maint · 8.0% mgmt
Financing live
Cash to close
- Down payment
- $52,475
- Closing costs
- $6,297
- Reserves months
- —
- Total cash needed
- —
Loan-product check · same deal, 3 products live
Conventional
25% down · 7.5% · 30yr
- Down + closing
- —
- Monthly P&I
- —
- Monthly cashflow
- —
- DSCR
- —
- Eligible?
- —
Personal DTI + credit; lowest rate.
DSCR
20% down · 8.5% · 30yr
- Down + closing
- —
- Monthly P&I
- —
- Monthly cashflow
- —
- DSCR
- —
- Eligible?
- —
No personal income docs; deal must DSCR.
Hard money
10% down · 12.0% · 12mo
- Down + closing
- —
- Monthly P&I
- —
- Monthly cashflow
- —
- DSCR
- —
- Eligible?
- —
Short-term bridge; refi at stabilization.
Rent comps 9 comps
| Address | Beds | Baths | Sqft | Rent | $/sqft | DOM | Units | Dist |
|---|---|---|---|---|---|---|---|---|
| 980 Waldon Ave Bartow, FL | 3.0 | 2.0 | 1050 | $1,550 | $1.48 | 23d | 1 | 0.35mi |
| 1175 Luke Ave Bartow, FL | 4.0 | 3.0 | 1966 | $2,183 | $1.11 | 23d | 1 | 0.37mi |
| 925 Tangelo Cir Bartow, FL | 3.0 | 2.0 | 1681 | $2,200 | $1.31 | 14d | 1 | 0.47mi |
| 1586 Caroline Ct Bartow, FL | 3.0 | 2.0 | 1388 | $1,885 | $1.36 | 14d | 1 | 0.50mi |
| 710 Childs Ave Unit 1 Bartow, FL | 3.0 | 2.0 | 1137 | $2,100 | $1.85 | 23d | 1 | 0.53mi |
| 550 Battle Ave Unit 550 Bartow, FL | 4.0 | 2.0 | 1708 | $1,250 | $0.73 | 3d | 1 | 0.62mi |
| 1070 E Church St Bartow, FL | 4.0 | 2.5 | 1384 | $1,900 | $1.37 | 14d | 1 | 1.31mi |
| 1070 E Church St Unit A Bartow, FL | 4.0 | 2.5 | 1362 | $1,850 | $1.36 | 14d | 1 | 1.31mi |
| 820 S Floral Ave Bartow, FL | 2.0 | 1.5 | 1112 | $1,200 | $1.08 | 23d | 1 | 1.41mi |
Listing history 18 events
-
2026-06-18days on market $209,900 Active 35 DOM
-
2026-06-17days on market $209,900 Active 34 DOM
-
2026-06-16days on market $209,900 Active 33 DOM
-
2026-06-15days on market $209,900 Active 32 DOM
-
2026-06-13pricedays on market $209,900 Active 30 DOM
-
2026-06-10days on market $219,000 Active 27 DOM
-
2026-06-09days on market $219,000 Active 26 DOM
-
2026-06-08days on market $219,000 Active 25 DOM
-
2026-06-07days on market $219,000 Active 24 DOM
-
2026-06-05days on market $219,000 Active 21 DOM
-
2026-06-03days on market $219,000 Active 20 DOM
-
2026-06-03days on market $219,000 Active 19 DOM
-
2026-06-01days on market $219,000 Active 18 DOM
-
2026-05-31days on market $219,000 Active 17 DOM
-
2026-05-14$219,000 Active
-
2003-11-20soldstatus $89,000
-
1990-05-01soldstatus $65,000
-
1977-01-01soldstatus $33,000
ⓘ Source: listings_history table (triggers on properties + properties_extension) + one-shot
backfill from property_details.listing_events for pre-trigger history.
Tax reassessment forecast FL · Resets to sale price
- Current annual tax
- $5,742 · $478/mo
- Projected year-2 tax
- $5,742 · $478/mo
- Expected delta
- $0/yr ($0/mo · 0.0%)
ⓘ Screening estimate from a state-policy table — verify with the county assessor before closing.
Climate risk First Street
- Flood 1/10 Low FEMA zone X (unshaded) · 0% chance over 30 yrs
- Wildfire 4/10 Moderate
- Heat 8/10 Severe 7 d/yr ≥107°F today · 25 d/yr by 30 yrs out
- Wind 9/10 Extreme 99% chance of damaging wind over 30 yrs
- Air quality 2/10 Low 2 unhealthy d/yr today · 2 by 30 yrs out
Nearby sold comps map
Loading sold comps map…
Walkable amenities ~0.75 mi
Loading nearby amenities…
Taxation est. · year 1
- Rental income
- $24,571
- − Mortgage interest
- −$11,758
- − Property taxes
- −$5,742
- − Insurance
- −$1,050
- − Repairs & maintenance
- −$1,966
- − Management
- −$1,966
- − Depreciation
- −$6,106
- Taxable loss
- −$4,016
- Est. tax savings @ 24.0%
- +$964
- After-tax cash flow
- $375/yr
For passive investors: Depreciation is non-cash, so a rental often shows a tax loss while cash-flowing — sheltering income. Rental losses are passive: they offset passive income freely, and up to $25,000/yr can offset ordinary (W-2) income if you actively participate and your MAGI is under $100k (phasing out to $0 by $150k); unused losses carry forward. On sale, claimed depreciation is recaptured at up to 25%, and gains may owe capital-gains tax (a 1031 exchange can defer both). Figures are a year-1 estimate at your 24.0% rate — not tax advice; consult a CPA.
Schools (NCES district)
- District
- Polk
- NCES district ID
- 1201590
- Math proficiency
- 39% ▼ -11.00%
- Reading proficiency
- 43% ▼ -4.00%
- Median HH income
- $43,979
- Composite
- 34.74/100
- National rank
- #5132
- State rank
- #62 of 73 in FL
Livability — Bartow
- Score
- 68/100
- State rank
- #526
- US rank
- #9835
Category grades
Schools grade is shown separately in the Schools card above.
Census & demographics
- Census place
- Bartow, FL
- County
- Polk County · 740,051 people
- City population
- 33,740
- Metro
- Lakeland-Winter Haven, FL
- Population (ZIP)
- 33,740
- Household income
- $63,918
- Rent vs Own
- Severe rent burden
- 681.0
Population outlook (Polk County) Hauer SSP2
- Today (2025)
- 752,975 people
- By 2030
- 804,621 · +6.9%
- By 2040
- 906,117 · +20.3%
- By 2050
- 1,000,476 · +32.9%
- By 2075
- 1,197,520 · +59.0%
- By 2100
- 1,271,518 · +68.9%
Race, ethnicity, and origin ACS 2023
- Neighborhood character
- Diverse neighborhood (Simpson 0.62)
- Race & ethnicity
- White 55% Hispanic / Latino 22% Black 18% Two or more races 13% Asian 2%
- Hispanic origin (detail)
- Mexican 13% Puerto Rican 5%
- Common ancestry
- Italian 3% Slovak 1% Lithuanian 1%
- Foreign-born
- 8% · Canada
- Languages at home
- 81% English-only · Spanish 17% Other Indo-European 1% Other Asian/Pacific 1%
Political lean MEDSL · Polk
- 2024 margin
- Strong R (+20.7) · D 39.2% · R 59.9%
- 2008→2024 swing
- -14.6pp toward R · 2008: -6.1pp · 2024: -20.7pp
- All cycles
- 2024: R+20.7 2020: R+14.4 2016: R+14.1 2012: R+6.8 2008: R+6.1
Not yet ingested
- Civics
- —
Market trends
- HPI YoY
- ▼ -82.47%
- Current HPI
- 333.3392
- Rent YoY
- ▲ 2.72%
- Metro
- Lakeland-Winter Haven, FL
- State GDP YoY
- ▲ 3.28%
- F500 in state
- 36
Industry mix (Fortune 500 HQ in FL)
| Industry | F500 HQs | Revenue |
|---|---|---|
| Industrial Technology | 2 | $29B |
|
||
| Insurance | 2 | $17B |
|
||
| Retail | 1 | $60B |
|
||
| Technology Distribution | 1 | $58B |
|
||
| Homebuilding | 1 | $35B |
|
||
| Technology Manufacturing | 1 | $35B |
|
||
Price history
+563.6% since first listed4 events — show timeline
- 2026-05-14 Listed $219,000 Stellar MLS as Distributed by MLS Grid
- 2003-11-20 Sold (Public Records) $89,000 Public Records
- 1990-05-01 Sold (Public Records) $65,000 Public Records
- 1977-01-01 Sold (Public Records) $33,000 Public Records
Property tax history
+23.4%/yrLatest (2025): $5,742 · +528.5% YoY. Source: county tax records.
Cash-flow waterfall
monthlySold comps — $/sqft
last 12 mo · ≤1 miLoading sold comps…