727 Zeiss Ave · Lemay, MO
Flood risk 1/10 · Minimal
- FEMA flood zone
- X (unshaded)
- Chance of flooding over 30 yrs
- 0.0%
- Est. flood insurance / yr
- $473 – $860
Fire risk 1/10 · Minimal
- Est. fire insurance / yr
- $1,054 – $1,958
Heat risk 5/10 · Moderate
- Hot days now (above 108°F)
- 7 days/yr
- Hot days in 30 yrs
- 21 days/yr
Wind risk 2/10 · Minimal
- Chance of severe wind over 30 yrs
- 1.0%
Air-quality risk 3/10 · Minor
- Unhealthy air days now
- 2 days/yr
- Unhealthy air days in 30 yrs
- 3 days/yr
Risk factors via First Street. Map © Google.
Why this score? — see what drove the D+ grade
The composite is a weighted blend of 9 inputs, each scored 0–100. Each bar is that input's sub-score; the figure is the points it added to the 100-point composite (weight × sub-score).
- ARV discount +15.0/15.0
- Cash flow +14.1/30.0
- DSCR +4.3/10.0
- 1% rule +3.8/10.0
- Livability +3.4/5.0
- Schools +3.0/10.0
- Rent growth +2.5/5.0
- Condition / age +2.5/5.0
- Appreciation +0.0/10.0
$140,000
🖨 Deal sheet 📄 Offer letter ✓ Due diligence
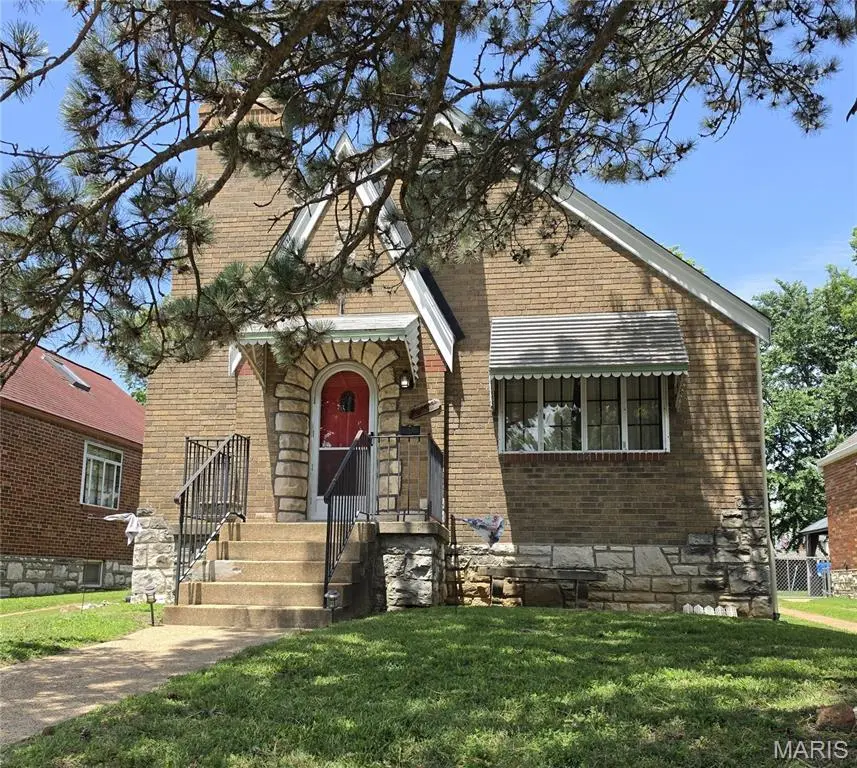
Listing remarks
Great opportunity for investors or owner occupied buyers, a little updating needed on this well maintained and cared for bungalow on a beautiful street in Unincorporated St Louis County. 3 bed, 1 bath with large family room, kitchen, sun room and finished upstairs area with potential to add another bathroom. Full basement could be finished as well. 1 car detached garage and nice fenced in yard. newer roof, hardwood under the carpet. Great area and neighborhood. Sold AS IS
Key facts
- Large family room
- Newer roof
- Fenced in yard
Tags
Property features AI
Finance
- Other: Living area documented as 1,160 (above grade finished area)
- Financial info: Lease not considered; No second mortgage indicated
- HOA & community: No HOA details provided
Exterior
- Parking: 1-car garage
- Security: No security details provided
- Utilities: Public water; Public sewer; Electricity connected (Ameren); Natural gas connected
- Home design: Single family residence; One and one-half levels; Private ownership; Residential property
- Construction: Brick construction; Architectural shingle roof; Basement with 8+ ft poured construction
- Exterior features: Back yard
Interior
- Kitchen: No kitchen appliance details provided
- Bedrooms: 3 bedrooms total (2 on main level, 1 on upper level)
- Flooring: No flooring details provided
- Bathrooms: 1 full bathroom
- Heating & cooling: Forced air heating; Central air conditioning; Ceiling fan(s)
- Interior features: Forced air heating; Ceiling fan(s); Central air
- Laundry & utility: Laundry in basement
Neighborhood map
What this means for you Summary
Snapshot
- This is a 2-bed/1.0-bath single-family listed at $140k.
Deal economics
- At list price, monthly cash flow is $21 ($247/yr) — positive.
- The deal already cash-flows at list — no discount required.
- To meet the 1% rule (rent ≥ 1% of price), the offer needs to be $123k (12.4% below list).
- Recommended offer: $123k (12.4% below list) — sets the bar for 1% rule.
- Cap rate 6.5% vs local median 5.3% in Lemay — meaningfully above typical; check what's discounted (condition, days-on-market, listing class) to confirm the premium yield is real.
Location & tenants
- Location reads 67/100 on livability (#213 in MO) — a middle-class / working-renter tenant base. Strengths: cost of living A+, housing A+; Watch: employment C-, health & safety C-, crime F.
- Bayless (suburban): math 28% / reading 42% proficiency, ranked #206 of 324 in MO (top 64%) — families likely to look elsewhere, expect single-tenant / working-renter base with shorter leases.
- Zoned schools: Bayless Elementary (math 31% / reading 38%, grade F, #676 of 1,115 statewide, top 66%, 814 students, 48% FRL); Bayless Senior High (math 8% / reading 42%, grade F, #436 of 521 statewide, top 85%, 566 students, 48% FRL) — zoned schools at 48% FRL track the district average.
- Market conditions: 146 active listings in the ZIP; 28 comparable units currently listed for rent nearby; rentals at typical pace (median 15d on market — plan ~3-4 weeks tenant-placement turnaround); 920 units permitted in St. Louis County in 2024 (250 in 5+ unit buildings).
Forward outlook
- Local home prices are declining (-3.0%/yr); year-one equity from $968 of loan paydown is wiped out by about $4k of value loss. Plan a longer hold.
Negotiation context
- Only 1 days on market — expect competitive offers; lowballing is unlikely to land.
Risks & watch-outs
- Watch-outs: built in 1938 — expect roof / HVAC / electrical / plumbing capex.
- Climate carrying-cost: extreme-heat days projected 7→21/yr by 2055 (HVAC capex compounding) — expect insurance premiums to compound above CPI over the hold.
Questions for the listing agent
- Built in 1938 — when were the roof, HVAC, electrical panel, plumbing, and water heater last replaced?
- Is there a deadline driving the sale (1031 exchange, divorce, estate, relocation)? That informs how much negotiation room exists.
- Schools are D-rated, which usually means shorter tenancies and higher turnover. Who's the typical renter profile here, and what's been the actual vacancy rate?
- Crime grade is F in this area — have there been break-ins, vandalism, or insurance claims at this property in the last 3 years? What carrier currently insures it and at what premium?
- The area grade is low — what's the realistic commute time and amenity access for the typical tenant pool here? Any planned neighborhood developments (good or bad) we should know about?
- What's the average days-on-market for RENTAL listings here right now (not sales)? A rising rental-DOM trend means longer vacancies and softer asking-rent achievability than the comps imply.
- What's the recent tenant-quality profile in this submarket — average credit score on applications, eviction rate, late-payment / NSF rate, and stable-employment percentage? A property-management company in the area should have these aggregated.
- How much new for-sale + rental construction is in the pipeline within 1–3 miles? Heavy new supply typically softens prices + rents 12–24 months out; constrained supply supports both.
Investment metrics
- 1% rule
- 0.88% ✗
- Cap rate
- 6.47%
- Cash-on-cash
- 0.63%
- DSCR
- 1.03
- GRM
- 9.5
CMA / ARV
- ARV (on-the-fly)
- $189,120
- Comps found
- 12
Show comp detail 12 sales within ~0.75 mi
| Address | Dist | Beds/Ba | Sqft | Sold | Price | $/sf | Match |
|---|---|---|---|---|---|---|---|
| 704 Dallas Dr | 0.13mi | 1/1.0 (-1) | 999 (+4%) | 2mo | $180,000 | $180 | 81 |
| 773 Reed Ave | 0.14mi | 2/1.0 | 1,036 (+8%) | 1mo | $210,000 | $203 | 80 |
| 705 Bellavilla Dr | 0.20mi | 2/1.0 | 1,056 (+10%) | 1mo | $205,000 | $194 | 73 |
| 715 Avenue H | 0.23mi | 3/2.5 (+1) | 1,000 (+4%) | 1mo | $185,000 | $185 | 70 |
| 712 Orient Ave | 0.42mi | 2/1.0 | 900 (-6%) | 4mo | $152,500 | $169 | 67 |
| 939 Erskine Ave | 0.50mi | 2/1.0 | 894 (-7%) | 3mo | $155,000 | $173 | 63 |
| 8626 Shoss Ave | 0.56mi | 2/1.0 | 912 (-5%) | 3mo | $95,000 | $104 | 63 |
| 424 Tiffany Dr | 0.59mi | 2/1.0 | 912 (-5%) | 3mo | $219,900 | $241 | 62 |
| 4107 Hummingbird Ct | 0.60mi | 2/2.0 | 1,026 (+7%) | 2mo | $280,000 | $273 | 55 |
| 1036 Wachtel Ave | 0.62mi | 3/1.0 (+1) | 888 (-8%) | 2mo | $174,900 | $197 | 52 |
| 4019 Greenmeadows Dr | 0.62mi | 3/2.5 (+1) | 1,040 (+8%) | 0mo | $260,000 | $250 | 46 |
| 920 Wachtel Ave | 0.53mi | 3/2.0 (+1) | 1,090 (+14%) | 0mo | $224,900 | $206 | 43 |
Match score weights: distance 35% · size 25% · config 20% · recency 20%. Top-matched comps best support the ARV.
Projected returns pro-forma
-3.0% appreciation · 3.0% rent growth · sell at horizon
- IRR
- -15.3%
- Equity multiple
- 0.45×
- Total profit
- $-21,369
- Equity at exit
- $20,874
- IRR
- -6.7%
- Equity multiple
- 0.57×
- Total profit
- $-16,893
- Equity at exit
- $12,105
Cash invested: $39,200 (down + closing). Projections, not guarantees.
Landlord ↔ Tenant lean methodology
- Overall (STATE)
- 81 Strongly Landlord-Friendly
- State Missouri
- 81 Strongly Landlord-Friendly · R+10
- County
- — inherits STATE
- City
- — inherits STATE
ZIP-level market 63125
- Active inventory
- 146
- Price-to-rent
- 9.5×
Monthly cashflow live
- Estimated rent
- $1,226 high interval (Pro) →
- Mortgage (P&I)
- −$734
- Tax from tax record
- −$156 /mo · $1,867/yr
- Insurance
- −$58
- HOA
- −$0
- Vacancy / Maint / Mgmt
- −$257
- Net cashflow
- $21
Break-even live
UW: 25.0% down · 7.5% · 30yr · 1.5% tax · 5.0% vac · 8.0% maint · 8.0% mgmt
Financing live
Cash to close
- Down payment
- $35,000
- Closing costs
- $4,200
- Reserves months
- —
- Total cash needed
- —
Loan-product check · same deal, 3 products live
Conventional
25% down · 7.5% · 30yr
- Down + closing
- —
- Monthly P&I
- —
- Monthly cashflow
- —
- DSCR
- —
- Eligible?
- —
Personal DTI + credit; lowest rate.
DSCR
20% down · 8.5% · 30yr
- Down + closing
- —
- Monthly P&I
- —
- Monthly cashflow
- —
- DSCR
- —
- Eligible?
- —
No personal income docs; deal must DSCR.
Hard money
10% down · 12.0% · 12mo
- Down + closing
- —
- Monthly P&I
- —
- Monthly cashflow
- —
- DSCR
- —
- Eligible?
- —
Short-term bridge; refi at stabilization.
Rent comps 28 comps
| Address | Beds | Baths | Sqft | Rent | $/sqft | DOM | Units | Dist |
|---|---|---|---|---|---|---|---|---|
| 709 Dammert Ave Unit Labs St. Louis, MO | 2.0 | 1.5 | 800 | $1,100 | $1.38 | 43d | 1 | 0.48mi |
| 304 Bayless Ave Saint Louis, MO | 3.0 | 1.0 | 1104 | $1,950 | $1.77 | 1d | 1 | 0.57mi |
| 4236 Fatima Dr Apt 4 St. Louis, MO | 1.0 | 1.0 | 800 | $925 | $1.16 | 10d | 1 | 0.59mi |
| 207 Waller Ave Saint Louis, MO | 2.0 | 1.0 | 900 | $1,075 | $1.19 | 23d | 1 | 0.65mi |
| 8511 Idaho Ave Unit 1st Floor St. Louis, MO | 1.0 | 1.0 | 750 | $850 | $1.13 | 12d | 1 | 0.72mi |
| 152 W Etta Ave Saint Louis, MO | 2.0 | 1.0 | 936 | $1,274 | $1.36 | 7d | 1 | 0.83mi |
| 3945 Crosby Dr Saint Louis, MO | 2.0 | 1.0 | 1100 | $2,083 | $1.89 | 1d | 1 | 0.97mi |
| 127 E Holden Ave Saint Louis, MO | 2.0 | 1.0 | 1044 | $1,200 | $1.15 | 43d | 1 | 1.03mi |
| 7851 Bandero Dr Saint Louis, MO | 1.0–2.0 | 1.0 | 800 | $1,100 | $1.38 | 12d | 1 | 1.07mi |
| 8125 Michigan Ave St. Louis, MO | 1.0–2.0 | 1.0–2.0 | 797 | $1,150 | $1.44 | 14d | 1 | 1.09mi |
| 812 Schirmer St Saint Louis, MO | 1.0 | 1.0 | 900 | $795 | $0.88 | 43d | 1 | 1.19mi |
| 4101 Germania Ave Apt 1A St. Louis, MO | 1.0 | 1.0 | 800 | $925 | $1.16 | 14d | 1 | 1.23mi |
| 4117 Germania St Saint Louis, MO | 1.0 | 1.0 | 750 | $925 | $1.23 | 43d | 1 | 1.24mi |
| 807 W Courtois St Apt B St. Louis, MO | 1.0 | 1.0 | 600 | $735 | $1.23 | 43d | 1 | 1.26mi |
| 815 W Courtois St St. Louis, MO | 1.0 | 1.0 | 900 | $795 | $0.88 | 14d | 1 | 1.26mi |
| 807 W Courtois St Apt D St. Louis, MO | 2.0 | 1.0 | 900 | $925 | $1.03 | 43d | 1 | 1.26mi |
| 813 W Courtois St Apt C St. Louis, MO | 2.0 | 1.0 | 1000 | $895 | $0.90 | 43d | 1 | 1.26mi |
| 7500 Morganford Rd Saint Louis, MO | 1.0 | 1.0 | 750 | $925 | $1.23 | 43d | 1 | 1.28mi |
| 7428 Morganford Rd Saint Louis, MO | 2.0 | 1.0 | 969 | $1,500 | $1.55 | 43d | 1 | 1.34mi |
| 7614 Virginia Ave Unit 7614 St. Louis, MO | 2.0 | 1.0 | 750 | $750 | $1.00 | 23d | 1 | 1.34mi |
| 9954 Meadow Ave Saint Louis, MO | 2.0 | 1.0 | 1100 | $1,050 | $0.95 | 4d | 1 | 1.37mi |
| 4831 Oldenburg Ave Affton, MO | 2.0 | 1.0 | 775 | $1,110 | $1.43 | 12d | 1 | 1.39mi |
| 9964 Meadow Ave Saint Louis, MO | 1.0 | 1.0 | 950 | $775 | $0.82 | 7d | 1 | 1.40mi |
| 7417 Vermont Ave Unit 103 St. Louis, MO | 2.0 | 2.0 | 1069 | $1,500 | $1.40 | 14d | 1 | 1.42mi |
| 1908 Via Veneto Dr St. Louis, MO | 1.0–2.0 | 1.0 | 800 | $1,021 | $1.28 | 2d | 3 | 1.43mi |
| 7417 Vermont Ave St. Louis, MO | 1.0–2.0 | 1.0–2.0 | 1144 | $1,600 | $1.40 | 1d | 8 | 1.44mi |
| 7109 Eugene Ave Saint Louis, MO | 3.0 | 2.0 | 1029 | $1,495 | $1.45 | 2d | 1 | 1.49mi |
| 7113 Leona St Saint Louis, MO | 3.0 | 1.0 | 864 | $1,765 | $2.04 | 43d | 1 | 1.50mi |
Listing history 2 events
-
2026-06-18remarks 476-char remark
-
2026-06-18$140,000 Active 1 DOM
ⓘ Source: listings_history table (triggers on properties + properties_extension) + one-shot
backfill from property_details.listing_events for pre-trigger history.
Tax reassessment forecast MO · Resets to sale price
- Current annual tax
- $1,867 · $156/mo
- Projected year-2 tax
- $1,867 · $156/mo
- Expected delta
- $0/yr ($0/mo · 0.0%)
ⓘ Screening estimate from a state-policy table — verify with the county assessor before closing.
Climate risk First Street
- Flood 1/10 Low FEMA zone X (unshaded) · 0% chance over 30 yrs
- Wildfire 1/10 Low
- Heat 5/10 Major 7 d/yr ≥108°F today · 21 d/yr by 30 yrs out
- Wind 2/10 Low 100% chance of damaging wind over 30 yrs
- Air quality 3/10 Moderate 2 unhealthy d/yr today · 3 by 30 yrs out
Nearby sold comps map
Loading sold comps map…
Walkable amenities ~0.75 mi
Loading nearby amenities…
Taxation est. · year 1
- Rental income
- $14,714
- − Mortgage interest
- −$7,842
- − Property taxes
- −$1,867
- − Insurance
- −$700
- − Repairs & maintenance
- −$1,177
- − Management
- −$1,177
- − Depreciation
- −$4,073
- Taxable loss
- −$2,122
- Est. tax savings @ 24.0%
- +$509
- After-tax cash flow
- $756/yr
For passive investors: Depreciation is non-cash, so a rental often shows a tax loss while cash-flowing — sheltering income. Rental losses are passive: they offset passive income freely, and up to $25,000/yr can offset ordinary (W-2) income if you actively participate and your MAGI is under $100k (phasing out to $0 by $150k); unused losses carry forward. On sale, claimed depreciation is recaptured at up to 25%, and gains may owe capital-gains tax (a 1031 exchange can defer both). Figures are a year-1 estimate at your 24.0% rate — not tax advice; consult a CPA.
Schools (NCES district)
- District
- Bayless
- NCES district ID
- 2904500
- Math proficiency
- 28% ▼ -15.00%
- Reading proficiency
- 42% ▼ -8.00%
- Median HH income
- $49,378
- Composite
- 30.24/100
- National rank
- #6293
- State rank
- #206 of 324 in MO
Livability — Lemay
- Score
- 67/100
- State rank
- #213
- US rank
- #10652
Category grades
Schools grade is shown separately in the Schools card above.
Census & demographics
- Census place
- Lemay, MO
- County
- Saint Louis County · 888,823 people
- City population
- 33,294
- Metro
- St. Louis, MO-IL
- Population (ZIP)
- 33,294
- Household income
- $61,624
- Rent vs Own
- Severe rent burden
- 631.0
Population outlook (St. Louis County) Hauer SSP2
- Today (2025)
- 1,025,227 people
- By 2030
- 1,028,023 · +0.3%
- By 2040
- 1,020,940 · -0.4%
- By 2050
- 1,007,280 · -1.8%
- By 2075
- 987,277 · -3.7%
- By 2100
- 921,984 · -10.1%
Race, ethnicity, and origin ACS 2023
- Neighborhood character
- Predominantly White (86%)
- Race & ethnicity
- White 86% Two or more races 5% Black 4% Hispanic / Latino 4% Asian 2%
- Common ancestry
- American 9% Romanian 3% Lithuanian 3%
- Foreign-born
- 14% · Canada, Vietnam
- Languages at home
- 83% English-only · Russian/Polish/Slavic 11% Spanish 3% Vietnamese 1%
Political lean MEDSL · St. Louis
- 2024 margin
- Strong D (+23.4) · D 60.8% · R 37.4% · Other 1.7%
- 2008→2024 swing
- +3.5pp toward D · 2008: 19.9pp · 2024: 23.4pp
- All cycles
- 2024: D+23.4 2020: D+24.0 2016: D+16.2 2012: D+13.7 2008: D+19.9
Not yet ingested
- Civics
- —
Market trends
- HPI YoY
- ▼ -173.27%
- Current HPI
- 234.3792
- Rent YoY
- —
- Metro
- St. Louis, MO-IL
- State GDP YoY
- ▲ 1.84%
- F500 in state
- 20
Industry mix (Fortune 500 HQ in MO)
| Industry | F500 HQs | Revenue |
|---|---|---|
| Healthcare | 1 | $163B |
|
||
| Insurance | 1 | $21B |
|
||
| Industrial Technology | 1 | $17B |
|
||
| Retail | 1 | $16B |
|
||
| Industrial Distribution | 1 | $10B |
|
||
| Utilities | 1 | $9B |
|
||
Price history
1 event — show timeline
- 2026-06-18 Listed $140,000 MARIS as Distributed by MLS Grid
Property tax history
+1.6%/yrLatest (2022): $1,867 · +1.6% YoY. Source: county tax records.
Cash-flow waterfall
monthlySold comps — $/sqft
last 12 mo · ≤1 miLoading sold comps…