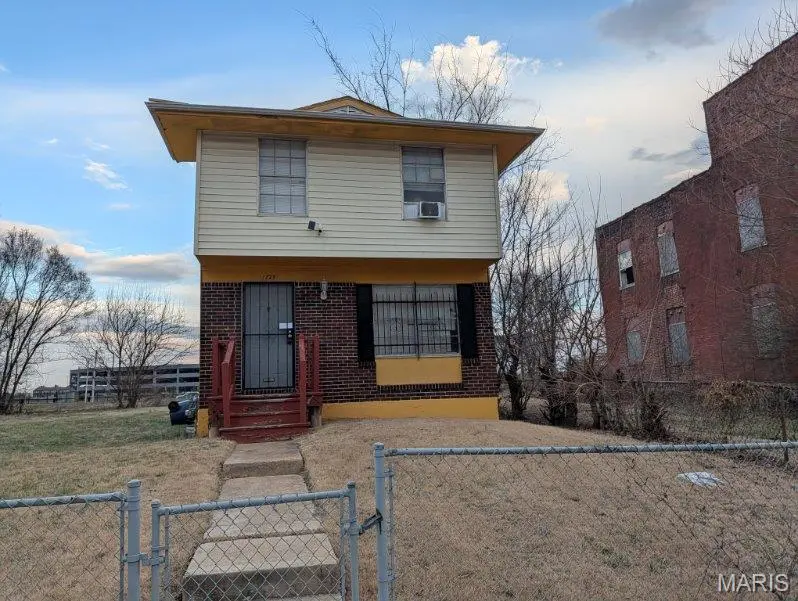
1724 Elliott Ave · St. Louis, MO
Flood risk 4/10 · Minor
- FEMA flood zone
- X (unshaded)
- Chance of flooding over 30 yrs
- 0.22%
- Est. flood insurance / yr
- $473 – $860
Fire risk 1/10 · Minimal
- Est. fire insurance / yr
- $1,054 – $1,958
Heat risk 5/10 · Moderate
- Hot days now (above 109°F)
- 7 days/yr
- Hot days in 30 yrs
- 21 days/yr
Wind risk 2/10 · Minimal
- Chance of severe wind over 30 yrs
- 1.0%
Air-quality risk 3/10 · Minor
- Unhealthy air days now
- 3 days/yr
- Unhealthy air days in 30 yrs
- 4 days/yr
Risk factors via First Street. Map © Google.
Why this score? — see what drove the B grade
The composite is a weighted blend of 9 inputs, each scored 0–100. Each bar is that input's sub-score; the figure is the points it added to the 100-point composite (weight × sub-score).
- Cash flow +30.0/30.0
- 1% rule +10.0/10.0
- DSCR +10.0/10.0
- ARV discount +7.5/15.0
- Appreciation +6.0/10.0
- Rent growth +2.5/5.0
- Livability +2.5/5.0
- Condition / age +2.5/5.0
- Schools +1.2/10.0
$66,000
🖨 Deal sheet (PDF) 📄 Offer letter ✓ Due diligence
Listing remarks MLS
Back on market, no fault of the seller, with a new price!!! Check out this equity-building house, being sold with the lot next to it also! This would be a great investment property, rental, or just someone wanting to have a nice house with a huge yard for activities. House being sold as-is, no repairs will be provided by seller.
Key facts
- 4,499 sq ft lot
- Built 1972
- Listed 56 days
Neighborhood map
What this means for you Summary
Snapshot
- This is a 3-bed/1.5-bath single-family listed at $66k.
Deal economics
- At list price, monthly cash flow is $950 ($11k/yr) — positive.
- The deal already cash-flows at list — no discount required.
- Meets the 1% rule at list price ($2k rent vs $66k).
- Recommended offer: $64k (3.0% below list) — sets the bar for market timing.
- Cap rate 23.6% vs local median 5.0% in St. Louis — top-decile yield for the area; either an underpriced asset or a hidden risk that comps aren't pricing in. Stress-test before assuming the spread holds.
Location & tenants
- Location reads: area grade B — affects rentability + tenant quality, not the cash-flow math above.
- St. Louis City (urban): math 10% / reading 18% proficiency, ranked #312 of 324 in MO (top 96%) — low school quality limits family demand, transient renter base, plan for 1-2y turnover; 80% free/reduced lunch — lower-income household profile, screen leases tightly.
- Market conditions: 15 active listings in the ZIP; 37 comparable units currently listed for rent nearby; rentals leasing fast (median 13d on market — plan ~1-2 weeks tenant-placement turnaround); 294 units permitted in St. Louis city in 2024 (227 in 5+ unit buildings).
Forward outlook
- In year one you build about $2k of equity ($456 loan paydown + $1k appreciation (1.9% local appreciation)).
- St. Louis County population projected to shrink 6% by 2050 — rents likely to lag national; underwrite the cash flow, not the appreciation.
- At projected returns (1.9% appreciation + 3.0% rent growth), your $18k cash investment doubles in ~2 years — after that, you're playing with house money.
Negotiation context
- It's been on market 57 days — a 3% lower offer ($64k) is reasonable based on typical stale-listing flexibility.
- 3 sale attempts; this cycle's ask has dropped $29k (31%) from the opening price — seller is motivated, your offer sets the floor, not the list.
Risks & watch-outs
- Climate carrying-cost: extreme-heat days projected 7→21/yr by 2055 (HVAC capex compounding) — expect insurance premiums to compound above CPI over the hold.
Questions for the listing agent
- It's been on market 57 days. Have you received any prior offers? Is the seller open to a 3% concession, seller financing, or rate buy-down credit?
- Built in 1972 — when were the roof, HVAC, electrical panel, plumbing, and water heater last replaced?
- Is there a deadline driving the sale (1031 exchange, divorce, estate, relocation)? That informs how much negotiation room exists.
- What's the average days-on-market for RENTAL listings here right now (not sales)? A rising rental-DOM trend means longer vacancies and softer asking-rent achievability than the comps imply.
- What's the recent tenant-quality profile in this submarket — average credit score on applications, eviction rate, late-payment / NSF rate, and stable-employment percentage? A property-management company in the area should have these aggregated.
- How much new for-sale + rental construction is in the pipeline within 1–3 miles? Heavy new supply typically softens prices + rents 12–24 months out; constrained supply supports both.
Investment metrics
- 1% rule
- 2.59% ✓
- Cap rate
- 23.56%
- Cash-on-cash
- 61.67%
- DSCR
- 3.74
- GRM
- 3.2
CMA / ARV
- ARV (median comp)
- $152,671
- List price
- $66,000
- Delta
- -56.77%
- Verdict
- UNDERPRICED
- Comps
- 20 within 1.0 mi
Show comp detail 5 sales within ~0.75 mi
| Address | Dist | Beds/Ba | Sqft | Sold | Price | $/sf | Match |
|---|---|---|---|---|---|---|---|
| 2239 University St | 0.53mi | 3/1.5 | 1,116 (-10%) | 10mo | $79,900 | $72 | 50 |
| 3721 Lincoln Ave | 0.72mi | 3/2.0 | 1,280 (+4%) | 15mo | $160,000 | $125 | 46 |
| 3055 Thomas St | 0.53mi | 3/2.0 | 1,064 (-14%) | 13mo | $100,000 | $94 | 39 |
| 3630 Garfield Ave | 0.65mi | 3/2.0 | 1,100 (-11%) | 13mo | $155,000 | $141 | 39 |
| 3721 Maffitt Ave | 0.74mi | 3/1.5 | 1,418 (+15%) | 21mo | $20,000 | $14 | 24 |
Match score weights: distance 35% · size 25% · config 20% · recency 20%. Top-matched comps best support the ARV.
Projected returns pro-forma
1.91% appreciation · 3.0% rent growth · sell at horizon
- IRR
- 65.4%
- Equity multiple
- 4.50×
- Total profit
- $64,693
- Equity at exit
- $25,700
- IRR
- 65.8%
- Equity multiple
- 9.14×
- Total profit
- $150,395
- Equity at exit
- $36,755
Cash invested: $18,480 (down + closing). Projections, not guarantees.
Landlord ↔ Tenant lean methodology
- Overall (STATE)
- 81 Strongly Landlord-Friendly
- State Missouri
- 81 Strongly Landlord-Friendly · R+10
- County
- — inherits STATE
- City
- — inherits STATE
ZIP-level market 63106
- Home prices YoY
- 1.4%
- Active inventory
- 15
- Price-to-rent
- 3.2×
Monthly cashflow live
- Estimated rent
- $1,711 high interval (Pro) →
- Mortgage (P&I)
- −$346
- Tax from tax record
- −$28 /mo · $341/yr
- Insurance
- −$28
- HOA
- −$0
- Vacancy / Maint / Mgmt
- −$359
- Net cashflow
- $950
Break-even live
Sensitivity live
| Price | -10% $987 | -5% $968 | +0% $950 | +5% $931 | +10% $912 |
|---|---|---|---|---|---|
| Rent | -10% $815 | -5% $882 | +0% $950 | +5% $1,017 | +10% $1,085 |
| Rate | -1.0pp $983 | -0.5pp $966 | base $950 | +0.5pp $933 | +1.0pp $915 |
UW: 25.0% down · 7.5% · 30yr · 1.5% tax · 5.0% vac · 8.0% maint · 8.0% mgmt
Financing live
Cash to close
- Down payment
- $16,500
- Closing costs
- $1,980
- Reserves months
- —
- Total cash needed
- —
Loan-product check · same deal, 3 products live
Conventional
25% down · 7.5% · 30yr
- Down + closing
- —
- Monthly P&I
- —
- Monthly cashflow
- —
- DSCR
- —
- Eligible?
- —
Personal DTI + credit; lowest rate.
DSCR
20% down · 8.5% · 30yr
- Down + closing
- —
- Monthly P&I
- —
- Monthly cashflow
- —
- DSCR
- —
- Eligible?
- —
No personal income docs; deal must DSCR.
Hard money
10% down · 12.0% · 12mo
- Down + closing
- —
- Monthly P&I
- —
- Monthly cashflow
- —
- DSCR
- —
- Eligible?
- —
Short-term bridge; refi at stabilization.
Rent comps 37 comps
| Address | Beds | Baths | Sqft | Rent | $/sqft | DOM | Units | Dist |
|---|---|---|---|---|---|---|---|---|
| 2239 University St Saint Louis, MO | 3.0 | 1.5 | 1116 | $1,295 | $1.16 | 12d | 1 | 0.55mi |
| 2605-2637 Washington Ave St. Louis, MO | 1.0–2.0 | 1.0–2.0 | 775 | $1,645 | $2.12 | 12d | 7 | 0.86mi |
| 2206 Lucas Ave St. Louis, MO | 1.0–2.0 | 1.0–2.0 | 1047 | $1,900 | $1.81 | 2d | 20 | 0.90mi |
| 715 N 21st St St. Louis, MO | 1.0–2.0 | 1.0–2.0 | 900 | $1,355 | $1.51 | 24d | 1 | 0.92mi |
| 2323 Locust St Saint Louis, MO | 1.0–2.0 | 1.0 | 1239 | $1,750 | $1.41 | 44d | 2 | 0.94mi |
| 2323 Locust ST #308 St Louis, MO | 2.0 | 1.0 | 1386 | $1,750 | $1.26 | 24d | 1 | 0.94mi |
| 3041 Locust St St. Louis, MO | 2.0 | 2.0 | 1243 | $2,072 | $1.67 | 44d | 1 | 0.95mi |
| 416 N 23rd St St. Louis, MO | 1.0–2.0 | 1.0 | 780 | $1,775 | $2.28 | 5d | 23 | 0.96mi |
| 2034 Lucas Ave St. Louis, MO | 1.0–2.0 | 1.0 | 1080 | $1,525 | $1.41 | 44d | 1 | 0.97mi |
| 2217 Locust St Saint Louis, MO | 2.0 | 2.0 | 830 | $1,475 | $1.78 | 44d | 1 | 0.98mi |
| 1910 Agnes St Saint Louis, MO | 3.0 | 1.0 | 704 | $1,200 | $1.70 | 44d | 1 | 0.99mi |
| 2200 Locust St Saint Louis, MO | 1.0–2.0 | 1.0–1.5 | 862 | $1,695 | $1.97 | 4d | 6 | 1.03mi |
| 1901 Washington Ave Saint Louis, MO | 1.0–2.0 | 1.0–2.0 | 1076 | $1,500 | $1.39 | 5d | 38 | 1.06mi |
| 1900 Washington Ave Saint Louis, MO | 1.0–2.0 | 1.0–2.0 | 960 | $1,650 | $1.72 | 2d | 12 | 1.07mi |
| 3307 Olive St St. Louis, MO | 1.0–2.0 | 1.0 | 912 | $1,220 | $1.34 | 44d | 1 | 1.07mi |
| 1800 Washington Ave Saint Louis, MO | 1.0–2.0 | 1.0–2.0 | 927 | $1,645 | $1.77 | 44d | 13 | 1.12mi |
| 1815 Locust St Saint Louis, MO | 1.0–2.0 | 1.0–2.0 | 983 | $1,543 | $1.57 | 44d | 7 | 1.13mi |
| 1706 Washington Ave St. Louis, MO | 1.0–2.0 | 1.0–2.0 | 997 | $1,761 | $1.77 | 2d | 10 | 1.17mi |
| 1635 Washington Ave Saint Louis, MO | 1.0–2.0 | 1.0 | 1135 | $1,495 | $1.32 | 3d | 4 | 1.17mi |
| 1627 Washington Ave Unit 202 St. Louis, MO | 2.0 | 1.0 | 1450 | $1,625 | $1.12 | 44d | 1 | 1.18mi |
| 1627 Washington Ave Apt 503 St. Louis, MO | 2.0 | 2.0 | 1400 | $1,750 | $1.25 | 44d | 1 | 1.18mi |
| 1717 Olive St Saint Louis, MO | 2.0 | 1.0–2.0 | 957 | $2,982 | $3.12 | 2d | 64 | 1.23mi |
| 1531 Washington Ave St. Louis, MO | 1.0–2.0 | 1.0 | 656 | $1,609 | $2.45 | 2d | 5 | 1.24mi |
| 2603 Belle Glade Ave Saint Louis, MO | 2.0 | 1.0 | 945 | $800 | $0.85 | 5d | 1 | 1.31mi |
| 3681 Lindell Blvd Saint Louis, MO | 3.0 | 1.0–2.5 | 1292 | $3,579 | $2.77 | 2d | 62 | 1.33mi |
| 1111 Biddle St Saint Louis, MO | 2.0 | 1.0 | 1200 | $1,295 | $1.08 | 44d | 1 | 1.34mi |
| 110 N 17th St Saint Louis, MO | 2.0 | 1.0 | 653 | $1,095 | $1.68 | 8d | 1 | 1.34mi |
| 1300 Convention Plz Saint Louis, MO | 2.0 | 1.0 | 877 | $1,350 | $1.54 | 44d | 1 | 1.36mi |
| 3717-3721 Westminster Pl St. Louis, MO | 3.0 | 1.0–3.0 | 1343 | $2,735 | $2.04 | 17d | 4 | 1.36mi |
| 1115 Carr St St. Louis, MO | 1.0–2.0 | 1.0 | 747 | $1,123 | $1.50 | 5d | 13 | 1.36mi |
| 1307 Washington Ave St. Louis, MO | 1.0–2.0 | 1.0 | 1261 | $1,485 | $1.18 | 8d | 17 | 1.36mi |
| 3701 Lindell Blvd Saint Louis, MO | 3.0 | 1.0–3.0 | 1073 | $2,500 | $2.33 | 17d | 81 | 1.39mi |
| 3701 Lindell Blvd Saint Louis, MO | 3.0 | 1.0–3.0 | 1073 | $2,500 | $2.33 | 2d | 128 | 1.39mi |
| 1209 Washington Ave Saint Louis, MO | 1.0–2.0 | 1.5–2.0 | 1483 | $2,190 | $1.48 | 2d | 22 | 1.42mi |
| 1405 Pine St St. Louis, MO | 2.0 | 2.0 | 1020 | $1,240 | $1.22 | 4d | 1 | 1.45mi |
| 1133 Washington Ave St. Louis, MO | 2.0 | 1.0–2.0 | 637 | $1,292 | $2.03 | 44d | 1 | 1.47mi |
| 1708 Annie Malone Dr Saint Louis, MO | 3.0 | 1.5 | 924 | $1,500 | $1.62 | 44d | 1 | 1.47mi |
Listing history 11 events
-
2026-06-01days on market $66,000 Active 57 DOM
-
2026-05-31days on market $66,000 Active 56 DOM
-
2026-04-29price $73,000 332-char remark
Show marketing remark (332 chars)
Back on market, no fault of the seller, with a new price!!! Check out this equity-building house, being sold with the lot next to it also! This would be a great investment property, rental, or just someone wanting to have a nice house with a huge yard for activities. House being sold as-is, no repairs will be provided by seller.
-
2026-04-23status Active 332-char remark
Show marketing remark (332 chars)
Back on market, no fault of the seller, with a new price!!! Check out this equity-building house, being sold with the lot next to it also! This would be a great investment property, rental, or just someone wanting to have a nice house with a huge yard for activities. House being sold as-is, no repairs will be provided by seller.
-
2026-04-23price $82,500 332-char remark
Show marketing remark (332 chars)
Back on market, no fault of the seller, with a new price!!! Check out this equity-building house, being sold with the lot next to it also! This would be a great investment property, rental, or just someone wanting to have a nice house with a huge yard for activities. House being sold as-is, no repairs will be provided by seller.
-
2026-04-15status Pending 332-char remark
Show marketing remark (332 chars)
Back on market, no fault of the seller, with a new price!!! Check out this equity-building house, being sold with the lot next to it also! This would be a great investment property, rental, or just someone wanting to have a nice house with a huge yard for activities. House being sold as-is, no repairs will be provided by seller.
-
2026-04-09price $87,500 332-char remark
Show marketing remark (332 chars)
Back on market, no fault of the seller, with a new price!!! Check out this equity-building house, being sold with the lot next to it also! This would be a great investment property, rental, or just someone wanting to have a nice house with a huge yard for activities. House being sold as-is, no repairs will be provided by seller.
-
2026-03-29$95,000 Active 332-char remark
Show marketing remark (332 chars)
Back on market, no fault of the seller, with a new price!!! Check out this equity-building house, being sold with the lot next to it also! This would be a great investment property, rental, or just someone wanting to have a nice house with a huge yard for activities. House being sold as-is, no repairs will be provided by seller.
-
2026-03-28historical $95,000 332-char remark
Show marketing remark (332 chars)
Back on market, no fault of the seller, with a new price!!! Check out this equity-building house, being sold with the lot next to it also! This would be a great investment property, rental, or just someone wanting to have a nice house with a huge yard for activities. House being sold as-is, no repairs will be provided by seller.
-
2025-09-22$60,000 Active
-
2025-09-22historical
ⓘ Source: listings_history table (triggers on properties + properties_extension) + one-shot
backfill from property_details.listing_events for pre-trigger history.
Tax reassessment forecast MO · Resets to sale price
- Current annual tax
- $341 · $28/mo
- Projected year-2 tax
- $640 · $53/mo
- Expected delta
- +$299/yr (+$25/mo · 87.8%)
ⓘ Screening estimate from a state-policy table — verify with the county assessor before closing.
Climate risk First Street
- Flood 4/10 Moderate FEMA zone X (unshaded) · 22% chance over 30 yrs
- Wildfire 1/10 Low
- Heat 5/10 Major 7 d/yr ≥109°F today · 21 d/yr by 30 yrs out
- Wind 2/10 Low 100% chance of damaging wind over 30 yrs
- Air quality 3/10 Moderate 3 unhealthy d/yr today · 4 by 30 yrs out
Nearby sold comps map
Loading sold comps map…
Walkable amenities ~0.75 mi
Loading nearby amenities…
Taxation est. · year 1
- Rental income
- $20,532
- − Mortgage interest
- −$3,697
- − Property taxes
- −$341
- − Insurance
- −$330
- − Repairs & maintenance
- −$1,643
- − Management
- −$1,643
- − Depreciation
- −$1,920
- Taxable income
- $10,959
- Est. tax owed @ 24.0%
- −$2,630
- After-tax cash flow
- $8,766/yr
For passive investors: Depreciation is non-cash, so a rental often shows a tax loss while cash-flowing — sheltering income. Rental losses are passive: they offset passive income freely, and up to $25,000/yr can offset ordinary (W-2) income if you actively participate and your MAGI is under $100k (phasing out to $0 by $150k); unused losses carry forward. On sale, claimed depreciation is recaptured at up to 25%, and gains may owe capital-gains tax (a 1031 exchange can defer both). Figures are a year-1 estimate at your 24.0% rate — not tax advice; consult a CPA.
Schools (NCES district)
- District
- St. Louis City
- NCES district ID
- 2929280
- Math proficiency
- 10% ▼ -6.00%
- Reading proficiency
- 18% ▼ -3.00%
- Median HH income
- $35,685
- Composite
- 11.54/100
- National rank
- #9699
- State rank
- #312 of 324 in MO
Livability — St. Louis
No livability data for this city. (Only ~50 U.S. cities are tracked.)
Census & demographics
- Census place
- St. Louis, MO
- City population
- 283,259
- Population (ZIP)
- 7,742
Population outlook (St. Louis County) Hauer SSP2
- Today (2025)
- 315,737 people
- By 2030
- 313,865 · -0.6%
- By 2040
- 305,439 · -3.3%
- By 2050
- 296,529 · -6.1%
- By 2075
- 271,028 · -14.2%
- By 2100
- 255,359 · -19.1%
Race, ethnicity, and origin ACS 2023
- Neighborhood character
- Predominantly Black (89%)
- Race & ethnicity
- Black 89% White 7% Two or more races 2% Hispanic / Latino 2%
- Foreign-born
- 5% · Canada
- Languages at home
- 93% English-only · Spanish 2%
Political lean MEDSL · St. Louis
- 2024 margin
- Solid D (+64.7) · D 81.4% · R 16.7% · Other 2.0%
- 2008→2024 swing
- -3.5pp toward R · 2008: 68.2pp · 2024: 64.7pp
- All cycles
- 2024: D+64.7 2020: D+66.2 2016: D+63.7 2012: D+66.6 2008: D+68.2
Not yet ingested
- Civics
- —
Market trends
- HPI YoY
- ▲ 1.91%
- Current HPI
- 133.284
- Rent YoY
- —
- Metro
- —
- State GDP YoY
- ▲ 1.84%
- F500 in state
- 20
Industry mix (Fortune 500 HQ in MO)
| Industry | F500 HQs | Revenue |
|---|---|---|
| Healthcare | 1 | $163B |
|
||
| Insurance | 1 | $21B |
|
||
| Industrial Technology | 1 | $17B |
|
||
| Retail | 1 | $16B |
|
||
| Industrial Distribution | 1 | $10B |
|
||
| Utilities | 1 | $9B |
|
||
Price history
+21.7% since first listed9 events — show timeline
- 2026-04-29 Price Changed $73,000 MARIS as Distributed by MLS Grid
- 2026-04-23 Relisted — MARIS as Distributed by MLS Grid
- 2026-04-23 Price Changed $82,500 MARIS as Distributed by MLS Grid
- 2026-04-15 Pending — MARIS as Distributed by MLS Grid
- 2026-04-09 Price Changed $87,500 MARIS as Distributed by MLS Grid
- 2026-03-29 Listed $95,000 MARIS as Distributed by MLS Grid
- 2026-03-28 Coming Soon $95,000 MARIS as Distributed by MLS Grid
- 2025-09-22 Listed $60,000 MARIS as Distributed by MLS Grid
- 2025-09-22 Coming Soon — MARIS as Distributed by MLS Grid
Property tax history
+0.8%/yrLatest (2023): $341 · -1.8% YoY. Source: county tax records.
Cash-flow waterfall
monthlySold comps — $/sqft
last 12 mo · ≤1 miLoading sold comps…