 Duplex
1360 E Locust St · Springfield, MO
Flood risk 4/10 · Minor
- FEMA flood zone
- X (unshaded)
- Chance of flooding over 30 yrs
- 0.22%
- Est. flood insurance / yr
- $507 – $1,088
Fire risk 1/10 · Minimal
- Est. fire insurance / yr
- $1,054 – $1,958
Heat risk 5/10 · Moderate
- Hot days now (above 104°F)
- 7 days/yr
- Hot days in 30 yrs
- 19 days/yr
Wind risk 2/10 · Minimal
- Chance of severe wind over 30 yrs
- —
Air-quality risk 2/10 · Minimal
- Unhealthy air days now
- 1 days/yr
- Unhealthy air days in 30 yrs
- 2 days/yr
Risk factors via First Street. Map © Google.
Why this score? — see what drove the B grade
The composite is a weighted blend of 9 inputs, each scored 0–100. Each bar is that input's sub-score; the figure is the points it added to the 100-point composite (weight × sub-score).
- Cash flow +29.3/30.0
- ARV discount +13.8/15.0
- DSCR +10.0/10.0
- 1% rule +7.2/10.0
- Livability +3.8/5.0
- Rent growth +3.6/5.0
- Schools +3.2/10.0
- Condition / age +2.5/5.0
- Appreciation +0.0/10.0
$160,000
🖨 Deal sheet 📄 Offer letter ✓ Due diligence
Multi-family units
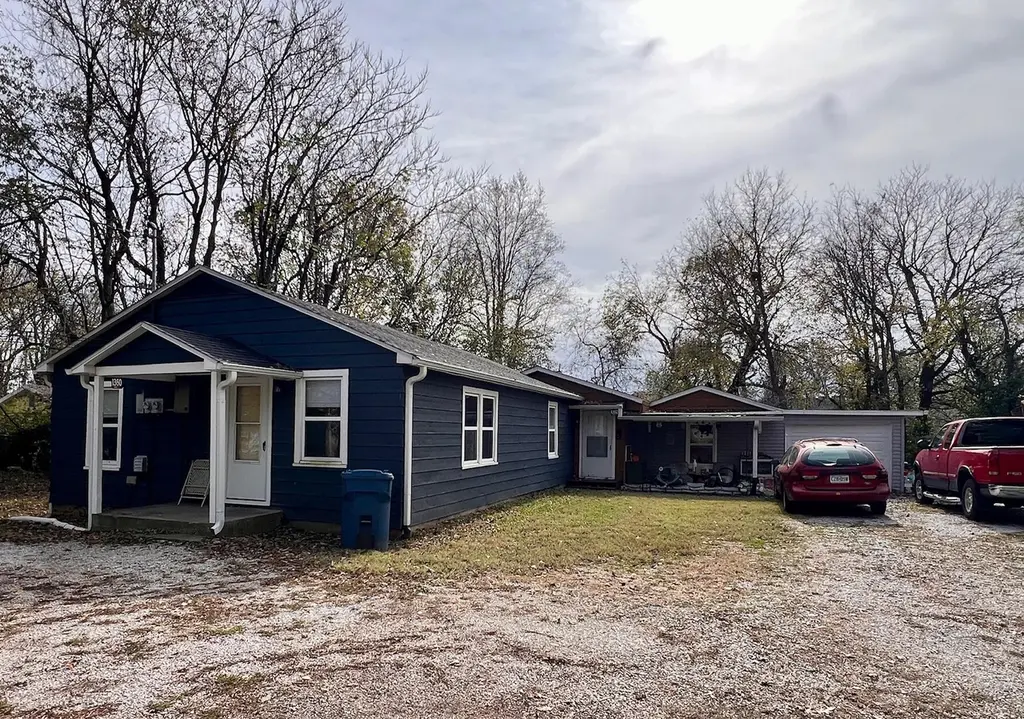
County records classify this as Multi-Family (2-4 Unit). Listing-text estimate: 2 units. confirmed
Listing remarks MLS
Great investment duplex close to Evangel University. Each unit has two bedrooms, one bathroom, and central HVAC. The unit in the back has a one car attached garage.
Key facts
- Central hvac
- Attached garage
- Investment duplex
Tags
Neighborhood map
What this means for you Summary
Snapshot
- This is a 2 × 2-bed/1-bath units multifamily listed at $160k.
Deal economics
- At list price, monthly cash flow is $561 ($7k/yr) — positive. Per door: $281/mo.
- The deal already cash-flows at list — no discount required.
- Meets the 1% rule at list price ($2k rent vs $160k).
- Recommended offer: $141k (12.0% below list) — sets the bar for market timing.
- Cap rate 10.5% vs local median 4.6% in Springfield — top-decile yield for the area; either an underpriced asset or a hidden risk that comps aren't pricing in. Stress-test before assuming the spread holds.
Location & tenants
- Location reads 75/100 on livability (#57 in MO, #4,121 nationally) — a middle-class / working-renter tenant base. Strengths: commute A+, cost of living A+, housing A+; Watch: crime F, employment F.
- Springfield R-XII (urban): math 32% / reading 46% proficiency, ranked #174 of 324 in MO (top 54%) — families likely to look elsewhere, expect single-tenant / working-renter base with shorter leases.
- Market conditions: Rents rising fast (+4.2%/yr); 394 active listings in the ZIP; 10 comparable units currently listed for rent nearby; rentals at typical pace (median 24d on market — plan ~3-4 weeks tenant-placement turnaround); 40% of comp listings sitting > 30 days — soft ceiling on asking rent; 1,302 units permitted in Greene County in 2024 (250 in 5+ unit buildings).
- At $1,945/mo this rent would consume 46% of the median local household income ($51k/yr) (locally 1305% of renters already pay >50% of income on rent) — very limited rent-growth headroom before tenants either downsize or default.
Forward outlook
- Local home prices are declining (-3.0%/yr); year-one equity from $1k of loan paydown is wiped out by about $5k of value loss. Plan a longer hold.
- Greene County population projected at +25% by 2050 — long-run rental-demand tailwind backs the buy-and-hold thesis.
- At projected returns (-3.0% appreciation + 4.2% rent growth), your $45k cash investment doubles in ~8 years — after that, you're playing with house money.
Negotiation context
- It's been on market 176 days — a 12% lower offer ($141k) is reasonable based on typical stale-listing flexibility.
- 5 sale attempts since 5y ago with the ask held roughly flat each time — persistent listings suggest the price (not the market) is what's stuck; bring a comps-based counter.
Risks & watch-outs
- Watch-outs: built in 1938 — expect roof / HVAC / electrical / plumbing capex.
- Climate carrying-cost: extreme-heat days projected 7→19/yr by 2055 (HVAC capex compounding) — expect insurance premiums to compound above CPI over the hold.
Questions for the listing agent
- It's been on market 176 days. Have you received any prior offers? Is the seller open to a 12% concession, seller financing, or rate buy-down credit?
- Can we see the unit-by-unit rent roll, current vacancy, and any below-market leases? What's the average tenancy length?
- What capital expenditures (roof, boiler, parking lot, exteriors) have been made in the last 5 years, and what's planned in the next 2?
- Built in 1938 — when were the roof, HVAC, electrical panel, plumbing, and water heater last replaced?
- Why hasn't it sold? Are there any deal-killer items the seller is aware of (foundation, flood, title, zoning, code violations)?
- Is there a deadline driving the sale (1031 exchange, divorce, estate, relocation)? That informs how much negotiation room exists.
- Crime grade is F in this area — have there been break-ins, vandalism, or insurance claims at this property in the last 3 years? What carrier currently insures it and at what premium?
- What's the average days-on-market for RENTAL listings here right now (not sales)? A rising rental-DOM trend means longer vacancies and softer asking-rent achievability than the comps imply.
- What's the recent tenant-quality profile in this submarket — average credit score on applications, eviction rate, late-payment / NSF rate, and stable-employment percentage? A property-management company in the area should have these aggregated.
- How much new apartment / multifamily construction is in the pipeline within 1–3 miles? Heavy new supply (>2% of stock underway) typically softens rents 12–24 months out; light construction supports rent growth.
Investment metrics
- 1% rule
- 1.22% ✓
- Cap rate
- 10.50%
- Cash-on-cash
- 15.04%
- DSCR
- 1.67
- GRM
- 6.9
CMA / ARV
- ARV (median comp)
- $186,201
- List price
- $160,000
- Delta
- -14.07%
- Verdict
- UNDERPRICED
- Comps
- 12 within 1.0 mi
Projected returns pro-forma
-3.0% appreciation · 4.24% rent growth · sell at horizon
- IRR
- 6.9%
- Equity multiple
- 1.27×
- Total profit
- $12,230
- Equity at exit
- $23,857
- IRR
- 17.2%
- Equity multiple
- 2.49×
- Total profit
- $66,817
- Equity at exit
- $13,834
Cash invested: $44,800 (down + closing). Projections, not guarantees.
Landlord ↔ Tenant lean methodology
- Overall (STATE)
- 81 Strongly Landlord-Friendly
- State Missouri
- 81 Strongly Landlord-Friendly · R+10
- County
- — inherits STATE
- City
- — inherits STATE
ZIP-level market 65803
- Home prices YoY
- -29.8%
- Rents YoY
- 4.2%
- Active inventory
- 394
- Price-to-rent
- 13.7×
Monthly cashflow live
- Estimated rent
- $1,945 high interval (Pro) →
- Mortgage (P&I)
- −$839
- Tax from tax record
- −$69 /mo · $834/yr
- Insurance
- −$67
- HOA
- −$0
- Vacancy / Maint / Mgmt
- −$408
- Net cashflow
- $561
Break-even live
2-unit breakdown (identical units grouped — click to expand)
| Units | Beds | Baths | Est. rent |
|---|---|---|---|
| 2× units | 2 | 1 | $1,944 |
| #1 | 2 | 1 | $972 |
| #2 | 2 | 1 | $972 |
| Total (2 units) | $1,945 | ||
UW: 25.0% down · 7.5% · 30yr · 1.5% tax · 5.0% vac · 8.0% maint · 8.0% mgmt
Financing live
Cash to close
- Down payment
- $40,000
- Closing costs
- $4,800
- Reserves months
- —
- Total cash needed
- —
Loan-product check · same deal, 3 products live
Conventional
25% down · 7.5% · 30yr
- Down + closing
- —
- Monthly P&I
- —
- Monthly cashflow
- —
- DSCR
- —
- Eligible?
- —
Personal DTI + credit; lowest rate.
DSCR
20% down · 8.5% · 30yr
- Down + closing
- —
- Monthly P&I
- —
- Monthly cashflow
- —
- DSCR
- —
- Eligible?
- —
No personal income docs; deal must DSCR.
Hard money
10% down · 12.0% · 12mo
- Down + closing
- —
- Monthly P&I
- —
- Monthly cashflow
- —
- DSCR
- —
- Eligible?
- —
Short-term bridge; refi at stabilization.
Rent comps 10 comps
| Address | Beds | Baths | Sqft | Rent | $/sqft | DOM | Units | Dist |
|---|---|---|---|---|---|---|---|---|
| 1339 E Division St Springfield, MO | 3.0 | 2.0 | 1186 | $1,350 | $1.14 | 23d | 1 | 0.10mi |
| 1636 N National Ave Springfield, MO | 3.0 | 1.5 | 1000 | $995 | $0.99 | 44d | 1 | 0.24mi |
| 1442 N Texas Ave Springfield, MO | 3.0 | 2.0 | 1626 | $1,400 | $0.86 | 44d | 1 | 0.47mi |
| 1439 N Texas Ave Springfield, MO | 4.0 | 2.0 | 1608 | $1,195 | $0.74 | 44d | 1 | 0.50mi |
| 916 N Pickwick Ave Springfield, MO | 4.0 | 3.0 | 1827 | $1,700 | $0.93 | 13d | 1 | 0.64mi |
| 2153 N National Ave Springfield, MO | 3.0 | 1.0 | 1163 | $1,195 | $1.03 | 13d | 1 | 0.71mi |
| 2221 N Weller Ave Springfield, MO | 3.0 | 2.0 | 1215 | $1,395 | $1.15 | 13d | 1 | 0.73mi |
| 1530 N Robberson Ave Springfield, MO | 3.0 | 2.0 | 1122 | $1,425 | $1.27 | 44d | 1 | 1.07mi |
| 2323 E Division St Springfield, MO | 4.0 | 2.0 | 1156 | $1,495 | $1.29 | 23d | 1 | 1.23mi |
| STE Springfield, MO | 3.0 | 2.0 | 1477 | $1,600 | $1.08 | 13d | 2 | 1.38mi |
Listing history 22 events
-
2026-06-18days on market $160,000 Active 176 DOM
-
2026-06-17days on market $160,000 Active 175 DOM
-
2026-06-16days on market $160,000 Active 174 DOM
-
2026-06-15days on market $160,000 Active 173 DOM
-
2026-06-14days on market $160,000 Active 171 DOM
-
2026-06-10days on market $160,000 Active 168 DOM
-
2026-06-09days on market $160,000 Active 167 DOM
-
2026-06-08days on market $160,000 Active 166 DOM
-
2026-06-07days on market $160,000 Active 165 DOM
-
2026-06-03days on market $160,000 Active 161 DOM
-
2026-06-02days on market $160,000 Active 160 DOM
-
2026-06-01days on market $160,000 Active 159 DOM
-
2026-05-31days on market $160,000 Active 158 DOM
-
2026-05-30days on market $160,000 Active 157 DOM
-
2026-02-03status Active 164-char remark
Show marketing remark (164 chars)
Great investment duplex close to Evangel University. Each unit has two bedrooms, one bathroom, and central HVAC. The unit in the back has a one car attached garage.
-
2026-01-17status Pending 164-char remark
Show marketing remark (164 chars)
Great investment duplex close to Evangel University. Each unit has two bedrooms, one bathroom, and central HVAC. The unit in the back has a one car attached garage.
-
2025-12-06$160,000 Active 164-char remark
Show marketing remark (164 chars)
Great investment duplex close to Evangel University. Each unit has two bedrooms, one bathroom, and central HVAC. The unit in the back has a one car attached garage.
-
2025-05-21status Active
-
2025-05-09historical
-
2024-11-08$179,900 Active
-
2021-09-21soldstatus
-
2021-08-19$79,900
ⓘ Source: listings_history table (triggers on properties + properties_extension) + one-shot
backfill from property_details.listing_events for pre-trigger history.
Tax reassessment forecast MO · Resets to sale price
- Current annual tax
- $834 · $69/mo
- Projected year-2 tax
- $1,552 · $129/mo
- Expected delta
- +$718/yr (+$60/mo · 86.1%)
ⓘ Screening estimate from a state-policy table — verify with the county assessor before closing.
Climate risk First Street
- Flood 4/10 Moderate FEMA zone X (unshaded) · 22% chance over 30 yrs
- Wildfire 1/10 Low
- Heat 5/10 Major 7 d/yr ≥104°F today · 19 d/yr by 30 yrs out
- Wind 2/10 Low
- Air quality 2/10 Low 1 unhealthy d/yr today · 2 by 30 yrs out
Nearby sold comps map
Loading sold comps map…
Walkable amenities ~0.75 mi
Loading nearby amenities…
Taxation est. · year 1
- Rental income
- $23,340
- − Mortgage interest
- −$8,962
- − Property taxes
- −$834
- − Insurance
- −$800
- − Repairs & maintenance
- −$1,867
- − Management
- −$1,867
- − Depreciation
- −$4,655
- Taxable income
- $4,355
- Est. tax owed @ 24.0%
- −$1,045
- After-tax cash flow
- $5,691/yr
For passive investors: Depreciation is non-cash, so a rental often shows a tax loss while cash-flowing — sheltering income. Rental losses are passive: they offset passive income freely, and up to $25,000/yr can offset ordinary (W-2) income if you actively participate and your MAGI is under $100k (phasing out to $0 by $150k); unused losses carry forward. On sale, claimed depreciation is recaptured at up to 25%, and gains may owe capital-gains tax (a 1031 exchange can defer both). Figures are a year-1 estimate at your 24.0% rate — not tax advice; consult a CPA.
Schools (NCES district)
- District
- Springfield R-XII
- NCES district ID
- 2928860
- Math proficiency
- 32% ▼ -2.00%
- Reading proficiency
- 46% ▼ -3.00%
- Median HH income
- $37,886
- Composite
- 32.45/100
- National rank
- #5717
- State rank
- #174 of 324 in MO
Livability — Springfield
- Score
- 75/100
- State rank
- #57
- US rank
- #4121
Category grades
Schools grade is shown separately in the Schools card above.
Census & demographics
- Census place
- Springfield, MO
- County
- Greene County · 244,327 people
- City population
- 223,044
- Metro
- Springfield, MO
- Population (ZIP)
- 42,882
- Household income
- $50,572
- Rent vs Own
- Severe rent burden
- 1305.0
Population outlook (Greene County) Hauer SSP2
- Today (2025)
- 319,054 people
- By 2030
- 335,135 · +5.0%
- By 2040
- 366,186 · +14.8%
- By 2050
- 397,431 · +24.6%
- By 2075
- 477,035 · +49.5%
- By 2100
- 520,828 · +63.2%
Race, ethnicity, and origin ACS 2023
- Neighborhood character
- Predominantly White (82%)
- Race & ethnicity
- White 82% Two or more races 9% Hispanic / Latino 6% Black 4%
- Hispanic origin (detail)
- Mexican 2% Puerto Rican 2%
- Common ancestry
- Lithuanian 2% Italian 2% Iranian 2%
- Foreign-born
- 3% · Canada
- Languages at home
- 95% English-only · Spanish 3%
Political lean MEDSL · Greene
- 2024 margin
- Strong R (+20.8) · D 38.9% · R 59.7% · Other 1.4%
- 2008→2024 swing
- -5.0pp toward R · 2008: -15.8pp · 2024: -20.8pp
- All cycles
- 2024: R+20.8 2020: R+20.1 2016: R+27.4 2012: R+24.4 2008: R+15.8
Not yet ingested
- Civics
- —
Market trends
- HPI YoY
- ▼ -87.08%
- Current HPI
- 205.0439
- Rent YoY
- ▲ 4.24%
- Metro
- Springfield, MO
- State GDP YoY
- ▲ 1.84%
- F500 in state
- 20
Industry mix (Fortune 500 HQ in MO)
| Industry | F500 HQs | Revenue |
|---|---|---|
| Healthcare | 1 | $163B |
|
||
| Insurance | 1 | $21B |
|
||
| Industrial Technology | 1 | $17B |
|
||
| Retail | 1 | $16B |
|
||
| Industrial Distribution | 1 | $10B |
|
||
| Utilities | 1 | $9B |
|
||
Price history
+100.3% since first listed8 events — show timeline
- 2026-02-03 Relisted — SOMO
- 2026-01-17 Pending — SOMO
- 2025-12-06 Listed $160,000 SOMO
- 2025-05-21 Relisted — SOMO
- 2025-05-09 Delisted — SOMO
- 2024-11-08 Listed $179,900 SOMO
- 2021-09-21 Sold (MLS) — SOMO
- 2021-08-19 Listed $79,900 SOMO
Property tax history
+6.6%/yrLatest (2025): $834 · +44.3% YoY. Source: county tax records.
Cash-flow waterfall
monthlySold comps — $/sqft
last 12 mo · ≤1 miLoading sold comps…