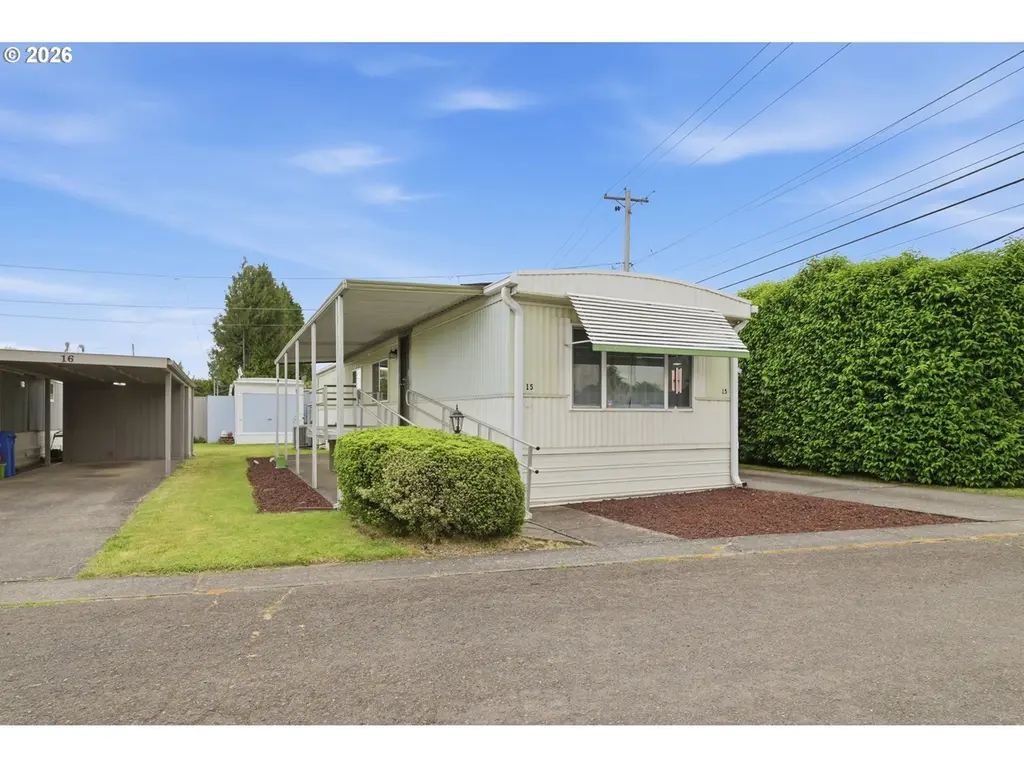
501 Division Ave #15 · Eugene, OR
Flood risk 5/10 · Moderate
- FEMA flood zone
- X (unshaded)
- Chance of flooding over 30 yrs
- 0.24%
- Est. flood insurance / yr
- $507 – $1,088
Fire risk 2/10 · Minimal
- Est. fire insurance / yr
- $498 – $926
Heat risk 4/10 · Minor
- Hot days now (above 93°F)
- 7 days/yr
- Hot days in 30 yrs
- 15 days/yr
Wind risk 1/10 · Minimal
- Chance of severe wind over 30 yrs
- —
Air-quality risk 10/10 · Severe
- Unhealthy air days now
- 13 days/yr
- Unhealthy air days in 30 yrs
- 15 days/yr
Risk factors via First Street. Map © Google.
Why this score? — see what drove the D+ grade
The composite is a weighted blend of 9 inputs, each scored 0–100. Each bar is that input's sub-score; the figure is the points it added to the 100-point composite (weight × sub-score).
- Cash flow +15.0/30.0
- ARV discount +7.5/15.0
- 1% rule +5.0/10.0
- DSCR +5.0/10.0
- Schools +4.2/10.0
- Livability +4.0/5.0
- Rent growth +3.4/5.0
- Condition / age +2.5/5.0
- Appreciation +0.0/10.0
$19,999
🖨 Deal sheet 📄 Offer letter ✓ Due diligence
Listing remarks MLS
Great manufactured home in Lee's Mobil Home +55 Park. This 840 sqft manufactured home is in excellent condition inside and out. New roof in 2013, new exterior paint and gutters in 2012, fully applianced kitchen including a one year old dishwasher. This home has been very well cared for and maintained, don't miss this opportunity.
Key facts
- Move-in ready
- Ideally located
- Built 1980
Tags
Property features AI
Finance
- Financial info: Land lease (monthly lot rent $720) — lease expires December 31, 2026
- HOA & community: Park amenities include water and sewer; Located in Lee's Mobil home park; Senior community
Exterior
- Parking: Covered carport
- Utilities: Public water; Public sewer; Electric service
- Home design: Manufactured home in a park (residential, resale); Single‑story (main level living); No view; Manufacturer: Ridgw
- Construction: Built in 1980; Pillar/post/pier foundation
- Exterior features: Metal siding; Corner, level lot; Concrete and paved road access; Membrane roof
Interior
- Kitchen: Dishwasher; Free‑standing range; Free‑standing refrigerator; Electric hot water
- Bedrooms: Primary bedroom on main level; Second bedroom on main level
- Bathrooms: One full bathroom (main level)
- Heating & cooling: Forced air heating; Heat pump (heating and cooling)
- Interior features: Accessible approach with ramp; Laundry area; Vinyl window frames
- Laundry & utility: Laundry area (in unit)
Neighborhood map
What this means for you Summary
Snapshot
- This is a 2-bed/1.0-bath manufactured listed at $20k.
Deal economics
- At list price, monthly cash flow is $1k ($15k/yr) — positive.
- The deal already cash-flows at list — no discount required.
- Meets the 1% rule at list price ($2k rent vs $20k).
- Cap rate 80.1% vs local median 2.8% in Eugene — top-decile yield for the area; either an underpriced asset or a hidden risk that comps aren't pricing in. Stress-test before assuming the spread holds.
Location & tenants
- Location reads 81/100 on livability (#52 in OR, #1,587 nationally) — a professional / high-income tenant draw. Strengths: amenities A+, commute A+, health & safety A+; Watch: employment C-, cost of living C-, crime D-.
- Eugene SD 4J (urban): math 45% / reading 55% proficiency, ranked #10 of 58 in OR (top 17%) — acceptable for families but not a draw, mixed tenant base, ~2y average lease.
- Zoned schools: Awbrey Park Elementary School (math 30% / reading 50%, grade F, #169 of 412 statewide, top 44%, 427 students, 64% FRL); Madison Middle School (math 32% / reading 42%, grade F, #50 of 128 statewide, top 41%, 415 students, 65% FRL); North Eugene High School (1,071 students, 63% FRL) — zoned schools average 64% FRL vs 37% district-wide (27 pts higher); higher-poverty schools than district average — tighter screening recommended.
- Market conditions: Rents rising (+3.4%/yr); 169 active listings in the ZIP; 27 comparable units currently listed for rent nearby; rentals at typical pace (median 21d on market — plan ~3-4 weeks tenant-placement turnaround); solid renter incomes; 1,808 units permitted in Lane County in 2024 (972 in 5+ unit buildings).
Forward outlook
- Local home prices are declining (-3.0%/yr); year-one equity from $138 of loan paydown is wiped out by about $600 of value loss. Plan a longer hold.
- Lane County population projected at +15% by 2050 — long-run rental-demand tailwind backs the buy-and-hold thesis.
- At projected returns (-3.0% appreciation + 3.4% rent growth), your $6k cash investment doubles in ~1 year — after that, you're playing with house money.
Negotiation context
- Only 3 days on market — expect competitive offers; lowballing is unlikely to land.
- 3 sale attempts since 11y ago with the ask held roughly flat each time — persistent listings suggest the price (not the market) is what's stuck; bring a comps-based counter.
- Current owner paid $11k; list at $20k implies a 82% gain — meaningful room to come down on a strong offer.
Risks & watch-outs
- Climate carrying-cost: moderate flood risk — expect insurance premiums to compound above CPI over the hold.
Questions for the listing agent
- Is there a deadline driving the sale (1031 exchange, divorce, estate, relocation)? That informs how much negotiation room exists.
- Schools are B-rated — typically a magnet for longer-tenancy family renters. What's the average tenant stay here, and is there a school-zone premium baked into asking?
- Crime grade is D in this area — have there been break-ins, vandalism, or insurance claims at this property in the last 3 years? What carrier currently insures it and at what premium?
- The area grade is low — what's the realistic commute time and amenity access for the typical tenant pool here? Any planned neighborhood developments (good or bad) we should know about?
- What's the average days-on-market for RENTAL listings here right now (not sales)? A rising rental-DOM trend means longer vacancies and softer asking-rent achievability than the comps imply.
- What's the recent tenant-quality profile in this submarket — average credit score on applications, eviction rate, late-payment / NSF rate, and stable-employment percentage? A property-management company in the area should have these aggregated.
- How much new for-sale + rental construction is in the pipeline within 1–3 miles? Heavy new supply typically softens prices + rents 12–24 months out; constrained supply supports both.
Investment metrics
- 1% rule
- 8.66% ✓
- Cap rate
- 80.12%
- Cash-on-cash
- 263.68%
- DSCR
- 12.73
- GRM
- 1.0
CMA / ARV
- ARV (on-the-fly)
- $40,320
- Comps found
- 6
Show comp detail 6 sales within ~0.75 mi
| Address | Dist | Beds/Ba | Sqft | Sold | Price | $/sf | Match |
|---|---|---|---|---|---|---|---|
| 501 Division Ave #15 | 0.00mi | 2/1.0 | 840 (0%) | 0mo | $19,999 | $24 | 100 |
| 501 Division Ave #20 | 0.00mi | 2/1.0 | 740 (-12%) | 2mo | $23,000 | $31 | 78 |
| 501 Division Ave #43 | 0.00mi | 2/1.0 | 768 (-9%) | 14mo | $32,000 | $42 | 74 |
| 501 Division Ave #38 | 0.00mi | 2/1.0 | 784 (-7%) | 18mo | $43,500 | $55 | 74 |
| 501 Division Ave #19 | 0.00mi | 2/1.0 | 720 (-14%) | 12mo | $34,500 | $48 | 66 |
| 501 Division Ave #69 | 0.00mi | 2/2.0 | 960 (+14%) | 13mo | $55,000 | $57 | 61 |
Match score weights: distance 35% · size 25% · config 20% · recency 20%. Top-matched comps best support the ARV.
Projected returns pro-forma
-3.0% appreciation · 3.43% rent growth · sell at horizon
- IRR
- —
- Equity multiple
- 14.56×
- Total profit
- $75,905
- Equity at exit
- $2,982
- IRR
- —
- Equity multiple
- 31.40×
- Total profit
- $170,228
- Equity at exit
- $1,729
Cash invested: $5,600 (down + closing). Projections, not guarantees.
Landlord ↔ Tenant lean methodology
- Overall (STATE)
- 28 Tenant-Leaning
- State Oregon
- 28 Tenant-Leaning · D+6
- County
- — inherits STATE
- City
- — inherits STATE
ZIP-level market 97404
- Rents YoY
- 3.4%
- Active inventory
- 169
- Price-to-rent
- 1.0×
Monthly cashflow live
- Estimated rent
- $1,732 high interval (Pro) →
- Mortgage (P&I)
- −$105
- Tax est. 1.5%
- −$25 /mo · $300/yr
- Insurance
- −$8
- HOA
- −$0
- Vacancy / Maint / Mgmt
- −$364
- Net cashflow
- $1,230
Break-even live
UW: 25.0% down · 7.5% · 30yr · 1.5% tax · 5.0% vac · 8.0% maint · 8.0% mgmt
Financing live
Cash to close
- Down payment
- $5,000
- Closing costs
- $600
- Reserves months
- —
- Total cash needed
- —
Loan-product check · same deal, 3 products live
Conventional
25% down · 7.5% · 30yr
- Down + closing
- —
- Monthly P&I
- —
- Monthly cashflow
- —
- DSCR
- —
- Eligible?
- —
Personal DTI + credit; lowest rate.
DSCR
20% down · 8.5% · 30yr
- Down + closing
- —
- Monthly P&I
- —
- Monthly cashflow
- —
- DSCR
- —
- Eligible?
- —
No personal income docs; deal must DSCR.
Hard money
10% down · 12.0% · 12mo
- Down + closing
- —
- Monthly P&I
- —
- Monthly cashflow
- —
- DSCR
- —
- Eligible?
- —
Short-term bridge; refi at stabilization.
Rent comps 27 comps
| Address | Beds | Baths | Sqft | Rent | $/sqft | DOM | Units | Dist |
|---|---|---|---|---|---|---|---|---|
| 130 River Ave Eugene, OR | 1.0–2.0 | 1.0–1.5 | 848 | $1,600 | $1.89 | 13d | 20 | 0.43mi |
| 55 Corliss Ln Unit 2468 Eugene, OR | 2.0 | 1.5 | 960 | $1,400 | $1.46 | 43d | 1 | 0.56mi |
| 123 Green Ln Unit 125 Eugene, OR | 3.0 | 1.5 | 1100 | $1,450 | $1.32 | 43d | 1 | 0.56mi |
| 26 Owosso Dr Eugene, OR | 2.0 | 1.5 | 830 | $1,495 | $1.80 | 43d | 2 | 0.66mi |
| 1711 River Rd Unit 1 Eugene, OR | 1.0 | 1.0 | 684 | $1,500 | $2.19 | 43d | 1 | 0.67mi |
| 3570 Goodpasture Loop Eugene, OR | 2.0 | 2.0 | 1000 | $1,999 | $2.00 | 43d | 1 | 0.67mi |
| 15 Kourt Dr Eugene, OR | 2.0 | 1.0 | 800 | $1,595 | $1.99 | 43d | 1 | 0.67mi |
| 1711 River Rd Eugene, OR | 1.0 | 1.0 | 684 | $1,500 | $2.19 | 21d | 1 | 0.68mi |
| 1711 River Rd Unit 04 Eugene, OR | 1.0 | 1.0 | 684 | $1,495 | $2.19 | 21d | 1 | 0.68mi |
| 60 Kourt Dr Unit 60 Eugene, OR | 2.0 | 1.0 | 900 | $1,395 | $1.55 | 21d | 1 | 0.71mi |
| 2558 River Rd #362 Eugene, OR | 2.0 | 1.5 | 950 | $1,495 | $1.57 | 43d | 1 | 0.73mi |
| 3610 Goodpasture Loop Eugene, OR | 1.0–2.0 | 1.0–2.0 | 802 | $2,299 | $2.87 | 13d | 15 | 0.78mi |
| 3950 Goodpasture Loop Eugene, OR | 1.0 | 1.0 | 634 | $1,564 | $2.46 | 13d | 5 | 0.86mi |
| 60 Hatton Ave Eugene, OR | 1.0–2.0 | 1.0–2.0 | 844 | $1,970 | $2.33 | 13d | 11 | 0.94mi |
| 394 Rosewood Ave Eugene, OR | 2.0 | 2.0 | 850 | $1,895 | $2.23 | 13d | 1 | 1.05mi |
| 330 Howard Ave Unit A Eugene, OR | 1.0 | 1.0 | 600 | $1,199 | $2.00 | 21d | 1 | 1.07mi |
| 355 Irving Rd Unit 353 Eugene, OR | 1.0 | 1.0 | 600 | $1,295 | $2.16 | 21d | 1 | 1.12mi |
| 1150 Darlene Ln Eugene, OR | 1.0–2.0 | 1.0–2.5 | 924 | $2,285 | $2.47 | 13d | 16 | 1.20mi |
| 1440 John Day Dr Eugene, OR | 1.0–3.0 | 1.0–2.5 | 1050 | $2,349 | $2.24 | 13d | 38 | 1.30mi |
| 1844 Happy Ln Eugene, OR | 1.0 | 1.0–2.0 | 1040 | $1,692 | $1.63 | 13d | 5 | 1.41mi |
| 470 Alexander Loop Eugene, OR | 2.0 | 1.0–2.0 | 708 | $1,774 | $2.51 | 13d | 15 | 1.42mi |
| 1367 Umpqua Ave Eugene, OR | 1.0–2.0 | 1.0–2.0 | 850 | $2,675 | $3.15 | 13d | 46 | 1.42mi |
| 519 Cinderella Loop Unit 525 Eugene, OR | 3.0 | 1.5 | 1050 | $1,995 | $1.90 | 43d | 1 | 1.46mi |
| 525 Cinderella Loop Unit 525 Eugene, OR | 3.0 | 1.5 | 1100 | $1,995 | $1.81 | 43d | 1 | 1.46mi |
| 568 Cinderella Loop Eugene, OR | 2.0 | 1.0 | 1074 | $1,750 | $1.63 | 13d | 1 | 1.47mi |
| 593 Cinderella Loop Eugene, OR | 2.0 | 1.5 | 880 | $1,650 | $1.88 | 13d | 1 | 1.49mi |
| 2300 Norkenzie Rd Eugene, OR | 2.0 | 1.5 | 980 | $1,445 | $1.47 | 43d | 1 | 1.49mi |
Listing history 5 events
-
2026-06-07statusdays on market $19,999 Pending 3 DOM
-
2026-06-05days on market $19,999 Active 2 DOM
-
2026-06-03remarks 456-char remark
-
2026-06-03remarks 443-char remark
-
2026-06-03$19,999 Active 1 DOM
ⓘ Source: listings_history table (triggers on properties + properties_extension) + one-shot
backfill from property_details.listing_events for pre-trigger history.
Climate risk First Street
- Flood 5/10 Major FEMA zone X (unshaded) · 24% chance over 30 yrs
- Wildfire 2/10 Low
- Heat 4/10 Moderate 7 d/yr ≥93°F today · 15 d/yr by 30 yrs out
- Wind 1/10 Low
- Air quality 10/10 Extreme 13 unhealthy d/yr today · 15 by 30 yrs out
Nearby sold comps map
Loading sold comps map…
Walkable amenities ~0.75 mi
Loading nearby amenities…
Taxation est. · year 1
- Rental income
- $20,789
- − Mortgage interest
- −$1,120
- − Property taxes
- −$300
- − Insurance
- −$100
- − Repairs & maintenance
- −$1,663
- − Management
- −$1,663
- − Depreciation
- −$582
- Taxable income
- $15,361
- Est. tax owed @ 24.0%
- −$3,687
- After-tax cash flow
- $11,078/yr
For passive investors: Depreciation is non-cash, so a rental often shows a tax loss while cash-flowing — sheltering income. Rental losses are passive: they offset passive income freely, and up to $25,000/yr can offset ordinary (W-2) income if you actively participate and your MAGI is under $100k (phasing out to $0 by $150k); unused losses carry forward. On sale, claimed depreciation is recaptured at up to 25%, and gains may owe capital-gains tax (a 1031 exchange can defer both). Figures are a year-1 estimate at your 24.0% rate — not tax advice; consult a CPA.
Schools (NCES district)
- District
- Eugene SD 4J
- NCES district ID
- 4104740
- Math proficiency
- 45% ▼ -2.00%
- Reading proficiency
- 55% ▼ -4.00%
- Median HH income
- $43,688
- Composite
- 42.15/100
- National rank
- #3302
- State rank
- #10 of 58 in OR
Livability — Eugene
- Score
- 81/100
- State rank
- #52
- US rank
- #1587
Category grades
Schools grade is shown separately in the Schools card above.
Census & demographics
- Census place
- Eugene, OR
- County
- Lane County · 310,476 people
- City population
- 215,212
- Metro
- Eugene-Springfield, OR
- Population (ZIP)
- 34,244
- Household income
- $86,776
- Rent vs Own
- Severe rent burden
- 1056.0
Population outlook (Lane County) Hauer SSP2
- Today (2025)
- 391,933 people
- By 2030
- 405,860 · +3.6%
- By 2040
- 429,386 · +9.6%
- By 2050
- 452,016 · +15.3%
- By 2075
- 508,825 · +29.8%
- By 2100
- 531,208 · +35.5%
Race, ethnicity, and origin ACS 2023
- Neighborhood character
- Predominantly White (80%)
- Race & ethnicity
- White 80% Hispanic / Latino 10% Two or more races 9% Asian 2% Black 1% Native American 1%
- Hispanic origin (detail)
- Mexican 7%
- Common ancestry
- Portuguese 4% Italian 4% Slovak 3%
- Foreign-born
- 5% · Canada
- Languages at home
- 92% English-only · Spanish 5% German/W. Germanic 1% Other Asian/Pacific 1%
Political lean MEDSL · Lane
- 2024 margin
- Strong D (+23.1) · D 60.0% · R 36.9% · Other 3.1%
- 2008→2024 swing
- -4.3pp toward R · 2008: 27.4pp · 2024: 23.1pp
- All cycles
- 2024: D+23.1 2020: D+24.3 2016: D+18.9 2012: D+23.4 2008: D+27.4
Not yet ingested
- Civics
- —
Market trends
- HPI YoY
- ▼ -523.41%
- Current HPI
- 294.7988
- Rent YoY
- ▲ 3.43%
- Metro
- Eugene-Springfield, OR
- State GDP YoY
- ▲ 2.05%
- F500 in state
- 2
Industry mix (Fortune 500 HQ in OR)
| Industry | F500 HQs | Revenue |
|---|---|---|
| Consumer Goods | 1 | $51B |
|
||
Price history
+55.0% since first listed8 events — show timeline
- 2026-06-01 Listed $19,999 RMLS
- 2017-01-06 Sold (MLS) $11,000 RMLS
- 2016-12-28 Pending — RMLS
- 2016-12-13 Listed $12,000 RMLS
- 2015-12-17 Sold (MLS) $10,500 RMLS
- 2015-12-09 Pending — RMLS
- 2015-11-23 Price Changed $11,500 RMLS
- 2015-11-19 Listed $12,900 RMLS
Property tax history
-39.7%/yrLatest (2015): $6 · +0.0% YoY. Source: county tax records.
Cash-flow waterfall
monthlySold comps — $/sqft
last 12 mo · ≤1 miLoading sold comps…