303 E Kansas St · Interlachen, FL
Flood risk 1/10 · Minimal
- FEMA flood zone
- X (unshaded)
- Chance of flooding over 30 yrs
- 0.0%
- Est. flood insurance / yr
- $507 – $1,088
Fire risk 8/10 · Major
- Est. fire insurance / yr
- $947 – $1,759
Heat risk 8/10 · Major
- Hot days now (above 109°F)
- 7 days/yr
- Hot days in 30 yrs
- 19 days/yr
Wind risk 9/10 · Severe
- Chance of severe wind over 30 yrs
- 99.0%
Air-quality risk 2/10 · Minimal
- Unhealthy air days now
- 2 days/yr
- Unhealthy air days in 30 yrs
- 2 days/yr
Risk factors via First Street. Map © Google.
Why this score? — see what drove the A- grade
The composite is a weighted blend of 9 inputs, each scored 0–100. Each bar is that input's sub-score; the figure is the points it added to the 100-point composite (weight × sub-score).
- Cash flow +30.0/30.0
- ARV discount +15.0/15.0
- DSCR +10.0/10.0
- 1% rule +9.3/10.0
- Appreciation +6.7/10.0
- Livability +3.4/5.0
- Schools +3.0/10.0
- Rent growth +2.5/5.0
- Condition / age +2.5/5.0
$65,000
🖨 Deal sheet 📄 Offer letter ✓ Due diligence
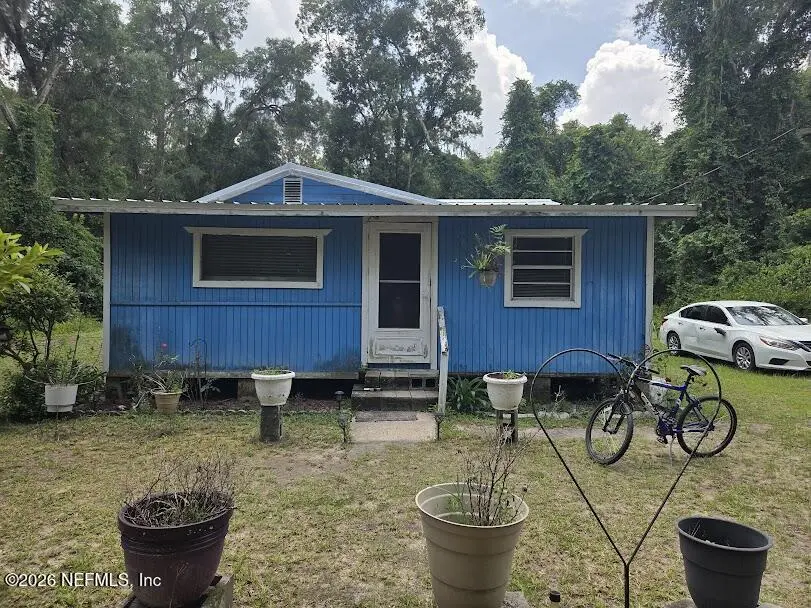
Listing remarks
Priced below market value, this 2-bedroom, 1-bath fixer-upper sits on a 0.32-acre lot in a quiet area off State Road 100. Featuring 832 square feet of living space and a newer metal roof, this property offers a great opportunity for investors, landlords, flippers, or buyers looking to build instant sweat equity. The home needs repairs and updating and is being sold As-Is. With a spacious lot and no HOA, there is plenty of room for storage, outdoor activities, or future improvements. Great rental potential or renovation project with upside for the right buyer. Seller is motivated and ready to review offers. Bring your vision and turn this property into a profitable investment or affordable h
Key facts
- Spacious lot
- Newer metal roof
- No hoa
Tags
Property features AI
Exterior
- Parking: Off-street parking
- Utilities: Cable available; Electricity connected; Sewer: unknown
- Home design: Single-family residence; One story
- Construction: Wood siding construction
- Exterior features: Other detached structure on the property; Lot of 0.32 acres
Interior
- Kitchen: Electric oven
- Bedrooms: 2 bedrooms
- Flooring: Carpet; Vinyl
- Bathrooms: 1 full bathroom
- Heating & cooling: Wall/window air conditioning units
- Interior features: Primary bathroom with shower (no tub)
Neighborhood map
What this means for you Summary
Snapshot
- This is a 2-bed/1.0-bath single-family listed at $65k.
Deal economics
- At list price, monthly cash flow is $268 ($3k/yr) — positive.
- The deal already cash-flows at list — no discount required.
- Meets the 1% rule at list price ($932 rent vs $65k).
- Cap rate 11.2% vs local median 5.6% in Interlachen — top-decile yield for the area; either an underpriced asset or a hidden risk that comps aren't pricing in. Stress-test before assuming the spread holds.
Location & tenants
- Location reads 67/100 on livability (#540 in FL) — a middle-class / working-renter tenant base. Strengths: crime A+, cost of living A+, housing A+; Watch: schools D-, amenities F, commute F.
- Putnam (town): math 34% / reading 39% proficiency, ranked #66 of 73 in FL (top 90%) — families likely to look elsewhere, expect single-tenant / working-renter base with shorter leases; 71% free/reduced lunch — lower-income household profile, screen leases tightly.
- Market conditions: 111 active listings in the ZIP; 113 units permitted in Putnam County in 2024 (0 in 5+ unit buildings).
Forward outlook
- In year one you build about $3k of equity ($449 loan paydown + $2k appreciation (3.4% local appreciation)).
- Putnam County population projected at -31% by 2050 — secular population decline; favor cash flow + early exit over multi-decade hold.
- At projected returns (3.4% appreciation + 3.0% rent growth), your $18k cash investment doubles in ~3 years — after that, you're playing with house money.
Negotiation context
- Only 1 days on market — expect competitive offers; lowballing is unlikely to land.
Risks & watch-outs
- Climate carrying-cost: severe wind risk, 99% chance of damaging wind over 30y; severe wildfire risk; extreme-heat days projected 7→19/yr by 2055 (HVAC capex compounding) — expect insurance premiums to compound above CPI over the hold.
Questions for the listing agent
- Built in 1960 — when were the roof, HVAC, electrical panel, plumbing, and water heater last replaced?
- Is there a deadline driving the sale (1031 exchange, divorce, estate, relocation)? That informs how much negotiation room exists.
- Schools are D-rated, which usually means shorter tenancies and higher turnover. Who's the typical renter profile here, and what's been the actual vacancy rate?
- What's the average days-on-market for RENTAL listings here right now (not sales)? A rising rental-DOM trend means longer vacancies and softer asking-rent achievability than the comps imply.
- What's the recent tenant-quality profile in this submarket — average credit score on applications, eviction rate, late-payment / NSF rate, and stable-employment percentage? A property-management company in the area should have these aggregated.
- How much new for-sale + rental construction is in the pipeline within 1–3 miles? Heavy new supply typically softens prices + rents 12–24 months out; constrained supply supports both.
Investment metrics
- 1% rule
- 1.43% ✓
- Cap rate
- 11.25%
- Cash-on-cash
- 17.69%
- DSCR
- 1.79
- GRM
- 5.8
CMA / ARV
- ARV (on-the-fly)
- $121,264
- Comps found
- 1
Show comp detail 1 sale within ~0.75 mi
| Address | Dist | Beds/Ba | Sqft | Sold | Price | $/sf | Match |
|---|---|---|---|---|---|---|---|
| 107 Coral Farms Rd | 0.38mi | 2/1.0 | 598 (+4%) | 14mo | $126,500 | $212 | 63 |
Match score weights: distance 35% · size 25% · config 20% · recency 20%. Top-matched comps best support the ARV.
Projected returns pro-forma
3.43% appreciation · 3.0% rent growth · sell at horizon
- IRR
- 25.0%
- Equity multiple
- 2.45×
- Total profit
- $26,437
- Equity at exit
- $30,812
- IRR
- 25.4%
- Equity multiple
- 4.76×
- Total profit
- $68,391
- Equity at exit
- $48,756
Cash invested: $18,200 (down + closing). Projections, not guarantees.
Landlord ↔ Tenant lean methodology
- Overall (STATE)
- 87 Strongly Landlord-Friendly
- State Florida
- 87 Strongly Landlord-Friendly · R+3
- County
- — inherits STATE
- City
- — inherits STATE
ZIP-level market 32140
- Home prices YoY
- 1.6%
- Active inventory
- 111
- Price-to-rent
- 5.8×
Monthly cashflow live
- Estimated rent
- $932 medium interval (Pro) →
- Mortgage (P&I)
- −$341
- Tax from tax record
- −$100 /mo · $1,197/yr
- Insurance
- −$27
- HOA
- −$0
- Vacancy / Maint / Mgmt
- −$196
- Net cashflow
- $268
Break-even live
UW: 25.0% down · 7.5% · 30yr · 1.5% tax · 5.0% vac · 8.0% maint · 8.0% mgmt
Financing live
Cash to close
- Down payment
- $16,250
- Closing costs
- $1,950
- Reserves months
- —
- Total cash needed
- —
Loan-product check · same deal, 3 products live
Conventional
25% down · 7.5% · 30yr
- Down + closing
- —
- Monthly P&I
- —
- Monthly cashflow
- —
- DSCR
- —
- Eligible?
- —
Personal DTI + credit; lowest rate.
DSCR
20% down · 8.5% · 30yr
- Down + closing
- —
- Monthly P&I
- —
- Monthly cashflow
- —
- DSCR
- —
- Eligible?
- —
No personal income docs; deal must DSCR.
Hard money
10% down · 12.0% · 12mo
- Down + closing
- —
- Monthly P&I
- —
- Monthly cashflow
- —
- DSCR
- —
- Eligible?
- —
Short-term bridge; refi at stabilization.
Listing history 2 events
-
2026-06-17remarks 699-char remark
-
2026-06-17$65,000 Active 1 DOM
ⓘ Source: listings_history table (triggers on properties + properties_extension) + one-shot
backfill from property_details.listing_events for pre-trigger history.
Tax reassessment forecast FL · Resets to sale price
- Current annual tax
- $1,197 · $100/mo
- Projected year-2 tax
- $1,197 · $100/mo
- Expected delta
- $0/yr ($0/mo · 0.0%)
ⓘ Screening estimate from a state-policy table — verify with the county assessor before closing.
Climate risk First Street
- Flood 1/10 Low FEMA zone X (unshaded) · 0% chance over 30 yrs
- Wildfire 8/10 Severe
- Heat 8/10 Severe 7 d/yr ≥109°F today · 19 d/yr by 30 yrs out
- Wind 9/10 Extreme 99% chance of damaging wind over 30 yrs
- Air quality 2/10 Low 2 unhealthy d/yr today · 2 by 30 yrs out
Nearby sold comps map
Loading sold comps map…
Walkable amenities ~0.75 mi
Loading nearby amenities…
Taxation est. · year 1
- Rental income
- $11,180
- − Mortgage interest
- −$3,641
- − Property taxes
- −$1,197
- − Insurance
- −$325
- − Repairs & maintenance
- −$894
- − Management
- −$894
- − Depreciation
- −$1,891
- Taxable income
- $2,338
- Est. tax owed @ 24.0%
- −$561
- After-tax cash flow
- $2,659/yr
For passive investors: Depreciation is non-cash, so a rental often shows a tax loss while cash-flowing — sheltering income. Rental losses are passive: they offset passive income freely, and up to $25,000/yr can offset ordinary (W-2) income if you actively participate and your MAGI is under $100k (phasing out to $0 by $150k); unused losses carry forward. On sale, claimed depreciation is recaptured at up to 25%, and gains may owe capital-gains tax (a 1031 exchange can defer both). Figures are a year-1 estimate at your 24.0% rate — not tax advice; consult a CPA.
Schools (NCES district)
- District
- Putnam
- NCES district ID
- 1201620
- Math proficiency
- 34% ▼ -10.00%
- Reading proficiency
- 39% ▼ -4.00%
- Median HH income
- $33,350
- Composite
- 29.99/100
- National rank
- #6361
- State rank
- #66 of 73 in FL
Livability — Interlachen
- Score
- 67/100
- State rank
- #540
- US rank
- #10162
Category grades
Schools grade is shown separately in the Schools card above.
Census & demographics
- City population
- 11,580
- Population (ZIP)
- 1,558
Population outlook (Putnam County) Hauer SSP2
- Today (2025)
- 65,299 people
- By 2030
- 61,255 · -6.2%
- By 2040
- 52,930 · -18.9%
- By 2050
- 45,051 · -31.0%
- By 2075
- 28,720 · -56.0%
- By 2100
- 15,852 · -75.7%
Race, ethnicity, and origin ACS 2023
- Neighborhood character
- Predominantly White (86%)
- Race & ethnicity
- White 86% Two or more races 7% Black 5% Hispanic / Latino 2%
- Common ancestry
- Lithuanian 3% Romanian 2% Italian 2%
- Languages at home
- 98% English-only · Spanish 2%
Political lean MEDSL · Putnam
- 2024 margin
- Solid R (+47.8) · D 25.8% · R 73.6%
- 2008→2024 swing
- -28.5pp toward R · 2008: -19.3pp · 2024: -47.8pp
- All cycles
- 2024: R+47.8 2020: R+41.2 2016: R+36.6 2012: R+24.5 2008: R+19.3
Not yet ingested
- Civics
- —
Market trends
- HPI YoY
- ▲ 3.43%
- Current HPI
- 214.5041
- Rent YoY
- —
- Metro
- —
- State GDP YoY
- ▲ 3.28%
- F500 in state
- 36
Industry mix (Fortune 500 HQ in FL)
| Industry | F500 HQs | Revenue |
|---|---|---|
| Industrial Technology | 2 | $29B |
|
||
| Insurance | 2 | $17B |
|
||
| Retail | 1 | $60B |
|
||
| Technology Distribution | 1 | $58B |
|
||
| Homebuilding | 1 | $35B |
|
||
| Technology Manufacturing | 1 | $35B |
|
||
Price history
1 event — show timeline
- 2026-06-17 Listed $65,000 realMLS
Property tax history
+3.6%/yrLatest (2025): $1,197 · +12.7% YoY. Source: county tax records.
Cash-flow waterfall
monthlySold comps — $/sqft
last 12 mo · ≤1 miLoading sold comps…