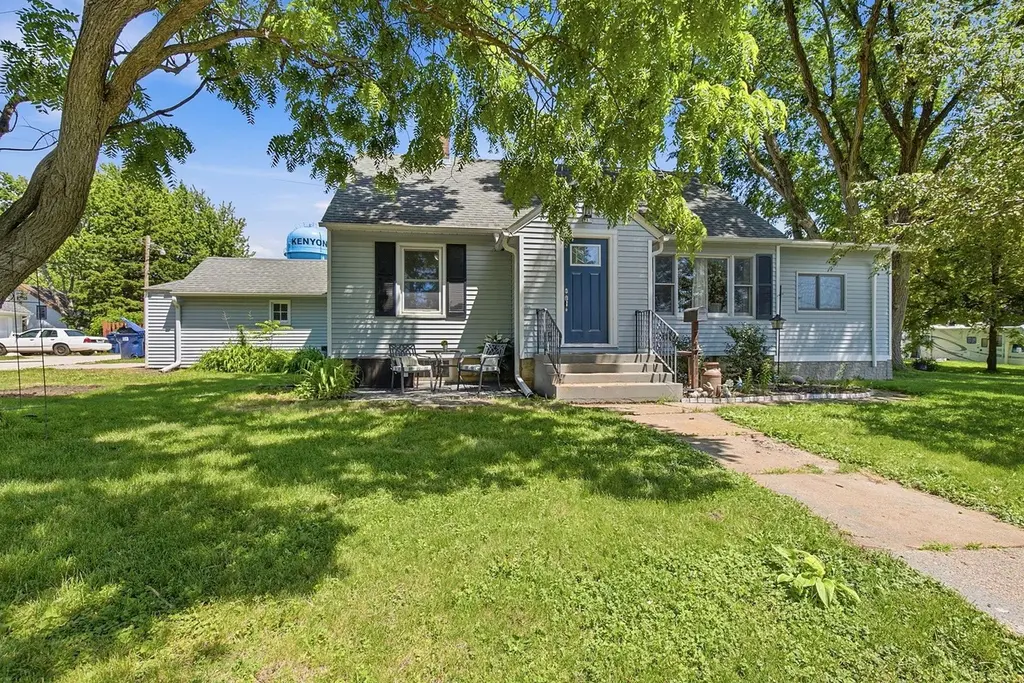
717 Forest St · Kenyon, MN
Flood risk 1/10 · Minimal
- FEMA flood zone
- X (unshaded)
- Chance of flooding over 30 yrs
- 0.0%
- Est. flood insurance / yr
- $473 – $860
Fire risk 1/10 · Minimal
- Est. fire insurance / yr
- $888 – $1,650
Heat risk 2/10 · Minimal
- Hot days now (above 100°F)
- 7 days/yr
- Hot days in 30 yrs
- 15 days/yr
Wind risk 2/10 · Minimal
- Chance of severe wind over 30 yrs
- —
Air-quality risk 2/10 · Minimal
- Unhealthy air days now
- 1 days/yr
- Unhealthy air days in 30 yrs
- 1 days/yr
Risk factors via First Street. Map © Google.
Why this score? — see what drove the D grade
The composite is a weighted blend of 9 inputs, each scored 0–100. Each bar is that input's sub-score; the figure is the points it added to the 100-point composite (weight × sub-score).
- Appreciation +10.0/10.0
- Cash flow +8.5/30.0
- ARV discount +7.5/15.0
- Livability +3.8/5.0
- Schools +3.3/10.0
- Rent growth +2.5/5.0
- Condition / age +2.5/5.0
- DSCR +2.3/10.0
- 1% rule +1.9/10.0
$259,900
🖨 Deal sheet 📄 Offer letter ✓ Due diligence
Listing remarks MLS
WELCOME HOME!!! You will absolutely fall in love with this cottage style bungalow! This 3 bed, 1 bath home has been beautifully updated with many chic details from top to bottom. Home features refinished hardwood floors, new carpet, fresh paint, updated light fixtures, and so much more! The brand new kitchen which will wow you with granite countertops, stainless steel appliances, white cabinets and bright, open space. The spacious living room overlooks the huge yard at the edge of town with views of fields. The master bedroom is large and cozy with extra space for a sitting area. The bonus room is perfect for a den, office or nursery. Home has a nice garage with extra storage space. The backyard features a new deck. Check this one out today before it's someone else's dream come true!
Key facts
- Farmhouse accents
- Large lot
- Updated kitchen
Tags
Property features AI
Exterior
- Parking: Attached garage with garage door opener (1 garage space; garage approx. 20x21)
- Utilities: City water connected; City sewer connected; Natural gas; 100 amp electric service with circuit breakers
- Home design: Residential property; One-and-one-half story; Main entry on main level
- Construction: Frame construction; Block foundation; Asphalt roof; Foundation area approx. 800
- Exterior features: Deck; Vinyl exterior; Vinyl fencing; Light tree coverage
Interior
- Kitchen: Range; Microwave; Refrigerator; Kitchen window
- Bedrooms: 3 bedrooms (one bedroom on the main floor)
- Flooring: Hardwood floors
- Bathrooms: 1 full bathroom (main floor)
- Heating & cooling: Forced air heating; Central air conditioning
- Interior features: Ceiling fans; Paneled doors; Main floor primary bedroom; Separate/formal dining room; Kitchen window
- Laundry & utility: Washer and dryer hookups; Electric dryer hookup; Washer hookup; Electric water heater
Neighborhood map
What this means for you Summary
Snapshot
- This is a 3-bed/2.0-bath single-family listed at $260k.
Deal economics
- At list price, monthly cash flow is $-230 ($-3k/yr) — negative.
- To cash-flow at today's rent, offer at most $219k (15.6% below list).
- To meet the 1% rule (rent ≥ 1% of price), the offer needs to be $180k (30.7% below list).
- Recommended offer: $180k (30.7% below list) — sets the bar for 1% rule.
Location & tenants
- Location reads 76/100 on livability (#172 in MN, #3,700 nationally) — a middle-class / working-renter tenant base. Strengths: crime A+, cost of living A+, housing A+; Watch: amenities F, commute F.
- Kenyon-Wanamingo School District (rural): math 34% / reading 41% proficiency, ranked #230 of 301 in MN (top 76%) — families likely to look elsewhere, expect single-tenant / working-renter base with shorter leases.
- Market conditions: 31 active listings in the ZIP; 1 comparable units currently listed for rent nearby; 86 units permitted in Goodhue County in 2024 (0 in 5+ unit buildings).
Forward outlook
- In year one you build about $28k of equity ($2k loan paydown + $26k appreciation (10.0% local appreciation)).
- Goodhue County population projected at -11% by 2050 — secular population decline; favor cash flow + early exit over multi-decade hold.
- By year 2, paydown + projected appreciation supports a ~$45k cash-out refi (75% LTV) — recoverable capital for the next deal without selling this one.
Negotiation context
- Only 9 days on market — expect competitive offers; lowballing is unlikely to land.
- 5 sale attempts since 13y ago with the ask held roughly flat each time — persistent listings suggest the price (not the market) is what's stuck; bring a comps-based counter.
- Current owner paid $195k; 33% above their basis — modest negotiation headroom, anchor on the comps not their cost.
Risks & watch-outs
- Watch-outs: built in 1940 — expect roof / HVAC / electrical / plumbing capex.
Questions for the listing agent
- What do current leases actually rent for vs. the listed asking? Can we see a recent rent roll and the last 12 months of T-12 income?
- Built in 1940 — when were the roof, HVAC, electrical panel, plumbing, and water heater last replaced?
- Is there a deadline driving the sale (1031 exchange, divorce, estate, relocation)? That informs how much negotiation room exists.
- The area grade is low — what's the realistic commute time and amenity access for the typical tenant pool here? Any planned neighborhood developments (good or bad) we should know about?
- What's the average days-on-market for RENTAL listings here right now (not sales)? A rising rental-DOM trend means longer vacancies and softer asking-rent achievability than the comps imply.
- What's the recent tenant-quality profile in this submarket — average credit score on applications, eviction rate, late-payment / NSF rate, and stable-employment percentage? A property-management company in the area should have these aggregated.
- How much new for-sale + rental construction is in the pipeline within 1–3 miles? Heavy new supply typically softens prices + rents 12–24 months out; constrained supply supports both.
Investment metrics
- 1% rule
- 0.69% ✗
- Cap rate
- 5.23%
- Cash-on-cash
- -3.80%
- DSCR
- 0.83
- GRM
- 12.0
CMA / ARV
No comps found within radius.
Projected returns pro-forma
10.0% appreciation · 3.0% rent growth · sell at horizon
- IRR
- 21.6%
- Equity multiple
- 2.74×
- Total profit
- $126,823
- Equity at exit
- $234,139
- IRR
- 19.5%
- Equity multiple
- 6.29×
- Total profit
- $384,884
- Equity at exit
- $504,929
Cash invested: $72,772 (down + closing). Projections, not guarantees.
Landlord ↔ Tenant lean methodology
- Overall (STATE)
- 46 Balanced
- State Minnesota
- 46 Balanced · D+2
- County
- — inherits STATE
- City
- — inherits STATE
ZIP-level market 55946
- Home prices YoY
- 11.0%
- Active inventory
- 31
- Price-to-rent
- 12.0×
Monthly cashflow live
- Estimated rent
- $1,800 medium interval (Pro) →
- Mortgage (P&I)
- −$1,363
- Tax from tax record
- −$181 /mo · $2,172/yr
- Insurance
- −$108
- HOA
- −$0
- Vacancy / Maint / Mgmt
- −$378
- Net cashflow
- $-230
Break-even live
UW: 25.0% down · 7.5% · 30yr · 1.5% tax · 5.0% vac · 8.0% maint · 8.0% mgmt
Financing live
Cash to close
- Down payment
- $64,975
- Closing costs
- $7,797
- Reserves months
- —
- Total cash needed
- —
Loan-product check · same deal, 3 products live
Conventional
25% down · 7.5% · 30yr
- Down + closing
- —
- Monthly P&I
- —
- Monthly cashflow
- —
- DSCR
- —
- Eligible?
- —
Personal DTI + credit; lowest rate.
DSCR
20% down · 8.5% · 30yr
- Down + closing
- —
- Monthly P&I
- —
- Monthly cashflow
- —
- DSCR
- —
- Eligible?
- —
No personal income docs; deal must DSCR.
Hard money
10% down · 12.0% · 12mo
- Down + closing
- —
- Monthly P&I
- —
- Monthly cashflow
- —
- DSCR
- —
- Eligible?
- —
Short-term bridge; refi at stabilization.
Rent comps 1 comps
| Address | Beds | Baths | Sqft | Rent | $/sqft | DOM | Units | Dist |
|---|---|---|---|---|---|---|---|---|
| 608 Red Wing Ave Kenyon, MN | 3.0 | 1.5 | 1456 | $1,800 | $1.24 | 43d | 1 | 0.13mi |
Listing history 8 events
-
2026-06-19days on market $259,900 Active 9 DOM
-
2026-06-18days on market $259,900 Active 8 DOM
-
2026-06-17days on market $259,900 Active 7 DOM
-
2026-06-16days on market $259,900 Active 6 DOM
-
2026-06-15days on market $259,900 Active 5 DOM
-
2026-06-14days on market $259,900 Active 3 DOM
-
2026-06-12remarks 693-char remark
-
2026-06-12$259,900 Active 2 DOM
ⓘ Source: listings_history table (triggers on properties + properties_extension) + one-shot
backfill from property_details.listing_events for pre-trigger history.
Tax reassessment forecast MN · Partial reset (capped growth)
- Current annual tax
- $2,172 · $181/mo
- Projected year-2 tax
- $2,541 · $212/mo
- Expected delta
- +$369/yr (+$31/mo · 17.0%)
ⓘ Screening estimate from a state-policy table — verify with the county assessor before closing.
Climate risk First Street
- Flood 1/10 Low FEMA zone X (unshaded) · 0% chance over 30 yrs
- Wildfire 1/10 Low
- Heat 2/10 Low 7 d/yr ≥100°F today · 15 d/yr by 30 yrs out
- Wind 2/10 Low
- Air quality 2/10 Low 1 unhealthy d/yr today · 1 by 30 yrs out
Nearby sold comps map
Loading sold comps map…
Walkable amenities ~0.75 mi
Loading nearby amenities…
Taxation est. · year 1
- Rental income
- $21,600
- − Mortgage interest
- −$14,558
- − Property taxes
- −$2,172
- − Insurance
- −$1,300
- − Repairs & maintenance
- −$1,728
- − Management
- −$1,728
- − Depreciation
- −$7,561
- Taxable loss
- −$7,447
- Est. tax savings @ 24.0%
- +$1,787
- After-tax cash flow
- $-976/yr
For passive investors: Depreciation is non-cash, so a rental often shows a tax loss while cash-flowing — sheltering income. Rental losses are passive: they offset passive income freely, and up to $25,000/yr can offset ordinary (W-2) income if you actively participate and your MAGI is under $100k (phasing out to $0 by $150k); unused losses carry forward. On sale, claimed depreciation is recaptured at up to 25%, and gains may owe capital-gains tax (a 1031 exchange can defer both). Figures are a year-1 estimate at your 24.0% rate — not tax advice; consult a CPA.
Schools (NCES district)
- District
- Kenyon-Wanamingo School District
- NCES district ID
- 2717100
- Math proficiency
- 34% ▼ -11.00%
- Reading proficiency
- 41% ▼ -13.00%
- Median HH income
- $58,681
- Composite
- 33.23/100
- National rank
- #5522
- State rank
- #230 of 301 in MN
Livability — Kenyon
- Score
- 76/100
- State rank
- #172
- US rank
- #3700
Category grades
Schools grade is shown separately in the Schools card above.
Census & demographics
- Census place
- Kenyon, MN
- Population (ZIP)
- 3,366
Population outlook (Goodhue County) Hauer SSP2
- Today (2025)
- 46,532 people
- By 2030
- 46,185 · -0.7%
- By 2040
- 44,531 · -4.3%
- By 2050
- 41,532 · -10.7%
- By 2075
- 33,745 · -27.5%
- By 2100
- 23,716 · -49.0%
Race, ethnicity, and origin ACS 2023
- Neighborhood character
- Predominantly White (91%)
- Race & ethnicity
- White 91% Hispanic / Latino 7% Two or more races 6%
- Hispanic origin (detail)
- Mexican 6%
- Common ancestry
- Portuguese 29% Lithuanian 3% Scottish 2%
- Foreign-born
- 1% · Canada
- Languages at home
- 95% English-only · Spanish 5%
Political lean MEDSL · Goodhue
- 2024 margin
- R (+16.4) · D 40.8% · R 57.3% · Other 1.9%
- 2008→2024 swing
- -15.1pp toward R · 2008: -1.4pp · 2024: -16.4pp
- All cycles
- 2024: R+16.4 2020: R+14.8 2016: R+18.0 2012: R+3.0 2008: R+1.4
Not yet ingested
- Civics
- —
Market trends
- HPI YoY
- ▲ 32.91%
- Current HPI
- 331.1421
- Rent YoY
- —
- Metro
- —
- State GDP YoY
- ▲ 2.41%
- F500 in state
- 34
Industry mix (Fortune 500 HQ in MN)
| Industry | F500 HQs | Revenue |
|---|---|---|
| Healthcare | 2 | $407B |
|
||
| Retail | 2 | $150B |
|
||
| Consumer Goods | 2 | $32B |
|
||
| Industrial Machinery | 2 | $6B |
|
||
| Agriculture | 1 | $40B |
|
||
| Healthcare / Medical Devices | 1 | $32B |
|
||
Price history
+225.3% since first listed18 events — show timeline
- 2026-06-11 Listed $259,900 NORTHSTARMLS as Distributed by MLS Grid
- 2026-06-09 Coming Soon $259,900 NORTHSTARMLS as Distributed by MLS Grid
- 2021-06-16 Sold (Public Records) $195,000 Public Records
- 2021-06-14 Sold (MLS) $195,000 NORTHSTARMLS as Distributed by MLS Grid
- 2021-04-13 Pending — NORTHSTARMLS as Distributed by MLS Grid
- 2021-04-10 Contingent — NORTHSTARMLS as Distributed by MLS Grid
- 2021-04-05 Listed $190,000 NORTHSTARMLS as Distributed by MLS Grid
- 2021-04-04 Coming Soon $190,000 NORTHSTARMLS as Distributed by MLS Grid
- 2020-03-26 Sold (Public Records) $174,000 Public Records
- 2020-03-23 Sold (MLS) $174,000 NORTHSTARMLS as Distributed by MLS Grid
- 2020-02-20 Pending — NORTHSTARMLS as Distributed by MLS Grid
- 2020-02-13 Listed $169,900 NORTHSTARMLS as Distributed by MLS Grid
- 2013-07-11 Listing Removed — NORTHSTARMLS as Distributed by MLS Grid
- 2013-07-10 Sold (MLS) $39,900 NORTHSTARMLS as Distributed by MLS Grid
- 2013-07-10 Sold (MLS) $39,900 NORTHSTARMLS as Distributed by MLS Grid
- 2013-01-31 Listed $39,900 NORTHSTARMLS as Distributed by MLS Grid
- 2013-01-31 Listed $39,900 NORTHSTARMLS as Distributed by MLS Grid
- 2002-02-20 Sold (Public Records) $79,900 Public Records
Property tax history
+5.1%/yrLatest (2025): $2,172 · +1.4% YoY. Source: county tax records.
Cash-flow waterfall
monthlySold comps — $/sqft
last 12 mo · ≤1 miLoading sold comps…