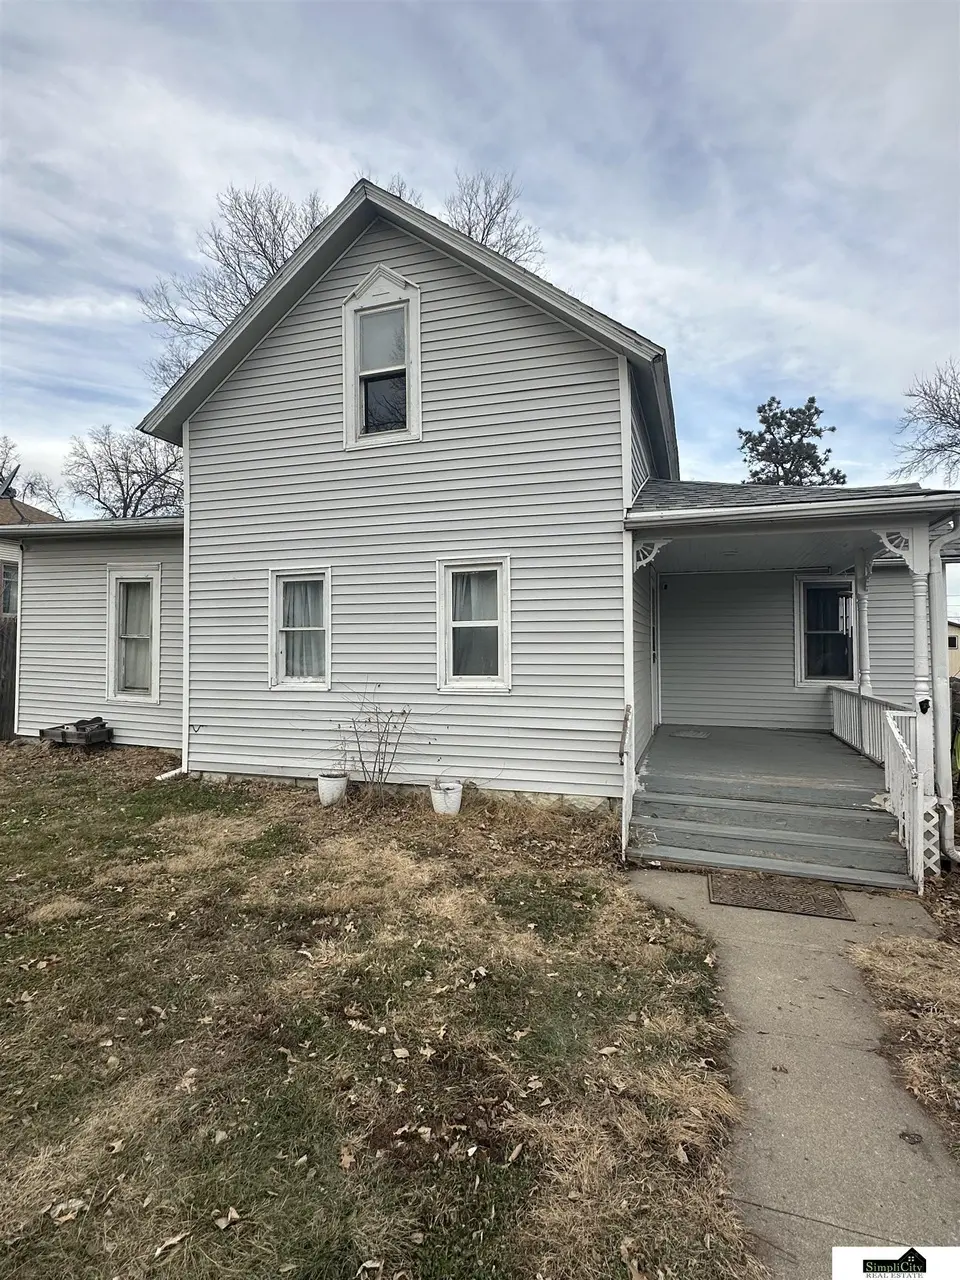
612 W Elm St · Wilber, NE
Flood risk 1/10 · Minimal
- FEMA flood zone
- X (unshaded)
- Chance of flooding over 30 yrs
- 0.0%
- Est. flood insurance / yr
- $507 – $1,088
Fire risk 1/10 · Minimal
- Est. fire insurance / yr
- $1,161 – $2,155
Heat risk 3/10 · Minor
- Hot days now (above 104°F)
- 7 days/yr
- Hot days in 30 yrs
- 16 days/yr
Wind risk 2/10 · Minimal
- Chance of severe wind over 30 yrs
- —
Air-quality risk 1/10 · Minimal
- Unhealthy air days now
- 0 days/yr
- Unhealthy air days in 30 yrs
- 0 days/yr
Risk factors via First Street. Map © Google.
Why this score? — see what drove the C grade
The composite is a weighted blend of 9 inputs, each scored 0–100. Each bar is that input's sub-score; the figure is the points it added to the 100-point composite (weight × sub-score).
- ARV discount +14.6/15.0
- Cash flow +13.7/30.0
- Appreciation +10.0/10.0
- DSCR +4.2/10.0
- Livability +3.9/5.0
- Schools +3.4/10.0
- 1% rule +2.7/10.0
- Rent growth +2.5/5.0
- Condition / age +2.5/5.0
$172,000
🖨 Deal sheet 📄 Offer letter ✓ Due diligence
Listing remarks MLS
Welcome to small-town charm in Wilber, Nebraska—proudly known as the home of Check Days! This traditional-style home offers timeless character paired with comfortable living in a peaceful, close-knit community. Featuring a classic layout, and a warm, inviting atmosphere, this property is perfect for those seeking a slower pace without sacrificing convenience. Enjoy quiet streets, friendly neighbors, and the unique cultural heritage that makes Wilber a hidden gem in southeast Nebraska. Whether you're looking to settle down or invest, this home captures the essence of traditional Midwestern living.
Key facts
- 8,316 sq ft lot
- Garage
- Built 1905
Neighborhood map
What this means for you Summary
Snapshot
- This is a 4-bed/1.0-bath single-family listed at $172k.
Deal economics
- At list price, monthly cash flow is $14 ($166/yr) — positive.
- The deal already cash-flows at list — no discount required.
- To meet the 1% rule (rent ≥ 1% of price), the offer needs to be $133k (22.8% below list).
- Recommended offer: $133k (22.8% below list) — sets the bar for 1% rule.
Location & tenants
- Location reads 78/100 on livability (#49 in NE, #2,481 nationally) — a middle-class / working-renter tenant base. Strengths: crime A+, cost of living A+, housing A+; Watch: schools D+, amenities F, commute F.
- Wilber-Clatonia Public Schools (rural): math 35% / reading 42% proficiency, ranked #98 of 111 in NE (top 88%) — families likely to look elsewhere, expect single-tenant / working-renter base with shorter leases.
- Market conditions: 13 active listings in the ZIP; 36 units permitted in Saline County in 2024 (0 in 5+ unit buildings).
Forward outlook
- In year one you build about $18k of equity ($1k loan paydown + $17k appreciation (10.0% local appreciation)).
- Saline County population projected at +18% by 2050 — long-run rental-demand tailwind backs the buy-and-hold thesis.
- At projected returns (10.0% appreciation + 3.0% rent growth), your $48k cash investment doubles in ~3 years — after that, you're playing with house money.
- By year 3, paydown + projected appreciation supports a ~$47k cash-out refi (75% LTV) — recoverable capital for the next deal without selling this one.
Negotiation context
- It's been on market 75 days — a 6% lower offer ($162k) is reasonable based on typical stale-listing flexibility.
- 5 sale attempts since 16y ago with the ask held roughly flat each time — persistent listings suggest the price (not the market) is what's stuck; bring a comps-based counter.
- Current owner paid $108k; list at $172k implies a 59% gain — meaningful room to come down on a strong offer.
Risks & watch-outs
- Watch-outs: built in 1905 — expect roof / HVAC / electrical / plumbing capex.
Questions for the listing agent
- It's been on market 75 days. Have you received any prior offers? Is the seller open to a 23% concession, seller financing, or rate buy-down credit?
- Built in 1905 — when were the roof, HVAC, electrical panel, plumbing, and water heater last replaced?
- Why hasn't it sold? Are there any deal-killer items the seller is aware of (foundation, flood, title, zoning, code violations)?
- Is there a deadline driving the sale (1031 exchange, divorce, estate, relocation)? That informs how much negotiation room exists.
- Schools are D-rated, which usually means shorter tenancies and higher turnover. Who's the typical renter profile here, and what's been the actual vacancy rate?
- What's the average days-on-market for RENTAL listings here right now (not sales)? A rising rental-DOM trend means longer vacancies and softer asking-rent achievability than the comps imply.
- What's the recent tenant-quality profile in this submarket — average credit score on applications, eviction rate, late-payment / NSF rate, and stable-employment percentage? A property-management company in the area should have these aggregated.
- How much new for-sale + rental construction is in the pipeline within 1–3 miles? Heavy new supply typically softens prices + rents 12–24 months out; constrained supply supports both.
Investment metrics
- 1% rule
- 0.77% ✗
- Cap rate
- 6.39%
- Cash-on-cash
- 0.35%
- DSCR
- 1.02
- GRM
- 10.8
CMA / ARV
- ARV (median comp)
- $204,139
- List price
- $172,000
- Delta
- -15.74%
- Verdict
- UNDERPRICED
- Comps
- 20 within 1.0 mi
Show comp detail 10 sales within ~0.75 mi
| Address | Dist | Beds/Ba | Sqft | Sold | Price | $/sf | Match |
|---|---|---|---|---|---|---|---|
| 520 W Hickory St | 0.14mi | 3/1.5 (-1) | 1,531 (+1%) | 5mo | $190,000 | $124 | 81 |
| 323 N Court St | 0.13mi | 3/2.0 (-1) | 1,552 (+2%) | 2mo | $146,000 | $94 | 80 |
| 123 N Court St | 0.09mi | 3/1.0 (-1) | 1,506 (-1%) | 12mo | $159,000 | $106 | 79 |
| 612 W 2nd St | 0.13mi | 3/2.0 (-1) | 1,370 (-10%) | 2mo | $260,000 | $190 | 67 |
| 224 S Court St | 0.22mi | 3/2.0 (-1) | 1,426 (-6%) | 16mo | $215,000 | $151 | 57 |
| 315 S School St | 0.29mi | 3/1.0 (-1) | 1,386 (-9%) | 20mo | $140,000 | $101 | 50 |
| 124 W 1st St | 0.32mi | 3/1.0 (-1) | 1,314 (-14%) | 22mo | $169,000 | $129 | 39 |
| 105 S OK St | 0.61mi | 3/2.0 (-1) | 1,726 (+14%) | 1mo | $242,000 | $140 | 39 |
| 615 N Shimerda St | 0.44mi | 3/2.0 (-1) | 1,694 (+11%) | 21mo | $240,000 | $142 | 34 |
| 809 S Shimerda St | 0.66mi | 5/3.0 (+1) | 1,729 (+14%) | 3mo | $310,000 | $179 | 31 |
Match score weights: distance 35% · size 25% · config 20% · recency 20%. Top-matched comps best support the ARV.
Projected returns pro-forma
10.0% appreciation · 3.0% rent growth · sell at horizon
- IRR
- 24.5%
- Equity multiple
- 2.96×
- Total profit
- $94,484
- Equity at exit
- $154,951
- IRR
- 21.7%
- Equity multiple
- 6.76×
- Total profit
- $277,399
- Equity at exit
- $334,158
Cash invested: $48,160 (down + closing). Projections, not guarantees.
Landlord ↔ Tenant lean methodology
- Overall (STATE)
- 83 Strongly Landlord-Friendly
- State Nebraska
- 83 Strongly Landlord-Friendly · R+13
- County
- — inherits STATE
- City
- — inherits STATE
ZIP-level market 68465
- Home prices YoY
- 6.2%
- Active inventory
- 13
- Price-to-rent
- 10.8×
Monthly cashflow live
- Estimated rent
- $1,329 medium interval (Pro) →
- Mortgage (P&I)
- −$902
- Tax from tax record
- −$62 /mo · $745/yr
- Insurance
- −$72
- HOA
- −$0
- Vacancy / Maint / Mgmt
- −$279
- Net cashflow
- $14
Break-even live
UW: 25.0% down · 7.5% · 30yr · 1.5% tax · 5.0% vac · 8.0% maint · 8.0% mgmt
Financing live
Cash to close
- Down payment
- $43,000
- Closing costs
- $5,160
- Reserves months
- —
- Total cash needed
- —
Loan-product check · same deal, 3 products live
Conventional
25% down · 7.5% · 30yr
- Down + closing
- —
- Monthly P&I
- —
- Monthly cashflow
- —
- DSCR
- —
- Eligible?
- —
Personal DTI + credit; lowest rate.
DSCR
20% down · 8.5% · 30yr
- Down + closing
- —
- Monthly P&I
- —
- Monthly cashflow
- —
- DSCR
- —
- Eligible?
- —
No personal income docs; deal must DSCR.
Hard money
10% down · 12.0% · 12mo
- Down + closing
- —
- Monthly P&I
- —
- Monthly cashflow
- —
- DSCR
- —
- Eligible?
- —
Short-term bridge; refi at stabilization.
Listing history 26 events
-
2026-06-18days on market $172,000 Active 75 DOM
-
2026-06-17days on market $172,000 Active 74 DOM
-
2026-06-16days on market $172,000 Active 73 DOM
-
2026-06-15days on market $172,000 Active 72 DOM
-
2026-06-13days on market $172,000 Active 70 DOM
-
2026-06-12days on market $172,000 Active 69 DOM
-
2026-06-09days on market $172,000 Active 66 DOM
-
2026-06-08days on market $172,000 Active 65 DOM
-
2026-06-07days on market $172,000 Active 64 DOM
-
2026-06-07days on market $172,000 Active 63 DOM
-
2026-06-04days on market $172,000 Active 60 DOM
-
2026-06-02days on market $172,000 Active 59 DOM
-
2026-06-01days on market $172,000 Active 58 DOM
-
2026-05-31days on market $172,000 Active 57 DOM
-
2026-04-04$172,000 New 609-char remark
Show marketing remark (609 chars)
Welcome to small-town charm in Wilber, Nebraska—proudly known as the home of Check Days! This traditional-style home offers timeless character paired with comfortable living in a peaceful, close-knit community. Featuring a classic layout, and a warm, inviting atmosphere, this property is perfect for those seeking a slower pace without sacrificing convenience. Enjoy quiet streets, friendly neighbors, and the unique cultural heritage that makes Wilber a hidden gem in southeast Nebraska. Whether you're looking to settle down or invest, this home captures the essence of traditional Midwestern living.
-
2026-04-04historical
Show marketing remark (609 chars)
Welcome to small-town charm in Wilber, Nebraska—proudly known as the home of Check Days! This traditional-style home offers timeless character paired with comfortable living in a peaceful, close-knit community. Featuring a classic layout, and a warm, inviting atmosphere, this property is perfect for those seeking a slower pace without sacrificing convenience. Enjoy quiet streets, friendly neighbors, and the unique cultural heritage that makes Wilber a hidden gem in southeast Nebraska. Whether you're looking to settle down or invest, this home captures the essence of traditional Midwestern living.
-
2026-01-15price $184,999
-
2025-12-22$189,999 New
-
2022-03-08soldstatus $108,000
-
2022-03-07soldstatus $108,000 Sold
-
2022-01-22status Pending
-
2021-11-19$109,000 Active - New
-
2011-01-11soldstatus $23,500
-
2011-01-11soldstatus $21,500
-
2010-12-19$27,000
-
2010-12-19$27,000
ⓘ Source: listings_history table (triggers on properties + properties_extension) + one-shot
backfill from property_details.listing_events for pre-trigger history.
Tax reassessment forecast NE · Resets to sale price
- Current annual tax
- $745 · $62/mo
- Projected year-2 tax
- $2,976 · $248/mo
- Expected delta
- +$2,230/yr (+$186/mo · 299.3%)
ⓘ Screening estimate from a state-policy table — verify with the county assessor before closing.
Climate risk First Street
- Flood 1/10 Low FEMA zone X (unshaded) · 0% chance over 30 yrs
- Wildfire 1/10 Low
- Heat 3/10 Moderate 7 d/yr ≥104°F today · 16 d/yr by 30 yrs out
- Wind 2/10 Low
- Air quality 1/10 Low 0 unhealthy d/yr today · 0 by 30 yrs out
Nearby sold comps map
Loading sold comps map…
Walkable amenities ~0.75 mi
Loading nearby amenities…
Taxation est. · year 1
- Rental income
- $15,943
- − Mortgage interest
- −$9,635
- − Property taxes
- −$745
- − Insurance
- −$860
- − Repairs & maintenance
- −$1,275
- − Management
- −$1,275
- − Depreciation
- −$5,004
- Taxable loss
- −$2,851
- Est. tax savings @ 24.0%
- +$684
- After-tax cash flow
- $850/yr
For passive investors: Depreciation is non-cash, so a rental often shows a tax loss while cash-flowing — sheltering income. Rental losses are passive: they offset passive income freely, and up to $25,000/yr can offset ordinary (W-2) income if you actively participate and your MAGI is under $100k (phasing out to $0 by $150k); unused losses carry forward. On sale, claimed depreciation is recaptured at up to 25%, and gains may owe capital-gains tax (a 1031 exchange can defer both). Figures are a year-1 estimate at your 24.0% rate — not tax advice; consult a CPA.
Schools (NCES district)
- District
- Wilber-Clatonia Public Schools
- NCES district ID
- 3178720
- Math proficiency
- 35% ▼ -8.00%
- Reading proficiency
- 42% ▼ -4.00%
- Median HH income
- $54,058
- Composite
- 33.62/100
- National rank
- #5404
- State rank
- #98 of 111 in NE
Livability — Wilber
- Score
- 78/100
- State rank
- #49
- US rank
- #2481
Category grades
Schools grade is shown separately in the Schools card above.
Census & demographics
- Census place
- Wilber, NE
- Population (ZIP)
- 2,682
Population outlook (Saline County) Hauer SSP2
- Today (2025)
- 15,242 people
- By 2030
- 15,610 · +2.4%
- By 2040
- 16,553 · +8.6%
- By 2050
- 17,915 · +17.5%
- By 2075
- 22,924 · +50.4%
- By 2100
- 28,426 · +86.5%
Race, ethnicity, and origin ACS 2023
- Neighborhood character
- Predominantly White (72%)
- Race & ethnicity
- White 72% Hispanic / Latino 21% Two or more races 11% Asian 3%
- Hispanic origin (detail)
- Mexican 5% Cuban 3%
- Common ancestry
- Scotch-Irish 2% Portuguese 1% Italian 1%
- Foreign-born
- 14% · Canada, Vietnam, Philippines
- Languages at home
- 80% English-only · Spanish 16% Other Asian/Pacific 2% German/W. Germanic 1%
Political lean MEDSL · Saline
- 2024 margin
- Solid R (+33.2) · D 32.8% · R 66.0% · Other 1.2%
- 2008→2024 swing
- -37.8pp toward R · 2008: 4.6pp · 2024: -33.2pp
- All cycles
- 2024: R+33.2 2020: R+28.5 2016: R+25.4 2012: R+5.9 2008: D+4.6
Not yet ingested
- Civics
- —
Market trends
- HPI YoY
- ▲ 13.86%
- Current HPI
- 238.0839
- Rent YoY
- —
- Metro
- —
- State GDP YoY
- ▲ 0.68%
- F500 in state
- 2
Industry mix (Fortune 500 HQ in NE)
| Industry | F500 HQs | Revenue |
|---|---|---|
| Conglomerate | 1 | $371B |
|
||
Price history
+537.0% since first listed12 events — show timeline
- 2026-04-04 Listing Removed — GPRMLS
- 2026-04-04 Listed $172,000 GPRMLS
- 2026-01-15 Price Changed $184,999 GPRMLS
- 2025-12-22 Listed $189,999 GPRMLS
- 2022-03-08 Sold (Public Records) $108,000 Public Records
- 2022-03-07 Sold (MLS) $108,000 GPRMLS
- 2022-01-22 Pending — GPRMLS
- 2021-11-19 Listed $109,000 GPRMLS
- 2011-01-11 Sold (MLS) $21,500 GPRMLS
- 2011-01-11 Sold (MLS) $23,500 GPRMLS
- 2010-12-19 Listed $27,000 GPRMLS
- 2010-12-19 Listed $27,000 GPRMLS
Property tax history
-1.2%/yrLatest (2025): $745 · -4.7% YoY. Source: county tax records.
Cash-flow waterfall
monthlySold comps — $/sqft
last 12 mo · ≤1 miLoading sold comps…