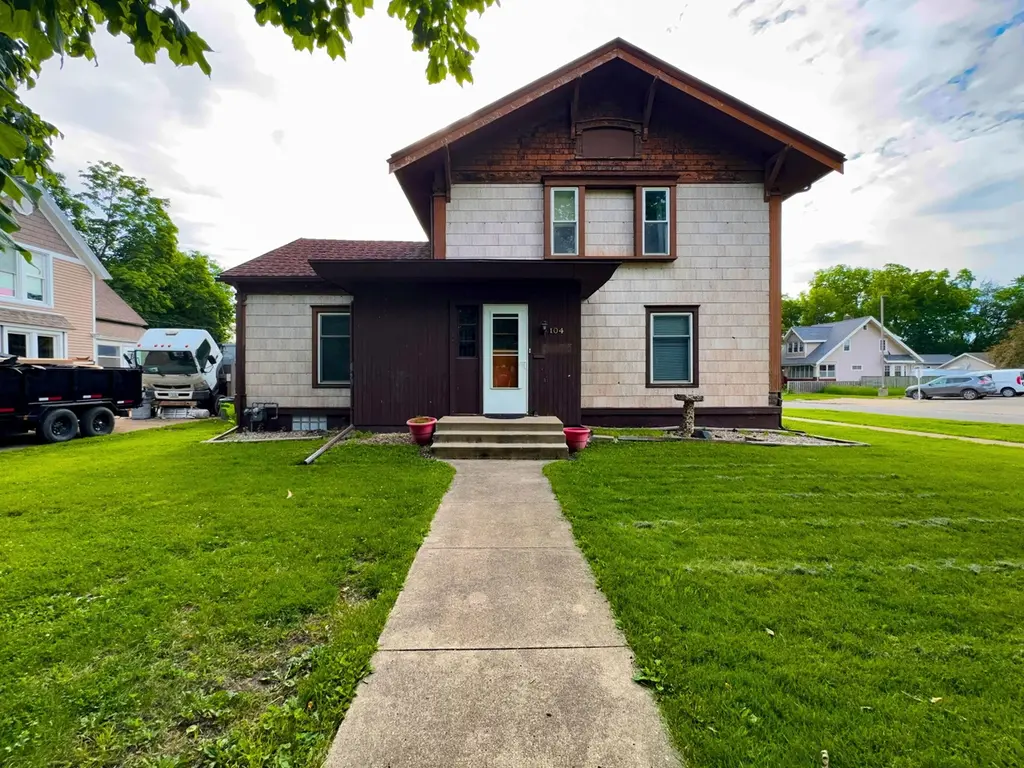
104 Tama St · Boone, IA
Flood risk 1/10 · Minimal
- FEMA flood zone
- X (unshaded)
- Chance of flooding over 30 yrs
- 0.0%
- Est. flood insurance / yr
- $473 – $860
Fire risk 1/10 · Minimal
- Est. fire insurance / yr
- $902 – $1,676
Heat risk 3/10 · Minor
- Hot days now (above 103°F)
- 7 days/yr
- Hot days in 30 yrs
- 15 days/yr
Wind risk 2/10 · Minimal
- Chance of severe wind over 30 yrs
- —
Air-quality risk 1/10 · Minimal
- Unhealthy air days now
- 0 days/yr
- Unhealthy air days in 30 yrs
- 0 days/yr
Risk factors via First Street. Map © Google.
Why this score? — see what drove the B- grade
The composite is a weighted blend of 9 inputs, each scored 0–100. Each bar is that input's sub-score; the figure is the points it added to the 100-point composite (weight × sub-score).
- Cash flow +22.7/30.0
- ARV discount +15.0/15.0
- DSCR +7.3/10.0
- 1% rule +6.0/10.0
- Schools +5.2/10.0
- Livability +4.0/5.0
- Rent growth +2.5/5.0
- Condition / age +2.5/5.0
- Appreciation +0.0/10.0
$149,999
🖨 Deal sheet 📄 Offer letter ✓ Due diligence
Listing remarks
Situated on a corner lot with numerous updates already completed and the potential to make it your own. This home features a metal roof installed in 2018 with a 50-year guarantee. The garage roof was also updated in 2018 with new shingles for added peace of mind. Major mechanical updates, such as a new furnace and central A/C unit, were installed in 2016. The attic has also been insulated to help improve energy efficiency and comfort year-round. Inside, the kitchen renovation is already underway. Some newer cabinets have already been installed, giving buyers a great head start on creating their dream kitchen. All appliances are included with the sale, including the refrigerator, dishwasher,
Key facts
- Additional carport
- Kitchen renovation
- Wooden deck
Tags
Property features AI
Exterior
- Parking: 1-car garage
- Utilities: Public water; Public sewer
- Home design: Single family residence; Residential property
- Construction: Built with other construction materials; Brick/mortar foundation
- Exterior features: Deck; Spa/Hot tub
Interior
- Kitchen: Dishwasher; Disposal; Microwave; Range; Refrigerator; Freezer
- Bedrooms: Master located downstairs
- Bathrooms: 1 full bathroom; 1 half bathroom
- Heating & cooling: Forced air heating; Central air conditioning
- Interior features: Master bedroom on the main level; Full unfinished basement
- Laundry & utility: Washer; Dryer
Neighborhood map
What this means for you Summary
Snapshot
- This is a 3-bed/1.5-bath single-family listed at $150k.
Deal economics
- At list price, monthly cash flow is $259 ($3k/yr) — positive.
- The deal already cash-flows at list — no discount required.
- Meets the 1% rule at list price ($2k rent vs $150k).
- Recommended offer: $148k (1.5% below list) — sets the bar for market timing.
- Cap rate 8.4% vs local median 3.6% in Boone — top-decile yield for the area; either an underpriced asset or a hidden risk that comps aren't pricing in. Stress-test before assuming the spread holds.
Location & tenants
- Location reads 79/100 on livability (#112 in IA, #2,144 nationally) — a middle-class / working-renter tenant base. Strengths: cost of living A+, housing A+, health & safety A+; Watch: amenities F, commute F.
- Boone Community School District (town): math 57% / reading 66% proficiency, ranked #232 of 289 in IA (top 80%) — acceptable for families but not a draw, mixed tenant base, ~2y average lease.
- Market conditions: 215 active listings in the ZIP; 7 comparable units currently listed for rent nearby; rentals lingering (median 44d on market — plan ~5-8 weeks vacancy on turnover, expect pricing pressure); 71% of comp listings sitting > 30 days — soft ceiling on asking rent; 80 units permitted in Boone County in 2024 (16 in 5+ unit buildings).
Forward outlook
- Local home prices are declining (-3.0%/yr); year-one equity from $1k of loan paydown is wiped out by about $4k of value loss. Plan a longer hold.
Negotiation context
- It's been on market 20 days — a 2% lower offer ($148k) is reasonable based on typical stale-listing flexibility.
- 2 sale attempts with the ask held roughly flat each time — persistent listings suggest the price (not the market) is what's stuck; bring a comps-based counter.
Risks & watch-outs
- Watch-outs: built in 1900 — expect roof / HVAC / electrical / plumbing capex.
Questions for the listing agent
- Built in 1900 — when were the roof, HVAC, electrical panel, plumbing, and water heater last replaced?
- Is there a deadline driving the sale (1031 exchange, divorce, estate, relocation)? That informs how much negotiation room exists.
- Schools are B-rated — typically a magnet for longer-tenancy family renters. What's the average tenant stay here, and is there a school-zone premium baked into asking?
- What's the average days-on-market for RENTAL listings here right now (not sales)? A rising rental-DOM trend means longer vacancies and softer asking-rent achievability than the comps imply.
- What's the recent tenant-quality profile in this submarket — average credit score on applications, eviction rate, late-payment / NSF rate, and stable-employment percentage? A property-management company in the area should have these aggregated.
- How much new for-sale + rental construction is in the pipeline within 1–3 miles? Heavy new supply typically softens prices + rents 12–24 months out; constrained supply supports both.
Investment metrics
- 1% rule
- 1.10% ✓
- Cap rate
- 8.36%
- Cash-on-cash
- 7.40%
- DSCR
- 1.33
- GRM
- 7.6
CMA / ARV
- ARV (on-the-fly)
- $221,364
- Comps found
- 12
Show comp detail 12 sales within ~0.75 mi
| Address | Dist | Beds/Ba | Sqft | Sold | Price | $/sf | Match |
|---|---|---|---|---|---|---|---|
| 113 Marshall St | 0.12mi | 4/2.0 (+1) | 1,789 (+4%) | 1mo | $246,000 | $138 | 80 |
| 1115 Garst Ave | 0.13mi | 3/2.0 | 1,600 (-7%) | 3mo | $230,000 | $144 | 78 |
| 309 S Boone St | 0.36mi | 4/1.5 (+1) | 1,710 (-0%) | 1mo | $207,000 | $121 | 77 |
| 127 Tama St | 0.06mi | 3/1.5 | 1,512 (-12%) | 2mo | $240,000 | $159 | 76 |
| 244 S Boone St | 0.31mi | 3/2.0 | 1,668 (-3%) | 3mo | $215,000 | $129 | 76 |
| 815 3rd St | 0.28mi | 2/1.0 (-1) | 1,675 (-2%) | 1mo | $150,000 | $90 | 75 |
| 722 Mamie Eisenhower Ave | 0.36mi | 4/2.5 (+1) | 1,697 (-1%) | 1mo | $202,000 | $119 | 71 |
| 816 Carroll St | 0.68mi | 3/1.5 | 1,732 (+1%) | 2mo | $192,000 | $111 | 65 |
| 1122 Country Club Dr | 0.56mi | 3/2.5 | 1,619 (-6%) | 1mo | $350,000 | $216 | 59 |
| 1632 Mamie Eisenhower Ave | 0.56mi | 4/2.0 (+1) | 1,647 (-4%) | 2mo | $169,000 | $103 | 58 |
| 514 S Jackson St | 0.62mi | 3/3.0 | 1,559 (-9%) | 1mo | $280,000 | $180 | 49 |
| 515 8th St | 0.71mi | 3/1.0 | 1,464 (-15%) | 2mo | $152,000 | $104 | 39 |
Match score weights: distance 35% · size 25% · config 20% · recency 20%. Top-matched comps best support the ARV.
Projected returns pro-forma
-3.0% appreciation · 3.0% rent growth · sell at horizon
- IRR
- -5.0%
- Equity multiple
- 0.81×
- Total profit
- $-7,789
- Equity at exit
- $22,365
- IRR
- 4.7%
- Equity multiple
- 1.35×
- Total profit
- $14,573
- Equity at exit
- $12,969
Cash invested: $42,000 (down + closing). Projections, not guarantees.
Landlord ↔ Tenant lean methodology
- Overall (STATE)
- 83 Strongly Landlord-Friendly
- State Iowa
- 83 Strongly Landlord-Friendly · R+6
- County
- — inherits STATE
- City
- — inherits STATE
ZIP-level market 50036
- Home prices YoY
- -27.1%
- Active inventory
- 215
- Price-to-rent
- 7.6×
Monthly cashflow live
- Estimated rent
- $1,654 high interval (Pro) →
- Mortgage (P&I)
- −$787
- Tax from tax record
- −$198 /mo · $2,380/yr
- Insurance
- −$62
- HOA
- −$0
- Vacancy / Maint / Mgmt
- −$347
- Net cashflow
- $259
Break-even live
UW: 25.0% down · 7.5% · 30yr · 1.5% tax · 5.0% vac · 8.0% maint · 8.0% mgmt
Financing live
Cash to close
- Down payment
- $37,500
- Closing costs
- $4,500
- Reserves months
- —
- Total cash needed
- —
Loan-product check · same deal, 3 products live
Conventional
25% down · 7.5% · 30yr
- Down + closing
- —
- Monthly P&I
- —
- Monthly cashflow
- —
- DSCR
- —
- Eligible?
- —
Personal DTI + credit; lowest rate.
DSCR
20% down · 8.5% · 30yr
- Down + closing
- —
- Monthly P&I
- —
- Monthly cashflow
- —
- DSCR
- —
- Eligible?
- —
No personal income docs; deal must DSCR.
Hard money
10% down · 12.0% · 12mo
- Down + closing
- —
- Monthly P&I
- —
- Monthly cashflow
- —
- DSCR
- —
- Eligible?
- —
Short-term bridge; refi at stabilization.
Rent comps 7 comps
| Address | Beds | Baths | Sqft | Rent | $/sqft | DOM | Units | Dist |
|---|---|---|---|---|---|---|---|---|
| 1318 SE Linn St Boone, IA | 3.0 | 2.0 | 1896 | $1,695 | $0.89 | 43d | 1 | 0.40mi |
| 1109 Ida Pl Boone, IA | 3.0 | 2.5 | 1715 | $1,950 | $1.14 | 43d | 1 | 0.94mi |
| 1208 S Linn St Boone, IA | 3.0 | 2.5 | 1449 | $1,800 | $1.24 | 43d | 1 | 0.97mi |
| 1428 Story St Boone, IA | 4.0 | 3.0 | 1900 | $2,000 | $1.05 | 43d | 1 | 0.98mi |
| 1221 S Linn St Boone, IA | 2.0–3.0 | 1.0 | 1025 | $1,025 | $1.00 | 13d | 2 | 0.98mi |
| 411 W 9th St Boone, IA | 3.0 | 2.0 | 1275 | $1,100 | $0.86 | 43d | 1 | 1.28mi |
| 680 S Marion St Boone, IA | 2.0–3.0 | 1.0–2.0 | 1042 | $1,295 | $1.24 | 13d | 37 | 1.42mi |
Listing history 19 events
-
2026-06-18days on market $149,999 Active 20 DOM
-
2026-06-17days on market $149,999 Active 19 DOM
-
2026-06-16days on market $149,999 Active 18 DOM
-
2026-06-15days on market $149,999 Active 17 DOM
-
2026-06-13days on market $149,999 Active 15 DOM
-
2026-06-12days on market $149,999 Active 14 DOM
-
2026-06-09days on market $149,999 Active 11 DOM
-
2026-06-08days on market $149,999 Active 10 DOM
-
2026-06-07days on market $149,999 Active 9 DOM
-
2026-06-05days on market $149,999 Active 7 DOM
-
2026-06-04days on market $149,999 Active 5 DOM
-
2026-06-02days on market $149,999 Active 4 DOM
-
2026-06-01days on market $149,999 Active 3 DOM
-
2026-05-31days on market $149,999 Active 2 DOM
-
2026-05-29$149,999 Active
-
2026-04-22historical
-
2026-03-20price $199,000
-
2026-03-20price $199,000
-
2025-10-22$220,000 Active
ⓘ Source: listings_history table (triggers on properties + properties_extension) + one-shot
backfill from property_details.listing_events for pre-trigger history.
Tax reassessment forecast IA · Partial reset (capped growth)
- Current annual tax
- $2,380 · $198/mo
- Projected year-2 tax
- $2,380 · $198/mo
- Expected delta
- $0/yr ($0/mo · 0.0%)
ⓘ Screening estimate from a state-policy table — verify with the county assessor before closing.
Climate risk First Street
- Flood 1/10 Low FEMA zone X (unshaded) · 0% chance over 30 yrs
- Wildfire 1/10 Low
- Heat 3/10 Moderate 7 d/yr ≥103°F today · 15 d/yr by 30 yrs out
- Wind 2/10 Low
- Air quality 1/10 Low 0 unhealthy d/yr today · 0 by 30 yrs out
Nearby sold comps map
Loading sold comps map…
Walkable amenities ~0.75 mi
Loading nearby amenities…
Taxation est. · year 1
- Rental income
- $19,842
- − Mortgage interest
- −$8,402
- − Property taxes
- −$2,380
- − Insurance
- −$750
- − Repairs & maintenance
- −$1,587
- − Management
- −$1,587
- − Depreciation
- −$4,364
- Taxable income
- $772
- Est. tax owed @ 24.0%
- −$185
- After-tax cash flow
- $2,921/yr
For passive investors: Depreciation is non-cash, so a rental often shows a tax loss while cash-flowing — sheltering income. Rental losses are passive: they offset passive income freely, and up to $25,000/yr can offset ordinary (W-2) income if you actively participate and your MAGI is under $100k (phasing out to $0 by $150k); unused losses carry forward. On sale, claimed depreciation is recaptured at up to 25%, and gains may owe capital-gains tax (a 1031 exchange can defer both). Figures are a year-1 estimate at your 24.0% rate — not tax advice; consult a CPA.
Schools (NCES district)
- District
- Boone Community School District
- NCES district ID
- 1905130
- Math proficiency
- 57% ▼ -6.00%
- Reading proficiency
- 66% ▲ 1.00%
- Median HH income
- $48,703
- Composite
- 52.16/100
- National rank
- #1613
- State rank
- #232 of 289 in IA
Livability — Boone
- Score
- 79/100
- State rank
- #112
- US rank
- #2144
Category grades
Schools grade is shown separately in the Schools card above.
Census & demographics
- Census place
- Boone, IA
- Population (ZIP)
- 16,318
Population outlook (Boone County) Hauer SSP2
- Today (2025)
- 27,674 people
- By 2030
- 28,058 · +1.4%
- By 2040
- 28,474 · +2.9%
- By 2050
- 28,383 · +2.6%
- By 2075
- 27,647 · -0.1%
- By 2100
- 25,485 · -7.9%
Race, ethnicity, and origin ACS 2023
- Neighborhood character
- Predominantly White (92%)
- Race & ethnicity
- White 92% Two or more races 4% Hispanic / Latino 3%
- Common ancestry
- Portuguese 10% Iranian 3% Slovak 3%
- Foreign-born
- 1%
- Languages at home
- 98% English-only · Spanish 1%
Political lean MEDSL · Boone
- 2024 margin
- Strong R (+21.5) · D 38.4% · R 59.9% · Other 1.6%
- 2008→2024 swing
- -29.2pp toward R · 2008: 7.6pp · 2024: -21.5pp
- All cycles
- 2024: R+21.5 2020: R+15.6 2016: R+13.9 2012: D+6.4 2008: D+7.6
Not yet ingested
- Civics
- —
Market trends
- HPI YoY
- ▼ -80.62%
- Current HPI
- 216.6814
- Rent YoY
- —
- Metro
- —
- State GDP YoY
- ▲ 2.48%
- F500 in state
- 4
Industry mix (Fortune 500 HQ in IA)
| Industry | F500 HQs | Revenue |
|---|---|---|
| Financial Services | 1 | $16B |
|
||
| Retail / Convenience | 1 | $15B |
|
||
Price history
-31.8% since first listed5 events — show timeline
- 2026-05-29 Listed $149,999 CIBOR
- 2026-04-22 Listing Removed — DMMLS
- 2026-03-20 Price Changed $199,000 CIBOR
- 2026-03-20 Price Changed $199,000 DMMLS
- 2025-10-22 Listed $220,000 DMMLS
Property tax history
+5.0%/yrLatest (2025): $2,380 · -1.1% YoY. Source: county tax records.
Cash-flow waterfall
monthlySold comps — $/sqft
last 12 mo · ≤1 miLoading sold comps…