 Multi-family
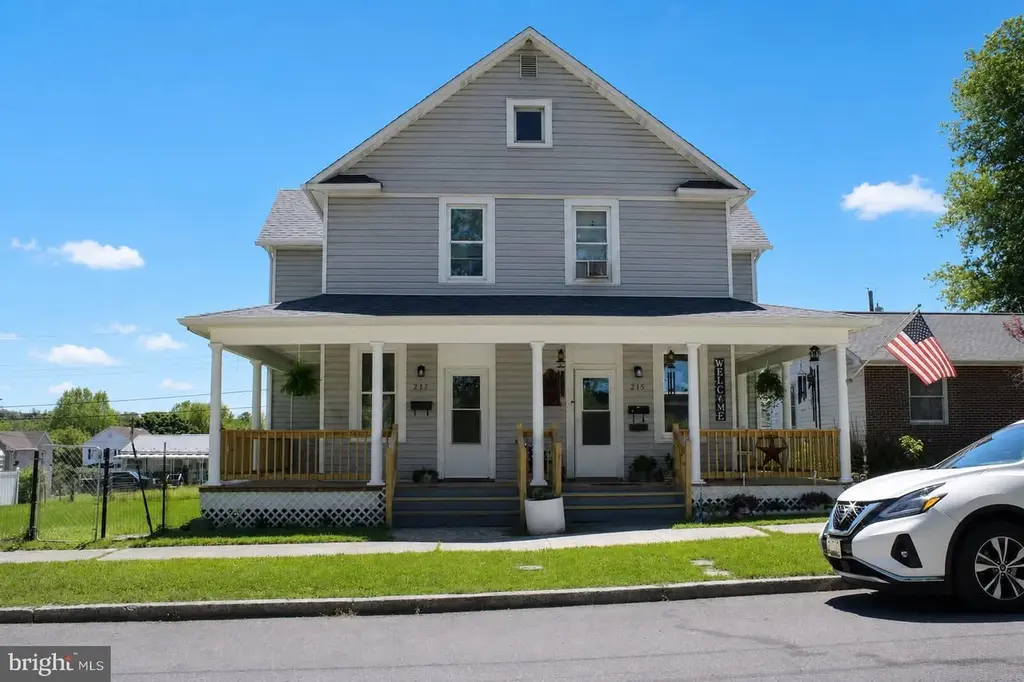
215-217 E Offutt St · Cumberland, MD
Flood risk 1/10 · Minimal
- FEMA flood zone
- X (unshaded)
- Chance of flooding over 30 yrs
- 0.0%
- Est. flood insurance / yr
- $507 – $1,088
Fire risk 3/10 · Minor
- Est. fire insurance / yr
- $755 – $1,403
Heat risk 5/10 · Moderate
- Hot days now (above 101°F)
- 7 days/yr
- Hot days in 30 yrs
- 18 days/yr
Wind risk 2/10 · Minimal
- Chance of severe wind over 30 yrs
- —
Air-quality risk 2/10 · Minimal
- Unhealthy air days now
- 0 days/yr
- Unhealthy air days in 30 yrs
- 1 days/yr
Risk factors via First Street. Map © Google.
Why this score? — see what drove the D+ grade
The composite is a weighted blend of 9 inputs, each scored 0–100. Each bar is that input's sub-score; the figure is the points it added to the 100-point composite (weight × sub-score).
- Cash flow +14.7/30.0
- ARV discount +7.5/15.0
- Rent growth +5.0/5.0
- DSCR +4.5/10.0
- 1% rule +4.1/10.0
- Livability +3.9/5.0
- Condition / age +3.8/5.0
- Schools +1.9/10.0
- Appreciation +0.0/10.0
$260,000
🖨 Deal sheet (PDF) 📄 Offer letter ✓ Due diligence
Multi-family units
County records classify this as Multi-Family (2-4 Unit). Listing-text estimate: 1 unit. estimate disagrees with records
Listing remarks MLS
Breath taking investment property with thousands of dollars in upgrades - New roof, just for starters - Bamboo floors on the main level of one side - Fresh paint - New storm doors - New decks and railings - New gutter system - New heat system on one side - This property is a duplex with one side rented with long term tenants - Both sides, layouts are almost mirror images - Left side has 1 1/2 baths - Very nice home - Live in one side and rent the other - Additional lot could possibly be purchased separately ( not included in sale ) - Could easily rent for $1,000 - $1,100 per month or more each side.
Key facts
- Bamboo flrs
- Fresh paint
- New decks
Tags
Property features AI
Exterior
- Parking: On-street parking
- Utilities: Public water; Public sewer; 200+ amp electric service; Electric heating and hot water
- Home design: Detached structure; Architectural shingle roof; Vinyl siding; Stone foundation
- Construction: Vinyl siding construction; Stone foundation; Architectural shingle roof; Double-pane windows; Above-grade and below-grade structures
- Exterior features: Lot dimensions approximately 50 x 125; Road surface: blacktop; Located in city limits
Interior
- Kitchen: Refrigerator; Stove
- Bedrooms: Six bedrooms on the first upper level; Additional bedrooms listed: Bedroom 1, Bedroom 2, Bedroom 3, Bedroom 4, Bedroom 5, Bedroom 6
- Bathrooms: Two full bathrooms (all upper levels); Two full bathrooms on the first upper level; One half bathroom on the main level; One half bathroom total
- Heating & cooling: Baseboard electric heating; Ceiling fans for cooling
- Interior features: Drywall walls and ceilings; Basement with outside entrance; partial and unfinished
- Laundry & utility: Washer and dryer located on the main floor; Electric water heater
Neighborhood map
What this means for you Summary
Snapshot
- This is a 3-bed/1.5-bath multifamily listed at $260k. Condition is rated good.
Deal economics
- At list price, monthly cash flow is $67 ($802/yr) — positive.
- The deal already cash-flows at list — no discount required.
- To meet the 1% rule (rent ≥ 1% of price), the offer needs to be $236k (9.3% below list).
- Recommended offer: $236k (9.3% below list) — sets the bar for 1% rule.
Location & tenants
- Location reads 78/100 on livability (#64 in MD, #2,385 nationally) — a middle-class / working-renter tenant base. Strengths: amenities A+, commute A+, cost of living A+; Watch: crime F, employment F.
- Allegany County Public Schools (other): math 15% / reading 30% proficiency, ranked #18 of 24 in MD (top 75%) — low school quality limits family demand, transient renter base, plan for 1-2y turnover.
- Zoned schools: John Humbird Elementary (math 12% / reading 17%, grade F, #477 of 860 statewide, top 59%, 234 students, 87% FRL); Washington Middle (math 7% / reading 30%, grade F, #159 of 225 statewide, top 73%, 583 students, 62% FRL); Fort Hill High (math 42% / reading 62%, grade D+, #100 of 222 statewide, top 47%, 692 students, 58% FRL) — zoned schools average 69% FRL vs 47% district-wide (22 pts higher); higher-poverty schools than district average — tighter screening recommended.
- Market conditions: Rents rising fast (+10.9%/yr); 238 active listings in the ZIP; 1 comparable units currently listed for rent nearby; 24 units permitted in Allegany County in 2024 (0 in 5+ unit buildings).
- At $2,359/mo this rent would consume 47% of the median local household income ($61k/yr) (locally 824% of renters already pay >50% of income on rent) — very limited rent-growth headroom before tenants either downsize or default.
Forward outlook
- Local home prices are declining (-3.0%/yr); year-one equity from $2k of loan paydown is wiped out by about $8k of value loss. Plan a longer hold.
- Allegany County population projected at -14% by 2050 — secular population decline; favor cash flow + early exit over multi-decade hold.
Negotiation context
- It's been on market 19 days — a 2% lower offer ($256k) is reasonable based on typical stale-listing flexibility.
- 3 sale attempts with the ask held roughly flat each time — persistent listings suggest the price (not the market) is what's stuck; bring a comps-based counter.
Risks & watch-outs
- Watch-outs: built in 1910 — expect roof / HVAC / electrical / plumbing capex.
- Climate carrying-cost: extreme-heat days projected 7→18/yr by 2055 (HVAC capex compounding) — expect insurance premiums to compound above CPI over the hold.
Questions for the listing agent
- Built in 1910 — when were the roof, HVAC, electrical panel, plumbing, and water heater last replaced?
- Is there a deadline driving the sale (1031 exchange, divorce, estate, relocation)? That informs how much negotiation room exists.
- Schools are D-rated, which usually means shorter tenancies and higher turnover. Who's the typical renter profile here, and what's been the actual vacancy rate?
- Crime grade is F in this area — have there been break-ins, vandalism, or insurance claims at this property in the last 3 years? What carrier currently insures it and at what premium?
- The area grade is low — what's the realistic commute time and amenity access for the typical tenant pool here? Any planned neighborhood developments (good or bad) we should know about?
- What's the average days-on-market for RENTAL listings here right now (not sales)? A rising rental-DOM trend means longer vacancies and softer asking-rent achievability than the comps imply.
- What's the recent tenant-quality profile in this submarket — average credit score on applications, eviction rate, late-payment / NSF rate, and stable-employment percentage? A property-management company in the area should have these aggregated.
- How much new apartment / multifamily construction is in the pipeline within 1–3 miles? Heavy new supply (>2% of stock underway) typically softens rents 12–24 months out; light construction supports rent growth.
Investment metrics
- 1% rule
- 0.91% ✗
- Cap rate
- 6.60%
- Cash-on-cash
- 1.10%
- DSCR
- 1.05
- GRM
- 9.2
CMA / ARV
- ARV (on-the-fly)
- $60,544
- Comps found
- 1
Show comp detail 1 sale within ~0.75 mi
| Address | Dist | Beds/Ba | Sqft | Sold | Price | $/sf | Match |
|---|---|---|---|---|---|---|---|
| 425 Arch St | 0.48mi | 4/— (+1) | 2,526 (-8%) | 6mo | $55,000 | $22 | 53 |
Match score weights: distance 35% · size 25% · config 20% · recency 20%. Top-matched comps best support the ARV.
Projected returns pro-forma
-3.0% appreciation · 8.0% rent growth · sell at horizon
- IRR
- -9.1%
- Equity multiple
- 0.65×
- Total profit
- $-25,374
- Equity at exit
- $38,767
- IRR
- 6.1%
- Equity multiple
- 1.55×
- Total profit
- $40,270
- Equity at exit
- $22,480
Cash invested: $72,800 (down + closing). Projections, not guarantees.
Landlord ↔ Tenant lean methodology
- Overall (STATE)
- 27 Tenant-Leaning
- State Maryland
- 27 Tenant-Leaning · D+14
- County
- — inherits STATE
- City
- — inherits STATE
ZIP-level market 21502
- Home prices YoY
- -17.4%
- Rents YoY
- 10.9%
- Active inventory
- 238
- Price-to-rent
- 18.4×
Monthly cashflow live
- Estimated rent
- $2,359 medium interval (Pro) →
- Mortgage (P&I)
- −$1,363
- Tax est. 1.5%
- −$325 /mo · $3,900/yr
- Insurance
- −$108
- HOA
- −$0
- Vacancy / Maint / Mgmt
- −$495
- Net cashflow
- $67
Break-even live
Sensitivity live
| Price | -10% $246 | -5% $157 | +0% $67 | +5% $-23 | +10% $-113 |
|---|---|---|---|---|---|
| Rent | -10% $-120 | -5% $-26 | +0% $67 | +5% $160 | +10% $253 |
| Rate | -1.0pp $198 | -0.5pp $133 | base $67 | +0.5pp $-1 | +1.0pp $-69 |
2-unit breakdown (identical units grouped — click to expand)
| Units | Beds | Baths | Est. rent |
|---|---|---|---|
| 2× units | 2 | 1.5 | $2,360 |
| #1 | 2 | 1.5 | $1,180 |
| #2 | 2 | 1.5 | $1,180 |
| Total (2 units) | $2,359 | ||
UW: 25.0% down · 7.5% · 30yr · 1.5% tax · 5.0% vac · 8.0% maint · 8.0% mgmt
Financing live
Cash to close
- Down payment
- $65,000
- Closing costs
- $7,800
- Reserves months
- —
- Total cash needed
- —
Loan-product check · same deal, 3 products live
Conventional
25% down · 7.5% · 30yr
- Down + closing
- —
- Monthly P&I
- —
- Monthly cashflow
- —
- DSCR
- —
- Eligible?
- —
Personal DTI + credit; lowest rate.
DSCR
20% down · 8.5% · 30yr
- Down + closing
- —
- Monthly P&I
- —
- Monthly cashflow
- —
- DSCR
- —
- Eligible?
- —
No personal income docs; deal must DSCR.
Hard money
10% down · 12.0% · 12mo
- Down + closing
- —
- Monthly P&I
- —
- Monthly cashflow
- —
- DSCR
- —
- Eligible?
- —
Short-term bridge; refi at stabilization.
Rent comps 1 comps
| Address | Beds | Baths | Sqft | Rent | $/sqft | DOM | Units | Dist |
|---|---|---|---|---|---|---|---|---|
| 109 Grand Ave Unit B Cumberland, MD | 2.0 | 1.0 | 3000 | $800 | $0.27 | 45d | 1 | 0.77mi |
Listing history 14 events
-
2026-06-21days on market $260,000 Active 19 DOM
-
2026-06-19days on market $260,000 Active 17 DOM
-
2026-06-18days on market $260,000 Active 16 DOM
-
2026-06-17days on market $260,000 Active 15 DOM
-
2026-06-16days on market $260,000 Active 14 DOM
-
2026-06-15days on market $260,000 Active 13 DOM
-
2026-06-14days on market $260,000 Active 11 DOM
-
2026-06-12days on market $260,000 Active 10 DOM
-
2026-06-09days on market $260,000 Active 7 DOM
-
2026-06-08days on market $260,000 Active 6 DOM
-
2026-06-07remarks 684-char remark
-
2026-06-07days on market $260,000 Active 5 DOM
-
2026-06-03remarks 607-char remark
-
2026-06-03$260,000 Active 1 DOM
ⓘ Source: listings_history table (triggers on properties + properties_extension) + one-shot
backfill from property_details.listing_events for pre-trigger history.
Climate risk First Street
- Flood 1/10 Low FEMA zone X (unshaded) · 0% chance over 30 yrs
- Wildfire 3/10 Moderate
- Heat 5/10 Major 7 d/yr ≥101°F today · 18 d/yr by 30 yrs out
- Wind 2/10 Low
- Air quality 2/10 Low 0 unhealthy d/yr today · 1 by 30 yrs out
Nearby sold comps map
Loading sold comps map…
Walkable amenities ~0.75 mi
Loading nearby amenities…
Taxation est. · year 1
- Rental income
- $28,308
- − Mortgage interest
- −$14,564
- − Property taxes
- −$3,900
- − Insurance
- −$1,300
- − Repairs & maintenance
- −$2,265
- − Management
- −$2,265
- − Depreciation
- −$7,564
- Taxable loss
- −$3,549
- Est. tax savings @ 24.0%
- +$852
- After-tax cash flow
- $1,653/yr
For passive investors: Depreciation is non-cash, so a rental often shows a tax loss while cash-flowing — sheltering income. Rental losses are passive: they offset passive income freely, and up to $25,000/yr can offset ordinary (W-2) income if you actively participate and your MAGI is under $100k (phasing out to $0 by $150k); unused losses carry forward. On sale, claimed depreciation is recaptured at up to 25%, and gains may owe capital-gains tax (a 1031 exchange can defer both). Figures are a year-1 estimate at your 24.0% rate — not tax advice; consult a CPA.
Condition & rehab AI · 6 photos
This multi-family home is in good condition with recent upgrades and a well-maintained exterior. It has a good potential for rental income and could benefit from some cosmetic updates to further increase its value.
Value-add opportunities
- Both Paint the exterior siding — Painting the exterior siding can enhance the curb appeal and increase the home's value.
- Both Replace the gutters — Replacing the gutters can improve the home's appearance and protect the siding from water damage.
Renovation cost estimate screening
Value-add ROI direction
- Both Paint the exterior siding — Painting the exterior siding can enhance the curb appeal and increase the home's value. ↑
- Both Replace the gutters — Replacing the gutters can improve the home's appearance and protect the siding from water damage. ↑
ⓘ Cost ranges are severity-bucket heuristics (US national rule-of-thumb). Get contractor quotes + a written scope before underwriting a rehab budget.
Schools (NCES district)
- District
- Allegany County Public Schools
- NCES district ID
- 2400030
- Math proficiency
- 15% ▼ -26.00%
- Reading proficiency
- 30% ▼ -20.00%
- Median HH income
- $39,760
- Composite
- 18.95/100
- National rank
- #8854
- State rank
- #18 of 24 in MD
Livability — Cumberland
- Score
- 78/100
- State rank
- #64
- US rank
- #2385
Category grades
Schools grade is shown separately in the Schools card above.
Census & demographics
- Census place
- Cumberland, MD
- County
- Allegany County · 41,015 people
- City population
- 41,015
- Metro
- Cumberland, MD-WV
- Population (ZIP)
- 41,015
- Household income
- $60,725
- Rent vs Own
- Severe rent burden
- 824.0
Population outlook (Allegany County) Hauer SSP2
- Today (2025)
- 68,778 people
- By 2030
- 66,766 · -2.9%
- By 2040
- 62,784 · -8.7%
- By 2050
- 59,179 · -14.0%
- By 2075
- 50,732 · -26.2%
- By 2100
- 40,837 · -40.6%
Race, ethnicity, and origin ACS 2023
- Neighborhood character
- Predominantly White (83%)
- Race & ethnicity
- White 83% Black 9% Two or more races 5% Hispanic / Latino 2%
- Common ancestry
- Slovak 3% Romanian 2% Italian 1%
- Foreign-born
- 2% · Canada
- Languages at home
- 96% English-only · Spanish 2%
Political lean MEDSL · Allegany
- 2024 margin
- Solid R (+40.3) · D 28.9% · R 69.2% · Other 2.0%
- 2008→2024 swing
- -14.4pp toward R · 2008: -25.9pp · 2024: -40.3pp
- All cycles
- 2024: R+40.3 2020: R+38.3 2016: R+48.0 2012: R+32.9 2008: R+25.9
Not yet ingested
- Civics
- —
Market trends
- HPI YoY
- ▼ -54.33%
- Current HPI
- 258.6676
- Rent YoY
- ▲ 10.88%
- Metro
- Cumberland, MD-WV
- State GDP YoY
- ▲ 2.97%
- F500 in state
- 12
Industry mix (Fortune 500 HQ in MD)
| Industry | F500 HQs | Revenue |
|---|---|---|
| Aerospace / Defense | 1 | $71B |
|
||
| Utilities | 1 | $25B |
|
||
| Hotels | 1 | $24B |
|
||
| Consumer Goods | 1 | $7B |
|
||
| Real Estate | 1 | $6B |
|
||
| Chemicals | 1 | $2B |
|
||
Price history
+44.5% since first listed4 events — show timeline
- 2026-06-02 Listed $260,000 BRIGHT MLS
- 2026-06-02 Listed $260,000 BRIGHT MLS
- 2025-09-17 Listing Removed — BRIGHT MLS
- 2025-06-17 Listed $179,900 BRIGHT MLS
Cash-flow waterfall
monthlySold comps — $/sqft
last 12 mo · ≤1 miLoading sold comps…