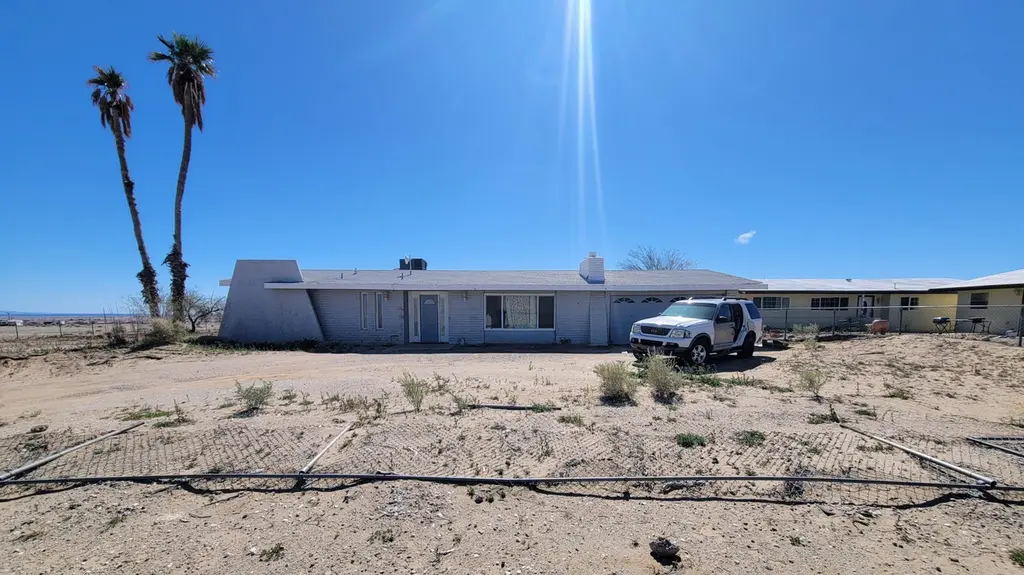
1453 S Marina Dr · Salton City, CA
Flood risk 1/10 · Minimal
- FEMA flood zone
- X (unshaded)
- Chance of flooding over 30 yrs
- 0.0%
- Est. flood insurance / yr
- $507 – $1,088
Fire risk 1/10 · Minimal
- Est. fire insurance / yr
- $659 – $1,223
Heat risk 10/10 · Severe
- Hot days now (above 113°F)
- 7 days/yr
- Hot days in 30 yrs
- 19 days/yr
Wind risk 1/10 · Minimal
- Chance of severe wind over 30 yrs
- —
Air-quality risk 2/10 · Minimal
- Unhealthy air days now
- 2 days/yr
- Unhealthy air days in 30 yrs
- 2 days/yr
Risk factors via First Street. Map © Google.
Why this score? — see what drove the B+ grade
The composite is a weighted blend of 9 inputs, each scored 0–100. Each bar is that input's sub-score; the figure is the points it added to the 100-point composite (weight × sub-score).
- Cash flow +25.9/30.0
- ARV discount +15.0/15.0
- Appreciation +10.0/10.0
- DSCR +8.7/10.0
- 1% rule +7.4/10.0
- Rent growth +2.5/5.0
- Condition / age +2.5/5.0
- Livability +2.3/5.0
- Schools +1.5/10.0
$180,000
🖨 Deal sheet (PDF) 📄 Offer letter ✓ Due diligence
Listing remarks MLS
Mid-Century Modern Restoration Opportunity in Salton City! Bring your vision and your contractor to this 1,847-square-foot architectural canvas. Located at 1453 Marina Dr, this property features the unmistakable 'bones' of mid-century design, waiting for a full-scale modern revival. While the home is in physical distress and requires a complete remodel, the spacious layout--including a large living area with a signature fireplace and a 2-car garage--provides a solid foundation for a stunning transformation. The backyard features a pool (currently partially filled) that is ready to be restored into a desert oasis. Offered at just $190K, this is a rare chance to own a piece of Salton City history. Cash or non-traditional financing only.
Key facts
- Mid-century modern
- Large living area
- Desert oasis
Tags
Neighborhood map
What this means for you Summary
Snapshot
- This is a 3-bed/2.0-bath single-family listed at $180k.
Deal economics
- At list price, monthly cash flow is $443 ($5k/yr) — positive.
- The deal already cash-flows at list — no discount required.
- Meets the 1% rule at list price ($2k rent vs $180k).
- Recommended offer: $164k (9.0% below list) — sets the bar for market timing.
- Cap rate 9.2% vs local median 4.4% in Salton City — top-decile yield for the area; either an underpriced asset or a hidden risk that comps aren't pricing in. Stress-test before assuming the spread holds.
Location & tenants
- Location reads 46/100 on livability (#1,265 in CA) — a working-class tenant base; expect higher turnover. Strengths: housing A-; Watch: schools F, crime F, amenities F.
- Coachella Valley Unified (rural): math 12% / reading 23% proficiency, ranked #481 of 517 in CA (top 93%) — low school quality limits family demand, transient renter base, plan for 1-2y turnover; 79% free/reduced lunch — lower-income household profile, screen leases tightly.
- Market conditions: 492 active listings in the ZIP; 271 units permitted in Imperial County in 2024 (112 in 5+ unit buildings).
Forward outlook
- In year one you build about $19k of equity ($1k loan paydown + $18k appreciation (10.0% local appreciation)).
- Imperial County population projected at +7% by 2050 — modest demand growth; plan on rents tracking national, not racing it.
- At projected returns (10.0% appreciation + 3.0% rent growth), your $50k cash investment doubles in ~2 years — after that, you're playing with house money.
- By year 2, paydown + projected appreciation supports a ~$31k cash-out refi (75% LTV) — recoverable capital for the next deal without selling this one.
Negotiation context
- It's been on market 105 days — a 9% lower offer ($164k) is reasonable based on typical stale-listing flexibility.
Risks & watch-outs
- Climate carrying-cost: extreme-heat days projected 7→19/yr by 2055 (HVAC capex compounding) — expect insurance premiums to compound above CPI over the hold.
Questions for the listing agent
- It's been on market 105 days. Have you received any prior offers? Is the seller open to a 9% concession, seller financing, or rate buy-down credit?
- Built in 1965 — when were the roof, HVAC, electrical panel, plumbing, and water heater last replaced?
- Why hasn't it sold? Are there any deal-killer items the seller is aware of (foundation, flood, title, zoning, code violations)?
- Is there a deadline driving the sale (1031 exchange, divorce, estate, relocation)? That informs how much negotiation room exists.
- Schools are F-rated, which usually means shorter tenancies and higher turnover. Who's the typical renter profile here, and what's been the actual vacancy rate?
- Crime grade is F in this area — have there been break-ins, vandalism, or insurance claims at this property in the last 3 years? What carrier currently insures it and at what premium?
- What's the average days-on-market for RENTAL listings here right now (not sales)? A rising rental-DOM trend means longer vacancies and softer asking-rent achievability than the comps imply.
- What's the recent tenant-quality profile in this submarket — average credit score on applications, eviction rate, late-payment / NSF rate, and stable-employment percentage? A property-management company in the area should have these aggregated.
- How much new for-sale + rental construction is in the pipeline within 1–3 miles? Heavy new supply typically softens prices + rents 12–24 months out; constrained supply supports both.
Investment metrics
- 1% rule
- 1.24% ✓
- Cap rate
- 9.24%
- Cash-on-cash
- 10.54%
- DSCR
- 1.47
- GRM
- 6.7
CMA / ARV
- ARV (median comp)
- $311,745
- List price
- $180,000
- Delta
- -42.26%
- Verdict
- UNDERPRICED
- Comps
- 16 within 1.0 mi
Projected returns pro-forma
10.0% appreciation · 3.0% rent growth · sell at horizon
- IRR
- 32.0%
- Equity multiple
- 3.51×
- Total profit
- $126,308
- Equity at exit
- $162,158
- IRR
- 27.7%
- Equity multiple
- 7.94×
- Total profit
- $349,955
- Equity at exit
- $349,700
Cash invested: $50,400 (down + closing). Projections, not guarantees.
Landlord ↔ Tenant lean methodology
- Overall (STATE)
- 18 Strongly Tenant-Friendly
- State California
- 18 Strongly Tenant-Friendly · D+13
- County
- — inherits STATE
- City
- — inherits STATE
ZIP-level market 92274
- Home prices YoY
- 31.9%
- Active inventory
- 492
- Price-to-rent
- 6.7×
Monthly cashflow live
- Estimated rent
- $2,239 medium interval (Pro) →
- Mortgage (P&I)
- −$944
- Tax from tax record
- −$308 /mo · $3,690/yr
- Insurance
- −$75
- HOA
- −$0
- Vacancy / Maint / Mgmt
- −$470
- Net cashflow
- $443
Break-even live
Sensitivity live
| Price | -10% $545 | -5% $494 | +0% $443 | +5% $392 | +10% $341 |
|---|---|---|---|---|---|
| Rent | -10% $266 | -5% $354 | +0% $443 | +5% $531 | +10% $620 |
| Rate | -1.0pp $533 | -0.5pp $488 | base $443 | +0.5pp $396 | +1.0pp $349 |
UW: 25.0% down · 7.5% · 30yr · 1.5% tax · 5.0% vac · 8.0% maint · 8.0% mgmt
Financing live
Cash to close
- Down payment
- $45,000
- Closing costs
- $5,400
- Reserves months
- —
- Total cash needed
- —
Loan-product check · same deal, 3 products live
Conventional
25% down · 7.5% · 30yr
- Down + closing
- —
- Monthly P&I
- —
- Monthly cashflow
- —
- DSCR
- —
- Eligible?
- —
Personal DTI + credit; lowest rate.
DSCR
20% down · 8.5% · 30yr
- Down + closing
- —
- Monthly P&I
- —
- Monthly cashflow
- —
- DSCR
- —
- Eligible?
- —
No personal income docs; deal must DSCR.
Hard money
10% down · 12.0% · 12mo
- Down + closing
- —
- Monthly P&I
- —
- Monthly cashflow
- —
- DSCR
- —
- Eligible?
- —
Short-term bridge; refi at stabilization.
Listing history 20 events
-
2026-06-18days on market $180,000 Active 105 DOM
-
2026-06-17days on market $180,000 Active 104 DOM
-
2026-06-16days on market $180,000 Active 103 DOM
-
2026-06-15days on market $180,000 Active 102 DOM
-
2026-06-13days on market $180,000 Active 100 DOM
-
2026-06-13days on market $180,000 Active 99 DOM
-
2026-06-09days on market $180,000 Active 96 DOM
-
2026-06-08days on market $180,000 Active 95 DOM
-
2026-06-07days on market $180,000 Active 94 DOM
-
2026-06-04days on market $180,000 Active 91 DOM
-
2026-06-03days on market $180,000 Active 90 DOM
-
2026-06-02days on market $180,000 Active 89 DOM
-
2026-06-01days on market $180,000 Active 88 DOM
-
2026-05-31days on market $180,000 Active 87 DOM
-
2026-04-04price $180,000 744-char remark
Show marketing remark (744 chars)
Mid-Century Modern Restoration Opportunity in Salton City! Bring your vision and your contractor to this 1,847-square-foot architectural canvas. Located at 1453 Marina Dr, this property features the unmistakable 'bones' of mid-century design, waiting for a full-scale modern revival. While the home is in physical distress and requires a complete remodel, the spacious layout--including a large living area with a signature fireplace and a 2-car garage--provides a solid foundation for a stunning transformation. The backyard features a pool (currently partially filled) that is ready to be restored into a desert oasis. Offered at just $190K, this is a rare chance to own a piece of Salton City history. Cash or non-traditional financing only.
-
2026-03-04$190,000 Active 744-char remark
Show marketing remark (744 chars)
Mid-Century Modern Restoration Opportunity in Salton City! Bring your vision and your contractor to this 1,847-square-foot architectural canvas. Located at 1453 Marina Dr, this property features the unmistakable 'bones' of mid-century design, waiting for a full-scale modern revival. While the home is in physical distress and requires a complete remodel, the spacious layout--including a large living area with a signature fireplace and a 2-car garage--provides a solid foundation for a stunning transformation. The backyard features a pool (currently partially filled) that is ready to be restored into a desert oasis. Offered at just $190K, this is a rare chance to own a piece of Salton City history. Cash or non-traditional financing only.
-
2019-04-11soldstatus $167,000
-
2001-10-31soldstatus $60,000
-
1993-03-29soldstatus $65,000
-
1992-05-14soldstatus $65,000
ⓘ Source: listings_history table (triggers on properties + properties_extension) + one-shot
backfill from property_details.listing_events for pre-trigger history.
Tax reassessment forecast CA · Resets to sale price
- Current annual tax
- $3,690 · $308/mo
- Projected year-2 tax
- $3,690 · $308/mo
- Expected delta
- $0/yr ($0/mo · 0.0%)
ⓘ Screening estimate from a state-policy table — verify with the county assessor before closing.
Climate risk First Street
- Flood 1/10 Low FEMA zone X (unshaded) · 0% chance over 30 yrs
- Wildfire 1/10 Low
- Heat 10/10 Extreme 7 d/yr ≥113°F today · 19 d/yr by 30 yrs out
- Wind 1/10 Low
- Air quality 2/10 Low 2 unhealthy d/yr today · 2 by 30 yrs out
Nearby sold comps map
Loading sold comps map…
Walkable amenities ~0.75 mi
Loading nearby amenities…
Taxation est. · year 1
- Rental income
- $26,872
- − Mortgage interest
- −$10,083
- − Property taxes
- −$3,690
- − Insurance
- −$900
- − Repairs & maintenance
- −$2,150
- − Management
- −$2,150
- − Depreciation
- −$5,236
- Taxable income
- $2,663
- Est. tax owed @ 24.0%
- −$639
- After-tax cash flow
- $4,672/yr
For passive investors: Depreciation is non-cash, so a rental often shows a tax loss while cash-flowing — sheltering income. Rental losses are passive: they offset passive income freely, and up to $25,000/yr can offset ordinary (W-2) income if you actively participate and your MAGI is under $100k (phasing out to $0 by $150k); unused losses carry forward. On sale, claimed depreciation is recaptured at up to 25%, and gains may owe capital-gains tax (a 1031 exchange can defer both). Figures are a year-1 estimate at your 24.0% rate — not tax advice; consult a CPA.
Schools (NCES district)
- District
- Coachella Valley Unified
- NCES district ID
- 0609070
- Math proficiency
- 12% ▼ -8.00%
- Reading proficiency
- 23% ▼ -6.00%
- Median HH income
- $37,683
- Composite
- 14.62/100
- National rank
- #9408
- State rank
- #481 of 517 in CA
Livability — Salton City
- Score
- 46/100
- State rank
- #1265
- US rank
- #26406
Category grades
Schools grade is shown separately in the Schools card above.
Census & demographics
- Census place
- Salton City, CA
- Population (ZIP)
- 17,909
Population outlook (Imperial County) Hauer SSP2
- Today (2025)
- 186,713 people
- By 2030
- 190,022 · +1.8%
- By 2040
- 195,993 · +5.0%
- By 2050
- 199,534 · +6.9%
- By 2075
- 216,878 · +16.2%
- By 2100
- 352,705 · +88.9%
Race, ethnicity, and origin ACS 2023
- Neighborhood character
- Predominantly Hispanic (88%)
- Race & ethnicity
- Hispanic / Latino 88% Two or more races 49% White 10%
- Hispanic origin (detail)
- Mexican 87%
- Common ancestry
- Italian 1% Portuguese 1%
- Foreign-born
- 42% · Canada
- Languages at home
- 24% English-only · Spanish 76%
Political lean MEDSL · Imperial
- 2024 margin
- Toss-up / Even · D 48.3% · R 49.1% · Other 2.6%
- 2008→2024 swing
- -27.0pp toward R · 2008: 26.2pp · 2024: -0.9pp
- All cycles
- 2024: R+0.9 2020: D+24.4 2016: D+41.1 2012: D+28.8 2008: D+26.2
Not yet ingested
- Civics
- —
Market trends
- HPI YoY
- ▲ 179.97%
- Current HPI
- 744.8454
- Rent YoY
- —
- Metro
- —
- State GDP YoY
- ▲ 3.21%
- F500 in state
- 116
Industry mix (Fortune 500 HQ in CA)
| Industry | F500 HQs | Revenue |
|---|---|---|
| Technology | 27 | $1,492B |
|
||
| Financial Services | 3 | $174B |
|
||
| Retail | 3 | $44B |
|
||
| Insurance | 3 | $26B |
|
||
| Media / Entertainment | 2 | $115B |
|
||
| Pharmaceuticals / Biotech | 2 | $62B |
|
||
Price history
+176.9% since first listed6 events — show timeline
- 2026-04-04 Price Changed $180,000 GPSMLS
- 2026-03-04 Listed $190,000 GPSMLS
- 2019-04-11 Sold (Public Records) $167,000 Public Records
- 2001-10-31 Sold (Public Records) $60,000 Public Records
- 1993-03-29 Sold (Public Records) $65,000 Public Records
- 1992-05-14 Sold (Public Records) $65,000 Public Records
Property tax history
+9.7%/yrLatest (2025): $3,690 · +2.5% YoY. Source: county tax records.
Cash-flow waterfall
monthlySold comps — $/sqft
last 12 mo · ≤1 miLoading sold comps…