1212 Clark Ln · Horseshoe Bend, AR
Flood risk 1/10 · Minimal
- FEMA flood zone
- X
- Chance of flooding over 30 yrs
- 0.0%
- Est. flood insurance / yr
- $507 – $1,088
Fire risk 5/10 · Moderate
- Est. fire insurance / yr
- $1,499 – $2,785
Heat risk 4/10 · Minor
- Hot days now (above 107°F)
- 7 days/yr
- Hot days in 30 yrs
- 20 days/yr
Wind risk 2/10 · Minimal
- Chance of severe wind over 30 yrs
- 3.0%
Air-quality risk 2/10 · Minimal
- Unhealthy air days now
- 0 days/yr
- Unhealthy air days in 30 yrs
- 1 days/yr
Risk factors via First Street. Map © Google.
Why this score? — see what drove the C+ grade
The composite is a weighted blend of 9 inputs, each scored 0–100. Each bar is that input's sub-score; the figure is the points it added to the 100-point composite (weight × sub-score).
- Cash flow +30.0/30.0
- DSCR +10.0/10.0
- 1% rule +8.8/10.0
- ARV discount +4.3/15.0
- Livability +3.2/5.0
- Rent growth +2.5/5.0
- Condition / age +2.5/5.0
- Schools +2.3/10.0
- Appreciation +0.0/10.0
$100,000
🖨 Deal sheet (PDF) 📄 Offer letter ✓ Due diligence
Listing remarks
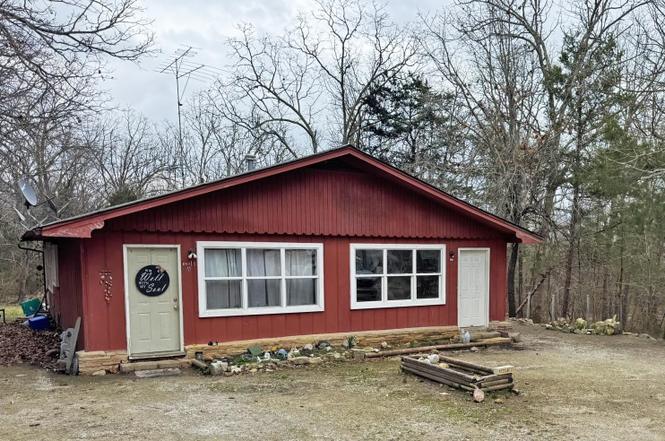
This well-maintained duplex is located in the Tract C Addition of Horseshoe Bend, Arkansas, offering an excellent investment opportunity. Each unit includes 1 bedroom and 1 bathroom, offering comfortable and functional living spaces. One unit has been recently updated with fresh paint and a new heating and air unit within the past 2 years and is currently being rented. The second unit, also rented, shows minor wear but remains in good condition and appealing to prospective tenants. With both units leased, the property has the potential to generate $1,400 in monthly income, making it a strong option for investors seeking reliable cash flow. This duplex is being offered at $100,000.
Key facts
- Fresh paint
- Horseshoe bend
- Minor wear
Tags
Property features AI
Exterior
- Parking: Detached or attached 2-car parking (2-car capacity)
- Utilities: Public water; Electric through cooperative; Propane/butane gas
- Home design: Single-family property; Approx. 1,333 square feet
- Construction: Crawl space foundation
- Exterior features: Masonite exterior; 3-tab shingle roof; Paved road access; Property lies inside city limits; Located in a subdivision
Interior
- Kitchen: Electric range
- Flooring: Wood
- Bathrooms: 2 full bathrooms
- Heating & cooling: Central cooling (electric); Central heat (gas)
- Interior features: Wood floors; Electric range
Neighborhood map
What this means for you Summary
Snapshot
- This is a 2-bed/2.0-bath single-family listed at $100k.
Deal economics
- At list price, monthly cash flow is $495 ($6k/yr) — positive.
- The deal already cash-flows at list — no discount required.
- Meets the 1% rule at list price ($1k rent vs $100k).
- Recommended offer: $94k (6.0% below list) — sets the bar for market timing.
- Cap rate 12.2% vs local median 6.2% in Horseshoe Bend — top-decile yield for the area; either an underpriced asset or a hidden risk that comps aren't pricing in. Stress-test before assuming the spread holds.
Location & tenants
- Location reads 64/100 on livability (#183 in AR) — a middle-class / working-renter tenant base. Strengths: cost of living A+, housing A+, crime B; Watch: amenities F, commute F, employment F.
- Izard CountyConsolidated School District (rural): math 27% / reading 29% proficiency, ranked #171 of 238 in AR (top 72%) — low school quality limits family demand, transient renter base, plan for 1-2y turnover; 63% free/reduced lunch — lower-income household profile, screen leases tightly.
- Zoned schools: Izard Co. Cons. Elem. School (math 42% / reading 27%, grade F, #254 of 454 statewide, top 59%, 270 students, 73% FRL); Izard County Cons Middle Sch (math 27% / reading 27%, grade F, #156 of 201 statewide, top 78%, 185 students, 69% FRL); Izard Co. Cons. High School (math 17% / reading 37%, grade F, #164 of 292 statewide, top 61%, 193 students, 72% FRL).
- Market conditions: 441 active listings in the ZIP; 6 units permitted in Izard County in 2024 (0 in 5+ unit buildings).
Forward outlook
- Local home prices are declining (-3.0%/yr); year-one equity from $691 of loan paydown is wiped out by about $3k of value loss. Plan a longer hold.
- Izard County population projected to shrink 8% by 2050 — rents likely to lag national; underwrite the cash flow, not the appreciation.
- At projected returns (-3.0% appreciation + 3.0% rent growth), your $28k cash investment doubles in ~6 years — after that, you're playing with house money.
Negotiation context
- It's been on market 80 days — a 6% lower offer ($94k) is reasonable based on typical stale-listing flexibility.
- 4 sale attempts since 12y ago; this cycle's ask has dropped $12k (11%) from the opening price — seller is motivated, your offer sets the floor, not the list.
- Current owner paid $63k; list at $100k implies a 59% gain — meaningful room to come down on a strong offer.
Risks & watch-outs
- Climate carrying-cost: moderate wildfire risk — expect insurance premiums to compound above CPI over the hold.
Questions for the listing agent
- It's been on market 80 days. Have you received any prior offers? Is the seller open to a 6% concession, seller financing, or rate buy-down credit?
- Why hasn't it sold? Are there any deal-killer items the seller is aware of (foundation, flood, title, zoning, code violations)?
- Is there a deadline driving the sale (1031 exchange, divorce, estate, relocation)? That informs how much negotiation room exists.
- Schools are F-rated, which usually means shorter tenancies and higher turnover. Who's the typical renter profile here, and what's been the actual vacancy rate?
- What's the average days-on-market for RENTAL listings here right now (not sales)? A rising rental-DOM trend means longer vacancies and softer asking-rent achievability than the comps imply.
- What's the recent tenant-quality profile in this submarket — average credit score on applications, eviction rate, late-payment / NSF rate, and stable-employment percentage? A property-management company in the area should have these aggregated.
- How much new for-sale + rental construction is in the pipeline within 1–3 miles? Heavy new supply typically softens prices + rents 12–24 months out; constrained supply supports both.
Investment metrics
- 1% rule
- 1.38% ✓
- Cap rate
- 12.23%
- Cash-on-cash
- 21.20%
- DSCR
- 1.94
- GRM
- 6.1
CMA / ARV
- ARV (on-the-fly)
- $93,310
- Comps found
- 6
Show comp detail 6 sales within ~0.75 mi
| Address | Dist | Beds/Ba | Sqft | Sold | Price | $/sf | Match |
|---|---|---|---|---|---|---|---|
| 1114 Orchard Ln | 0.11mi | 2/1.5 | 1,360 (+2%) | 1mo | $95,000 | $70 | 89 |
| 1302 Pavillion Ln | 0.21mi | 2/1.5 | 1,323 (-1%) | 21mo | $65,000 | $49 | 70 |
| 906 Sequoia Dr | 0.33mi | 3/2.0 (+1) | 1,200 (-10%) | 16mo | $156,000 | $130 | 49 |
| 602 Tongie Pt | 0.66mi | 3/2.5 (+1) | 1,371 (+3%) | 10mo | $32,000 | $23 | 49 |
| 608 Apache | 0.69mi | 2/2.0 | 1,176 (-12%) | 22mo | $109,900 | $93 | 30 |
| 707 Pony Ln | 0.67mi | 2/1.5 | 1,492 (+12%) | 24mo | $85,000 | $57 | 27 |
Match score weights: distance 35% · size 25% · config 20% · recency 20%. Top-matched comps best support the ARV.
Projected returns pro-forma
-3.0% appreciation · 3.0% rent growth · sell at horizon
- IRR
- 13.6%
- Equity multiple
- 1.54×
- Total profit
- $15,255
- Equity at exit
- $14,910
- IRR
- 22.4%
- Equity multiple
- 2.92×
- Total profit
- $53,683
- Equity at exit
- $8,646
Cash invested: $28,000 (down + closing). Projections, not guarantees.
Landlord ↔ Tenant lean methodology
- Overall (STATE)
- 92 Strongly Landlord-Friendly
- State Arkansas
- 92 Strongly Landlord-Friendly · R+14
- County
- — inherits STATE
- City
- — inherits STATE
ZIP-level market 72512
- Home prices YoY
- -8.3%
- Active inventory
- 441
- Price-to-rent
- 6.1×
Monthly cashflow live
- Estimated rent
- $1,377 medium interval (Pro) →
- Mortgage (P&I)
- −$524
- Tax from tax record
- −$27 /mo · $324/yr
- Insurance
- −$42
- HOA
- −$0
- Vacancy / Maint / Mgmt
- −$289
- Net cashflow
- $495
Break-even live
Sensitivity live
| Price | -10% $551 | -5% $523 | +0% $495 | +5% $466 | +10% $438 |
|---|---|---|---|---|---|
| Rent | -10% $386 | -5% $440 | +0% $495 | +5% $549 | +10% $603 |
| Rate | -1.0pp $545 | -0.5pp $520 | base $495 | +0.5pp $469 | +1.0pp $442 |
UW: 25.0% down · 7.5% · 30yr · 1.5% tax · 5.0% vac · 8.0% maint · 8.0% mgmt
Financing live
Cash to close
- Down payment
- $25,000
- Closing costs
- $3,000
- Reserves months
- —
- Total cash needed
- —
Loan-product check · same deal, 3 products live
Conventional
25% down · 7.5% · 30yr
- Down + closing
- —
- Monthly P&I
- —
- Monthly cashflow
- —
- DSCR
- —
- Eligible?
- —
Personal DTI + credit; lowest rate.
DSCR
20% down · 8.5% · 30yr
- Down + closing
- —
- Monthly P&I
- —
- Monthly cashflow
- —
- DSCR
- —
- Eligible?
- —
No personal income docs; deal must DSCR.
Hard money
10% down · 12.0% · 12mo
- Down + closing
- —
- Monthly P&I
- —
- Monthly cashflow
- —
- DSCR
- —
- Eligible?
- —
Short-term bridge; refi at stabilization.
Listing history 9 events
-
2026-06-21days on market $100,000 Active 80 DOM
-
2026-06-19statusdays on market $100,000 Active 78 DOM
-
2026-06-18days on market $100,000 Price Change 77 DOM
-
2026-06-17days on market $100,000 Price Change 76 DOM
-
2026-06-16days on market $100,000 Price Change 75 DOM
-
2026-06-15days on market $100,000 Price Change 74 DOM
-
2026-06-14days on market $100,000 Price Change 72 DOM
-
2026-06-12remarks 689-char remark
-
2026-06-12$100,000 Price Change 71 DOM
ⓘ Source: listings_history table (triggers on properties + properties_extension) + one-shot
backfill from property_details.listing_events for pre-trigger history.
Tax reassessment forecast AR · Resets to sale price
- Current annual tax
- $324 · $27/mo
- Projected year-2 tax
- $640 · $53/mo
- Expected delta
- +$316/yr (+$26/mo · 97.3%)
ⓘ Screening estimate from a state-policy table — verify with the county assessor before closing.
Climate risk First Street
- Flood 1/10 Low FEMA zone X · 0% chance over 30 yrs
- Wildfire 5/10 Major
- Heat 4/10 Moderate 7 d/yr ≥107°F today · 20 d/yr by 30 yrs out
- Wind 2/10 Low 3% chance of damaging wind over 30 yrs
- Air quality 2/10 Low 0 unhealthy d/yr today · 1 by 30 yrs out
Nearby sold comps map
Loading sold comps map…
Walkable amenities ~0.75 mi
Loading nearby amenities…
Taxation est. · year 1
- Rental income
- $16,521
- − Mortgage interest
- −$5,602
- − Property taxes
- −$324
- − Insurance
- −$500
- − Repairs & maintenance
- −$1,322
- − Management
- −$1,322
- − Depreciation
- −$2,909
- Taxable income
- $4,543
- Est. tax owed @ 24.0%
- −$1,090
- After-tax cash flow
- $4,844/yr
For passive investors: Depreciation is non-cash, so a rental often shows a tax loss while cash-flowing — sheltering income. Rental losses are passive: they offset passive income freely, and up to $25,000/yr can offset ordinary (W-2) income if you actively participate and your MAGI is under $100k (phasing out to $0 by $150k); unused losses carry forward. On sale, claimed depreciation is recaptured at up to 25%, and gains may owe capital-gains tax (a 1031 exchange can defer both). Figures are a year-1 estimate at your 24.0% rate — not tax advice; consult a CPA.
Schools (NCES district)
- District
- Izard CountyConsolidated School District
- NCES district ID
- 0500021
- Math proficiency
- 27% ▼ -15.00%
- Reading proficiency
- 29% ▼ -16.00%
- Median HH income
- $30,245
- Composite
- 22.66/100
- National rank
- #8047
- State rank
- #171 of 238 in AR
Livability — Horseshoe Bend
- Score
- 64/100
- State rank
- #183
- US rank
- #14584
Category grades
Schools grade is shown separately in the Schools card above.
Census & demographics
- Census place
- Horseshoe Bend, AR
- City population
- 2,458
- Population (ZIP)
- 2,458
Population outlook (Izard County) Hauer SSP2
- Today (2025)
- 13,018 people
- By 2030
- 12,761 · -2.0%
- By 2040
- 12,331 · -5.3%
- By 2050
- 12,041 · -7.5%
- By 2075
- 11,516 · -11.5%
- By 2100
- 10,549 · -19.0%
Race, ethnicity, and origin ACS 2023
- Neighborhood character
- Predominantly White (87%)
- Race & ethnicity
- White 87% Two or more races 11% Hispanic / Latino 2%
- Common ancestry
- Romanian 4% Lithuanian 4% Serbian 2%
- Foreign-born
- 0%
- Languages at home
- 99% English-only · Spanish 1%
Political lean MEDSL · Izard
- 2024 margin
- Solid R (+65.9) · D 16.0% · R 81.9% · Other 2.1%
- 2008→2024 swing
- -39.1pp toward R · 2008: -26.9pp · 2024: -65.9pp
- All cycles
- 2024: R+65.9 2020: R+62.1 2016: R+54.3 2012: R+37.8 2008: R+26.9
Not yet ingested
- Civics
- —
Market trends
- HPI YoY
- ▼ -16.58%
- Current HPI
- 184.0807
- Rent YoY
- —
- Metro
- —
- State GDP YoY
- ▲ 3.80%
- F500 in state
- 10
Industry mix (Fortune 500 HQ in AR)
| Industry | F500 HQs | Revenue |
|---|---|---|
| Retail | 1 | $681B |
|
||
| Food / Agriculture | 1 | $53B |
|
||
| Retail / Energy | 1 | $22B |
|
||
| Transportation / Logistics | 1 | $12B |
|
||
| Energy | 1 | $4B |
|
||
Price history
-4.8% since first listed10 events — show timeline
- 2026-06-13 Price Changed $100,000 CARMLS
- 2026-06-12 Relisted — CARMLS
- 2026-06-12 Listing Removed — CARMLS
- 2026-06-04 Listed $112,000 CARMLS
- 2026-05-20 Listing Removed — CARMLS
- 2026-03-03 Listed $112,000 CARMLS
- 2019-07-11 Sold (Public Records) $63,000 Public Records
- 2015-03-19 Listing Removed — CARMLS
- 2014-09-23 Listed $35,000 CARMLS
- 2013-06-26 Sold (Public Records) $105,000 Public Records
Property tax history
+0.3%/yrLatest (2025): $324 · +0.0% YoY. Source: county tax records.
Cash-flow waterfall
monthlySold comps — $/sqft
last 12 mo · ≤1 miLoading sold comps…