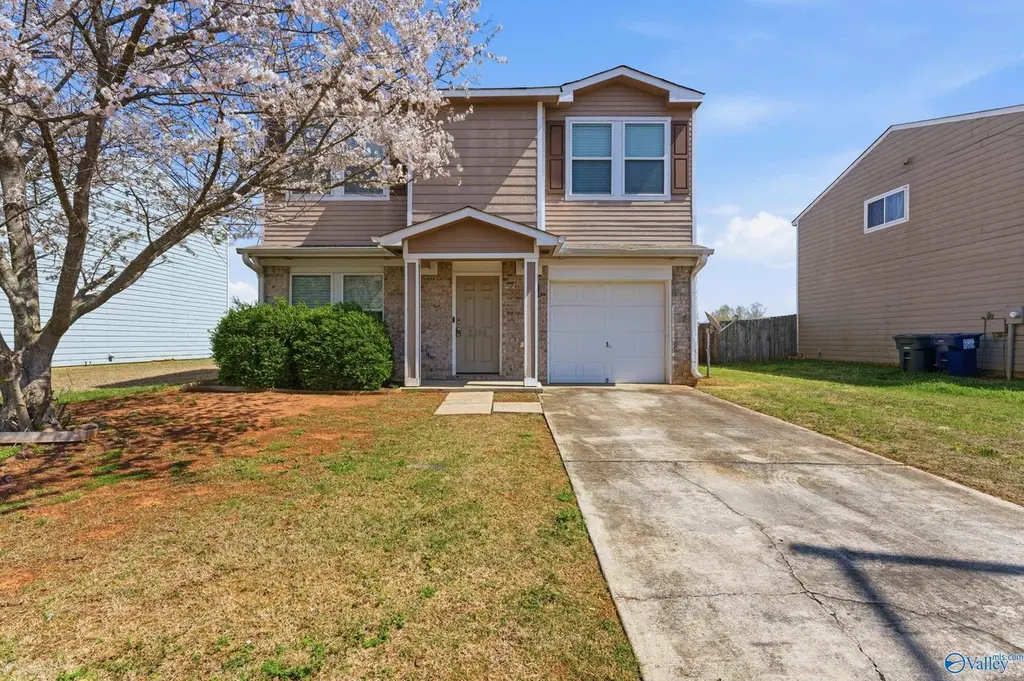
3294 Castlecreek Dr · Huntsville, AL
Flood risk 1/10 · Minimal
- FEMA flood zone
- X (unshaded)
- Chance of flooding over 30 yrs
- 0.0%
- Est. flood insurance / yr
- $507 – $1,088
Fire risk 3/10 · Minor
- Est. fire insurance / yr
- $916 – $1,700
Heat risk 6/10 · Moderate
- Hot days now (above 106°F)
- 7 days/yr
- Hot days in 30 yrs
- 21 days/yr
Wind risk 5/10 · Moderate
- Chance of severe wind over 30 yrs
- 26.0%
Air-quality risk 2/10 · Minimal
- Unhealthy air days now
- 0 days/yr
- Unhealthy air days in 30 yrs
- 2 days/yr
Risk factors via First Street. Map © Google.
Why this score? — see what drove the D grade
The composite is a weighted blend of 9 inputs, each scored 0–100. Each bar is that input's sub-score; the figure is the points it added to the 100-point composite (weight × sub-score).
- Cash flow +13.4/30.0
- ARV discount +8.6/15.0
- Livability +4.1/5.0
- DSCR +4.0/10.0
- 1% rule +3.3/10.0
- Schools +2.9/10.0
- Rent growth +2.8/5.0
- Condition / age +2.5/5.0
- Appreciation +0.0/10.0
$217,500
🖨 Deal sheet (PDF) 📄 Offer letter ✓ Due diligence
Listing remarks MLS
Spacious updated home with an open floor plan. Large fenced in yard. Loft area. Private bath in the Master with a vanity and sink combo. Conveniently located between Decatur / Huntsville.
Key facts
- Open floor plan
- Private bath
- Loft area
Tags
Neighborhood map
What this means for you Summary
Snapshot
- This is a 3-bed/1.0-bath single-family listed at $218k.
Deal economics
- At list price, monthly cash flow is $2 ($28/yr) — positive.
- The deal already cash-flows at list — no discount required.
- To meet the 1% rule (rent ≥ 1% of price), the offer needs to be $181k (16.9% below list).
- Recommended offer: $181k (16.9% below list) — sets the bar for 1% rule.
- Cap rate 6.3% vs local median 3.8% in Huntsville — top-decile yield for the area; either an underpriced asset or a hidden risk that comps aren't pricing in. Stress-test before assuming the spread holds.
Location & tenants
- Location reads 82/100 on livability (#3 in AL, #1,082 nationally) — a professional / high-income tenant draw. Strengths: commute A+, cost of living A+, housing A+; Watch: crime F.
- Huntsville City (urban): math 21% / reading 46% proficiency, ranked #48 of 129 in AL (top 37%) — families likely to look elsewhere, expect single-tenant / working-renter base with shorter leases.
- Market conditions: Rents rising (+1.1%/yr); 826 active listings in the ZIP; 3 comparable units currently listed for rent nearby; rentals at typical pace (median 23d on market — plan ~3-4 weeks tenant-placement turnaround); high-income renter base; 494 units permitted in Limestone County in 2024 (0 in 5+ unit buildings).
- This rent is only 17% of the median local income ($130k/yr) — well below the 30% rent-burden line; pricing power to push rent on renewal without tenant pushback.
Forward outlook
- Local home prices are declining (-3.0%/yr); year-one equity from $2k of loan paydown is wiped out by about $7k of value loss. Plan a longer hold.
- Limestone County population projected at +43% by 2050 — long-run rental-demand tailwind backs the buy-and-hold thesis.
Negotiation context
- It's been on market 93 days — a 9% lower offer ($198k) is reasonable based on typical stale-listing flexibility.
- 6 sale attempts since 13y ago with the ask held roughly flat each time — persistent listings suggest the price (not the market) is what's stuck; bring a comps-based counter.
- Current owner paid $130k; list at $218k implies a 67% gain — meaningful room to come down on a strong offer.
Risks & watch-outs
- Climate carrying-cost: moderate wind risk, 26% chance of damaging wind over 30y; extreme-heat days projected 7→21/yr by 2055 (HVAC capex compounding) — expect insurance premiums to compound above CPI over the hold.
Questions for the listing agent
- It's been on market 93 days. Have you received any prior offers? Is the seller open to a 17% concession, seller financing, or rate buy-down credit?
- What does the HOA fee cover, when was the last increase, and are there any pending special assessments or reserve-fund shortfalls?
- Why hasn't it sold? Are there any deal-killer items the seller is aware of (foundation, flood, title, zoning, code violations)?
- Is there a deadline driving the sale (1031 exchange, divorce, estate, relocation)? That informs how much negotiation room exists.
- Crime grade is F in this area — have there been break-ins, vandalism, or insurance claims at this property in the last 3 years? What carrier currently insures it and at what premium?
- The area grade is low — what's the realistic commute time and amenity access for the typical tenant pool here? Any planned neighborhood developments (good or bad) we should know about?
- What's the average days-on-market for RENTAL listings here right now (not sales)? A rising rental-DOM trend means longer vacancies and softer asking-rent achievability than the comps imply.
- What's the recent tenant-quality profile in this submarket — average credit score on applications, eviction rate, late-payment / NSF rate, and stable-employment percentage? A property-management company in the area should have these aggregated.
- How much new for-sale + rental construction is in the pipeline within 1–3 miles? Heavy new supply typically softens prices + rents 12–24 months out; constrained supply supports both.
Investment metrics
- 1% rule
- 0.83% ✗
- Cap rate
- 6.31%
- Cash-on-cash
- 0.05%
- DSCR
- 1.00
- GRM
- 10.0
CMA / ARV
- ARV (median comp)
- $223,006
- List price
- $217,500
- Delta
- -2.47%
- Verdict
- FAIR
- Comps
- 20 within 1.0 mi
Show comp detail 12 sales within ~0.75 mi
| Address | Dist | Beds/Ba | Sqft | Sold | Price | $/sf | Match |
|---|---|---|---|---|---|---|---|
| 3267 Feldspar Dr SW | 0.15mi | 3/2.0 | 1,558 (-1%) | 1mo | $280,000 | $180 | 86 |
| 3369 Feldspar Dr SW | 0.17mi | 3/2.0 | 1,558 (-1%) | 1mo | $280,000 | $180 | 86 |
| 3344 Avalon Lake Dr | 0.12mi | 3/2.0 | 1,537 (-2%) | 2mo | $225,000 | $146 | 85 |
| 3518 Avalon Lake Dr | 0.08mi | 3/2.0 | 1,498 (-5%) | 2mo | $218,000 | $146 | 82 |
| 3384 Cool Springs Ave SW | 0.39mi | 3/2.0 | 1,561 (-1%) | 0mo | $263,000 | $168 | 76 |
| 3248 Cool Springs Ave SW | 0.39mi | 3/2.0 | 1,561 (-1%) | 1mo | $262,400 | $168 | 76 |
| 3271 Feldspar Dr SW | 0.15mi | 3/2.0 | 1,683 (+7%) | 2mo | $294,900 | $175 | 76 |
| 3272 Cool Springs Ave SW | 0.38mi | 3/2.0 | 1,561 (-1%) | 1mo | $262,400 | $168 | 76 |
| 3428 Cool Springs Ave SW | 0.40mi | 3/2.0 | 1,444 (-8%) | 2mo | $261,400 | $181 | 62 |
| 3376 Cool Springs Ave SW | 0.39mi | 4/2.0 (+1) | 1,680 (+7%) | 1mo | $272,400 | $162 | 61 |
| 3264 Cool Springs Ave | 0.39mi | 4/2.0 (+1) | 1,680 (+7%) | 2mo | $262,000 | $156 | 60 |
| 3256 Cool Springs Ave | 0.39mi | 4/2.0 (+1) | 1,680 (+7%) | 2mo | $262,000 | $156 | 60 |
Match score weights: distance 35% · size 25% · config 20% · recency 20%. Top-matched comps best support the ARV.
Projected returns pro-forma
-3.0% appreciation · 1.15% rent growth · sell at horizon
- IRR
- -18.2%
- Equity multiple
- 0.37×
- Total profit
- $-38,420
- Equity at exit
- $32,430
- IRR
- -14.4%
- Equity multiple
- 0.24×
- Total profit
- $-46,409
- Equity at exit
- $18,805
Cash invested: $60,900 (down + closing). Projections, not guarantees.
Landlord ↔ Tenant lean methodology
- Overall (STATE)
- 90 Strongly Landlord-Friendly
- State Alabama
- 90 Strongly Landlord-Friendly · R+15
- County
- — inherits STATE
- City
- — inherits STATE
ZIP-level market 35756
- Home prices YoY
- -21.7%
- Rents YoY
- 1.1%
- Active inventory
- 826
- Price-to-rent
- 10.0×
Monthly cashflow live
- Estimated rent
- $1,808 medium interval (Pro) →
- Mortgage (P&I)
- −$1,141
- Tax from tax record
- −$182 /mo · $2,178/yr
- Insurance
- −$91
- HOA
- −$13
- Vacancy / Maint / Mgmt
- −$380
- Net cashflow
- $2
Break-even live
Sensitivity live
| Price | -10% $125 | -5% $64 | +0% $2 | +5% $-59 | +10% $-121 |
|---|---|---|---|---|---|
| Rent | -10% $-140 | -5% $-69 | +0% $2 | +5% $74 | +10% $145 |
| Rate | -1.0pp $112 | -0.5pp $58 | base $2 | +0.5pp $-54 | +1.0pp $-111 |
UW: 25.0% down · 7.5% · 30yr · 1.5% tax · 5.0% vac · 8.0% maint · 8.0% mgmt
Financing live
Cash to close
- Down payment
- $54,375
- Closing costs
- $6,525
- Reserves months
- —
- Total cash needed
- —
Loan-product check · same deal, 3 products live
Conventional
25% down · 7.5% · 30yr
- Down + closing
- —
- Monthly P&I
- —
- Monthly cashflow
- —
- DSCR
- —
- Eligible?
- —
Personal DTI + credit; lowest rate.
DSCR
20% down · 8.5% · 30yr
- Down + closing
- —
- Monthly P&I
- —
- Monthly cashflow
- —
- DSCR
- —
- Eligible?
- —
No personal income docs; deal must DSCR.
Hard money
10% down · 12.0% · 12mo
- Down + closing
- —
- Monthly P&I
- —
- Monthly cashflow
- —
- DSCR
- —
- Eligible?
- —
Short-term bridge; refi at stabilization.
Rent comps 3 comps
| Address | Beds | Baths | Sqft | Rent | $/sqft | DOM | Units | Dist |
|---|---|---|---|---|---|---|---|---|
| 3368 Feldspar Dr SW Madison, AL | 4.0 | 2.0 | 1558 | $1,706 | $1.09 | 15d | 1 | 0.13mi |
| 3376 Feldspar Dr SW Madison, AL | 3.0 | 2.0 | 1683 | $1,616 | $0.96 | 23d | 1 | 0.14mi |
| 3377 Feldspar Dr SW Madison, AL | 3.0 | 2.0 | 1683 | $1,616 | $0.96 | 23d | 1 | 0.16mi |
HOA detail
- Monthly dues
- $13 · $156/yr
Listing history 35 events
-
2026-06-22days on market $217,500 Active 93 DOM
-
2026-06-18days on market $217,500 Active 90 DOM
-
2026-06-17days on market $217,500 Active 89 DOM
-
2026-06-16days on market $217,500 Active 88 DOM
-
2026-06-15days on market $217,500 Active 87 DOM
-
2026-06-14days on market $217,500 Active 85 DOM
-
2026-06-10days on market $217,500 Active 82 DOM
-
2026-06-09days on market $217,500 Active 81 DOM
-
2026-06-08days on market $217,500 Active 80 DOM
-
2026-06-07days on market $217,500 Active 79 DOM
-
2026-06-03days on market $217,500 Active 75 DOM
-
2026-06-02days on market $217,500 Active 74 DOM
-
2026-06-01days on market $217,500 Active 73 DOM
-
2026-05-31days on market $217,500 Active 72 DOM
-
2026-05-30pricedays on market $217,500 Active 71 DOM
-
2026-04-23price $219,500 189-char remark
Show marketing remark (189 chars)
Spacious updated home with an open floor plan. Large fenced in yard. Loft area. Private bath in the Master with a vanity and sink combo. Conveniently located between Decatur / Huntsville.
-
2026-03-20$222,000 Active 189-char remark
Show marketing remark (189 chars)
Spacious updated home with an open floor plan. Large fenced in yard. Loft area. Private bath in the Master with a vanity and sink combo. Conveniently located between Decatur / Huntsville.
-
2026-03-19historical $1,450
-
2025-11-20$1,450
-
2025-06-28historical $1,450
-
2025-06-20price $1,450
-
2025-05-24price $1,550
-
2024-11-26price $1,575
-
2024-10-30price $1,600
-
2024-08-30$1,625
-
2019-12-13soldstatus $130,000 Sold 520-char remark
Show marketing remark (520 chars)
This spacious home is located equally convenient to Madison, Huntsville, Athens as well as Decatur with quick access to all major highways. From the moment you enter this home, you will fall in love the grand family room. The oversize family room boasts luxurious hard wood floors lots of light, an open concept, and place to entertain with ease! The bright eat in kitchen with beautiful hard wood floor is waiting for your holiday meal! Come see for yourself just in time to make this one your new home by the new year!
-
2019-11-10status Pending 520-char remark
Show marketing remark (520 chars)
This spacious home is located equally convenient to Madison, Huntsville, Athens as well as Decatur with quick access to all major highways. From the moment you enter this home, you will fall in love the grand family room. The oversize family room boasts luxurious hard wood floors lots of light, an open concept, and place to entertain with ease! The bright eat in kitchen with beautiful hard wood floor is waiting for your holiday meal! Come see for yourself just in time to make this one your new home by the new year!
-
2019-11-08$124,900 Active 520-char remark
Show marketing remark (520 chars)
This spacious home is located equally convenient to Madison, Huntsville, Athens as well as Decatur with quick access to all major highways. From the moment you enter this home, you will fall in love the grand family room. The oversize family room boasts luxurious hard wood floors lots of light, an open concept, and place to entertain with ease! The bright eat in kitchen with beautiful hard wood floor is waiting for your holiday meal! Come see for yourself just in time to make this one your new home by the new year!
-
2016-05-02soldstatus $99,000
-
2016-04-27soldstatus $99,000
-
2015-12-14$99,900
-
2013-05-10soldstatus $48,128
-
2013-05-10soldstatus $48,128
-
2013-02-15$52,000
-
2008-06-25soldstatus $104,263
ⓘ Source: listings_history table (triggers on properties + properties_extension) + one-shot
backfill from property_details.listing_events for pre-trigger history.
Tax reassessment forecast AL · Resets to sale price
- Current annual tax
- $2,178 · $182/mo
- Projected year-2 tax
- $2,178 · $182/mo
- Expected delta
- $0/yr ($0/mo · 0.0%)
ⓘ Screening estimate from a state-policy table — verify with the county assessor before closing.
Climate risk First Street
- Flood 1/10 Low FEMA zone X (unshaded) · 0% chance over 30 yrs
- Wildfire 3/10 Moderate
- Heat 6/10 Major 7 d/yr ≥106°F today · 21 d/yr by 30 yrs out
- Wind 5/10 Major 26% chance of damaging wind over 30 yrs
- Air quality 2/10 Low 0 unhealthy d/yr today · 2 by 30 yrs out
Nearby sold comps map
Loading sold comps map…
Walkable amenities ~0.75 mi
Loading nearby amenities…
Taxation est. · year 1
- Rental income
- $21,692
- − Mortgage interest
- −$12,183
- − Property taxes
- −$2,178
- − Insurance
- −$1,088
- − Repairs & maintenance
- −$1,735
- − Management
- −$1,735
- − HOA
- −$156
- − Depreciation
- −$6,327
- Taxable loss
- −$3,711
- Est. tax savings @ 24.0%
- +$891
- After-tax cash flow
- $919/yr
For passive investors: Depreciation is non-cash, so a rental often shows a tax loss while cash-flowing — sheltering income. Rental losses are passive: they offset passive income freely, and up to $25,000/yr can offset ordinary (W-2) income if you actively participate and your MAGI is under $100k (phasing out to $0 by $150k); unused losses carry forward. On sale, claimed depreciation is recaptured at up to 25%, and gains may owe capital-gains tax (a 1031 exchange can defer both). Figures are a year-1 estimate at your 24.0% rate — not tax advice; consult a CPA.
Schools (NCES district)
- District
- Huntsville City
- NCES district ID
- 0101800
- Math proficiency
- 21% ▼ -23.00%
- Reading proficiency
- 46% ▬ 0.00%
- Median HH income
- $48,264
- Composite
- 28.84/100
- National rank
- #6647
- State rank
- #48 of 129 in AL
Livability — Huntsville
- Score
- 82/100
- State rank
- #3
- US rank
- #1082
Category grades
Schools grade is shown separately in the Schools card above.
Census & demographics
- Census place
- Huntsville, AL
- County
- Limestone County · 80,439 people
- City population
- 220,435
- Metro
- Huntsville, AL
- Population (ZIP)
- 24,947
- Household income
- $129,852
- Rent vs Own
- Severe rent burden
- 286.0
Population outlook (Limestone County) Hauer SSP2
- Today (2025)
- 111,441 people
- By 2030
- 121,272 · +8.8%
- By 2040
- 140,705 · +26.3%
- By 2050
- 159,069 · +42.7%
- By 2075
- 202,231 · +81.5%
- By 2100
- 230,608 · +106.9%
Race, ethnicity, and origin ACS 2023
- Neighborhood character
- Diverse neighborhood (Simpson 0.59)
- Race & ethnicity
- White 59% Black 21% Two or more races 9% Hispanic / Latino 7% Asian 6% Native American 1%
- Hispanic origin (detail)
- Mexican 1% Puerto Rican 2%
- Common ancestry
- Italian 3% Serbian 3% Slovak 3%
- Foreign-born
- 8% · China, South Korea, Canada
- Languages at home
- 90% English-only · Spanish 3% Korean 2% Other Indo-European 2%
Political lean MEDSL · Limestone
- 2024 margin
- Solid R (+43.9) · D 27.5% · R 71.4% · Other 1.2%
- 2008→2024 swing
- -2.0pp toward R · 2008: -41.9pp · 2024: -43.9pp
- All cycles
- 2024: R+43.9 2020: R+42.6 2016: R+49.5 2012: R+43.6 2008: R+41.9
Not yet ingested
- Civics
- —
Market trends
- HPI YoY
- ▼ -50.15%
- Current HPI
- 180.5285
- Rent YoY
- ▲ 1.15%
- Metro
- Huntsville, AL
- State GDP YoY
- ▲ 2.94%
- F500 in state
- 4
Industry mix (Fortune 500 HQ in AL)
| Industry | F500 HQs | Revenue |
|---|---|---|
| Financial Services | 1 | $8B |
|
||
| Healthcare | 1 | $5B |
|
||
Price history
+110.5% since first listed20 events — show timeline
- 2026-04-23 Price Changed $219,500 VMLS
- 2026-03-20 Listed $222,000 VMLS
- 2026-03-19 Rental Removed $1,450 VMLS
- 2025-11-20 Listed for Rent $1,450 VMLS
- 2025-06-28 Rental Removed $1,450 VMLS
- 2025-06-20 Price Changed $1,450 VMLS
- 2025-05-24 Price Changed $1,550 VMLS
- 2024-11-26 Price Changed $1,575 VMLS
- 2024-10-30 Price Changed $1,600 VMLS
- 2024-08-30 Listed for Rent $1,625 VMLS
- 2019-12-13 Sold (MLS) $130,000 VMLS
- 2019-11-10 Pending — VMLS
- 2019-11-08 Listed $124,900 VMLS
- 2016-05-02 Sold (Public Records) $99,000 Public Records
- 2016-04-27 Sold (MLS) $99,000 VMLS
- 2015-12-14 Listed $99,900 VMLS
- 2013-05-10 Sold (Public Records) $48,128 Public Records
- 2013-05-10 Sold (MLS) $48,128 VMLS
- 2013-02-15 Listed $52,000 VMLS
- 2008-06-25 Sold (Public Records) $104,263 Public Records
Property tax history
+14.2%/yrLatest (2025): $2,178 · +0.4% YoY. Source: county tax records.
Cash-flow waterfall
monthlySold comps — $/sqft
last 12 mo · ≤1 miLoading sold comps…