 Duplex
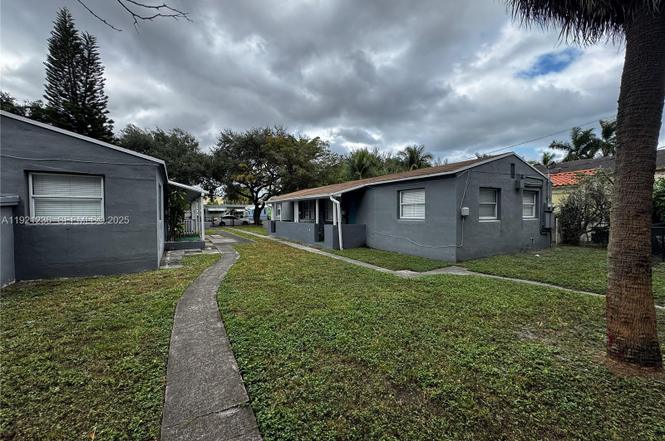
2034 Taylor St · Hollywood, FL
Flood risk 4/10 · Minor
- FEMA flood zone
- X (shaded)
- Chance of flooding over 30 yrs
- 0.23%
- Est. flood insurance / yr
- $507 – $1,088
Fire risk 1/10 · Minimal
- Est. fire insurance / yr
- $947 – $1,759
Heat risk 10/10 · Severe
- Hot days now (above 105°F)
- 7 days/yr
- Hot days in 30 yrs
- 26 days/yr
Wind risk 10/10 · Severe
- Chance of severe wind over 30 yrs
- 99.0%
Air-quality risk 2/10 · Minimal
- Unhealthy air days now
- 1 days/yr
- Unhealthy air days in 30 yrs
- 2 days/yr
Risk factors via First Street. Map © Google.
Why this score? — see what drove the F grade
The composite is a weighted blend of 9 inputs, each scored 0–100. Each bar is that input's sub-score; the figure is the points it added to the 100-point composite (weight × sub-score).
- Cash flow +7.7/30.0
- ARV discount +7.5/15.0
- Schools +4.1/10.0
- Livability +3.8/5.0
- Rent growth +2.6/5.0
- Condition / age +2.5/5.0
- 1% rule +1.9/10.0
- DSCR +1.8/10.0
- Appreciation +0.0/10.0
$675,000
🖨 Deal sheet (PDF) 📄 Offer letter ✓ Due diligence
Multi-family units
County records classify this as Multi-Family (2-4 Unit). Listing-text estimate: 2 units. confirmed
Listing remarks
INVESTOR'S DREAM FULLY OCCUPIED 2 UNIT ATTACHED DUPLEX WITH STRONG RENTAL HISTORY WELL MAINTEAINED, NO HOA. , REDEVELOPMENT OPPOTRTUNITY. BUILD MORE UNITS!!!PRIME LOCATION NEAR MOTIVATE SELLER GREAT SHOPPING CENTERS & MAJOR HIGHWAYS NEARBY . DO NOT DISTURB TENANTS. SHOWINGS BY APPOINTMENT ONLY
Key facts
- Well maintained
- No hoa
- Prime location
Tags
Property features AI
Finance
- Other: Property marketed as multifamily with multiple efficiency units (units noted as leased and month-to-month)
- Financial info: Rent includes electricity, gardener, hot water, sewer, trash collection, and water for some units; Some units are month-to-month; Actual rent example: $2,500 for listed unit type
- HOA & community: No HOA information provided
Exterior
- Parking: 4 total parking spaces (open parking)
- Security: No security features specified
- Utilities: Cable available; Public sewer; Water and electricity service included for some rentals; Trash collection and hot water included for some rentals
- Home design: Single-story property
- Construction: Block construction; Shingle roof; Resale property
- Exterior features: Quarter- to half-acre lot; Zoning: ND-3; Open parking
Interior
- Kitchen: No specific kitchen appliance details provided
- Bedrooms: Efficiency units with 1 bedroom (units available)
- Flooring: Ceramic tile
- Bathrooms: 1 full bathroom in the efficiency units
- Heating & cooling: Central electric heating; Central electric air conditioning
- Interior features: Ceramic tile flooring
- Laundry & utility: On-site laundry room
Neighborhood map
What this means for you Summary
Snapshot
- This is a 2 × 2-bed/1.0-bath units multifamily listed at $675k.
Deal economics
- At list price, monthly cash flow is $-793 ($-10k/yr) — negative. Per door: $-397/mo.
- To cash-flow at today's rent, offer at most $535k (20.8% below list).
- To meet the 1% rule (rent ≥ 1% of price), the offer needs to be $464k (31.3% below list).
- Recommended offer: $464k (31.3% below list) — sets the bar for 1% rule.
- Cap rate 4.9% vs local median 3.2% in Hollywood — top-decile yield for the area; either an underpriced asset or a hidden risk that comps aren't pricing in. Stress-test before assuming the spread holds.
Location & tenants
- Location reads 76/100 on livability (#232 in FL, #3,548 nationally) — a middle-class / working-renter tenant base. Strengths: commute A+, housing A+, crime B+; Watch: amenities D.
- Broward (suburban): math 42% / reading 53% proficiency, ranked #46 of 73 in FL (top 63%) — families likely to look elsewhere, expect single-tenant / working-renter base with shorter leases.
- Zoned schools: Nova Blanche Forman Elementary (math 35% / reading 55%, grade D-, #1,271 of 2,144 statewide, top 60%, 769 students, 72% FRL); Nova Middle School (math 44% / reading 53%, grade C-, #274 of 571 statewide, top 50%, 1,284 students, 68% FRL); South Broward High School (math 24% / reading 49%, grade F, #351 of 667 statewide, top 54%, 2,397 students, 59% FRL).
- Market conditions: Rents flat; 591 active listings in the ZIP; 40 comparable units currently listed for rent nearby; rentals at typical pace (median 26d on market — plan ~3-4 weeks tenant-placement turnaround); 2,111 units permitted in Broward County in 2024 (1,265 in 5+ unit buildings).
- At $4,640/mo this rent would consume 99% of the median local household income ($56k/yr) (locally 3948% of renters already pay >50% of income on rent) — very limited rent-growth headroom before tenants either downsize or default.
Forward outlook
- Local home prices are declining (-3.0%/yr); year-one equity from $5k of loan paydown is wiped out by about $20k of value loss. Plan a longer hold.
- Broward County population projected at +34% by 2050 — long-run rental-demand tailwind backs the buy-and-hold thesis.
Negotiation context
- It's been on market 162 days — a 12% lower offer ($594k) is reasonable based on typical stale-listing flexibility.
- 3 sale attempts; this cycle's ask is 28623% above the opening price — seller raised mid-cycle; expect resistance to lowballs.
- Current owner paid $252k; list at $675k implies a 167% gain — meaningful room to come down on a strong offer.
Risks & watch-outs
- Watch-outs: built in 1950 — expect roof / HVAC / electrical / plumbing capex.
- Climate carrying-cost: severe wind risk, 99% chance of damaging wind over 30y; extreme-heat days projected 7→26/yr by 2055 (HVAC capex compounding) — expect insurance premiums to compound above CPI over the hold.
Questions for the listing agent
- What do current leases actually rent for vs. the listed asking? Can we see a recent rent roll and the last 12 months of T-12 income?
- It's been on market 162 days. Have you received any prior offers? Is the seller open to a 31% concession, seller financing, or rate buy-down credit?
- Can we see the unit-by-unit rent roll, current vacancy, and any below-market leases? What's the average tenancy length?
- What capital expenditures (roof, boiler, parking lot, exteriors) have been made in the last 5 years, and what's planned in the next 2?
- Built in 1950 — when were the roof, HVAC, electrical panel, plumbing, and water heater last replaced?
- Why hasn't it sold? Are there any deal-killer items the seller is aware of (foundation, flood, title, zoning, code violations)?
- Is there a deadline driving the sale (1031 exchange, divorce, estate, relocation)? That informs how much negotiation room exists.
- The area grade is low — what's the realistic commute time and amenity access for the typical tenant pool here? Any planned neighborhood developments (good or bad) we should know about?
- What's the average days-on-market for RENTAL listings here right now (not sales)? A rising rental-DOM trend means longer vacancies and softer asking-rent achievability than the comps imply.
- What's the recent tenant-quality profile in this submarket — average credit score on applications, eviction rate, late-payment / NSF rate, and stable-employment percentage? A property-management company in the area should have these aggregated.
- How much new apartment / multifamily construction is in the pipeline within 1–3 miles? Heavy new supply (>2% of stock underway) typically softens rents 12–24 months out; light construction supports rent growth.
Investment metrics
- 1% rule
- 0.69% ✗
- Cap rate
- 4.88%
- Cash-on-cash
- -5.04%
- DSCR
- 0.78
- GRM
- 12.1
CMA / ARV
No comps found within radius.
Projected returns pro-forma
-3.0% appreciation · 0.43% rent growth · sell at horizon
- IRR
- -27.6%
- Equity multiple
- 0.09×
- Total profit
- $-171,668
- Equity at exit
- $100,645
- IRR
- -38.1%
- Equity multiple
- -0.38×
- Total profit
- $-260,381
- Equity at exit
- $58,362
Cash invested: $189,000 (down + closing). Projections, not guarantees.
Landlord ↔ Tenant lean methodology
- Overall (STATE)
- 87 Strongly Landlord-Friendly
- State Florida
- 87 Strongly Landlord-Friendly · R+3
- County
- — inherits STATE
- City
- — inherits STATE
ZIP-level market 33020
- Rents YoY
- 0.4%
- Active inventory
- 591
- Price-to-rent
- 24.2×
Monthly cashflow live
- Estimated rent
- $4,640 high interval (Pro) →
- Mortgage (P&I)
- −$3,540
- Tax from tax record
- −$638 /mo · $7,656/yr
- Insurance
- −$281
- HOA
- −$0
- Vacancy / Maint / Mgmt
- −$974
- Net cashflow
- $-793
Break-even live
Sensitivity live
| Price | -10% $-411 | -5% $-602 | +0% $-793 | +5% $-984 | +10% $-1,176 |
|---|---|---|---|---|---|
| Rent | -10% $-1,160 | -5% $-977 | +0% $-793 | +5% $-610 | +10% $-427 |
| Rate | -1.0pp $-454 | -0.5pp $-622 | base $-793 | +0.5pp $-968 | +1.0pp $-1,146 |
2-unit breakdown (identical units grouped — click to expand)
| Units | Beds | Baths | Est. rent |
|---|---|---|---|
| 2× units | 2 | 1 | $4,640 |
| #1 | 2 | 1 | $2,320 |
| #2 | 2 | 1 | $2,320 |
| Total (2 units) | $4,640 | ||
UW: 25.0% down · 7.5% · 30yr · 1.5% tax · 5.0% vac · 8.0% maint · 8.0% mgmt
Financing live
Cash to close
- Down payment
- $168,750
- Closing costs
- $20,250
- Reserves months
- —
- Total cash needed
- —
Loan-product check · same deal, 3 products live
Conventional
25% down · 7.5% · 30yr
- Down + closing
- —
- Monthly P&I
- —
- Monthly cashflow
- —
- DSCR
- —
- Eligible?
- —
Personal DTI + credit; lowest rate.
DSCR
20% down · 8.5% · 30yr
- Down + closing
- —
- Monthly P&I
- —
- Monthly cashflow
- —
- DSCR
- —
- Eligible?
- —
No personal income docs; deal must DSCR.
Hard money
10% down · 12.0% · 12mo
- Down + closing
- —
- Monthly P&I
- —
- Monthly cashflow
- —
- DSCR
- —
- Eligible?
- —
Short-term bridge; refi at stabilization.
Rent comps 40 comps
| Address | Beds | Baths | Sqft | Rent | $/sqft | DOM | Units | Dist |
|---|---|---|---|---|---|---|---|---|
| 1818 Hollywood Blvd Hollywood, FL | 3.0 | 1.0–2.5 | 1089 | $5,510 | $5.06 | 0d | 26 | 0.28mi |
| 2165 Van Buren St Hollywood, FL | 3.0 | 1.0–3.0 | 1072 | $4,420 | $4.12 | 0d | 15 | 0.28mi |
| 303 S Federal Hwy Hollywood, FL | 1.0–3.0 | 1.0–3.0 | 992 | $3,690 | $3.72 | 4d | 35 | 0.47mi |
| 1635 Hollywood Blvd Hollywood, FL | 3.0 | 2.0 | 1597 | $3,950 | $2.47 | 4d | 1 | 0.51mi |
| 1635 Hollywood Blvd Hollywood, FL | 3.0 | 2.0 | 1597 | $3,950 | $2.47 | 16d | 1 | 0.51mi |
| 1619 Hollywood Blvd Hollywood, FL | 3.0 | 2.0 | 1827 | $4,600 | $2.52 | 26d | 1 | 0.54mi |
| 1619 Hollywood Blvd Unit 1619 Hollywood, FL | 3.0 | 2.0 | 1827 | $4,600 | $2.52 | 9d | 1 | 0.54mi |
| 1639 Van Buren St Hollywood, FL | 3.0 | 3.0 | 1669 | $5,300 | $3.18 | 26d | 1 | 0.56mi |
| 1630 Van Buren St Hollywood, FL | 4.0 | 3.0 | 1564 | $4,000 | $2.56 | 26d | 1 | 0.59mi |
| 706 S 19th Ave Unit 706 Hollywood, FL | 3.0 | 2.0 | 1727 | $4,350 | $2.52 | 19d | 1 | 0.60mi |
| 706 S 19th Ave Hollywood, FL | 3.0 | 2.0 | 1727 | $3,950 | $2.29 | 9d | 1 | 0.60mi |
| 2511 Pierce St #1 Hollywood, FL | 3.0 | 2.5 | 1500 | $3,800 | $2.53 | 26d | 1 | 0.62mi |
| 1715 Jefferson St Hollywood, FL | 3.0 | 2.0 | 1479 | $4,200 | $2.84 | 23d | 1 | 0.67mi |
| 1907 Cleveland St Unit rear Hollywood, FL | 3.0 | 2.0 | 1300 | $2,500 | $1.92 | 26d | 1 | 0.69mi |
| 2127 McKinley St Unit back Hollywood, FL | 3.0 | 2.0 | 1450 | $2,700 | $1.86 | 26d | 1 | 0.74mi |
| 1640 Jefferson St Hollywood, FL | 5.0 | 2.0 | 1750 | $8,995 | $5.14 | 26d | 1 | 0.75mi |
| 2620 Pierce St Unit A3 Hollywood, FL | 3.0 | 2.5 | 1556 | $3,750 | $2.41 | 20d | 1 | 0.77mi |
| 1201 N 16th Ave Hollywood, FL | 3.0 | 2.0 | 1250 | $3,500 | $2.80 | 26d | 1 | 0.78mi |
| 1435 Grant St Unit N/A Hollywood, FL | 4.0 | 2.0 | 1685 | $12,000 | $7.12 | 26d | 1 | 0.82mi |
| 1521 Arthur St Hollywood, FL | 3.0 | 2.0 | 1140 | $4,450 | $3.90 | 21d | 1 | 0.86mi |
| 2434 McKinley St Hollywood, FL | 3.0 | 2.0 | 1215 | $3,700 | $3.05 | 6d | 1 | 0.87mi |
| 1423 Garfield St Hollywood, FL | 4.0 | 2.0 | 1328 | $3,950 | $2.97 | 4d | 1 | 0.92mi |
| 915 N 14th Way Hollywood, FL | 3.0 | 2.0 | 1554 | $4,400 | $2.83 | 26d | 1 | 0.93mi |
| 2246 Wilson St Hollywood, FL | 3.0 | 2.0 | 1615 | $2,800 | $1.73 | 26d | 1 | 0.94mi |
| 1012 N 13th Ter Hollywood, FL | 3.0 | 2.0 | 1003 | $6,500 | $6.48 | 26d | 1 | 0.95mi |
| 1520 N 25th Ave Hollywood, FL | 3.0 | 2.0 | 1755 | $4,300 | $2.45 | 26d | 1 | 0.95mi |
| 1520 N 25th Ave Hollywood, FL | 3.0 | 2.0 | 1755 | $4,300 | $2.45 | 23d | 1 | 0.95mi |
| 1427 N 26th Ave Hollywood, FL | 3.0 | 1.0 | 1297 | $2,500 | $1.93 | 26d | 1 | 0.97mi |
| 1240 Pierce St Unit 1240 Hollywood, FL | 3.0 | 2.0 | 1673 | $5,500 | $3.29 | 7d | 1 | 0.98mi |
| 1240 Pierce St Unit 1240 Hollywood, FL | 3.0 | 2.0 | 1673 | $6,500 | $3.89 | 26d | 1 | 0.98mi |
| 1120 N 13th Ter Hollywood, FL | 4.0 | 2.0 | 1600 | $5,999 | $3.75 | 26d | 1 | 0.99mi |
| 2746 Johnson St Unit W Hollywood, FL | 3.0 | 2.0 | 1200 | $2,600 | $2.17 | 26d | 1 | 0.99mi |
| 2746 Johnson St Unit W Hollywood, FL | 3.0 | 2.0 | 1200 | $2,600 | $2.17 | 3d | 1 | 0.99mi |
| 1403 Adams St Hollywood, FL | 3.0 | 2.0 | 1459 | $4,500 | $3.08 | 26d | 1 | 1.00mi |
| 1403 Adams St Unit 1403 Hollywood, FL | 3.0 | 2.0 | 1459 | $4,200 | $2.88 | 26d | 1 | 1.00mi |
| 1533 Gabriel St Hollywood, FL | 3.0 | 2.0 | 1282 | $3,100 | $2.42 | 26d | 1 | 1.00mi |
| 1533 Gabriel St Hollywood, FL | 3.0 | 2.0 | 1282 | $3,100 | $2.42 | 9d | 1 | 1.00mi |
| 1251 Lincoln St Hollywood, FL | 3.0 | 2.0 | 1590 | $3,700 | $2.33 | 26d | 1 | 1.01mi |
| 2823 Polk St Hollywood, FL | 3.0 | 2.0 | 1480 | $3,495 | $2.36 | 26d | 1 | 1.02mi |
| 1448 Dewey St Unit 1448 Hollywood, FL | 4.0 | 2.0 | 1459 | $4,999 | $3.43 | 26d | 1 | 1.03mi |
Listing history 17 events
-
2026-05-06status Pending
-
2026-03-25$2,350
-
2026-03-24historical $2,350
-
2026-03-19$2,350
-
2026-02-13price $675,000
-
2026-01-22price $699,999
-
2025-12-03price $725,000
-
2025-11-25$1,150,000 Active
-
2020-03-23soldstatus $252,350
-
2013-06-11soldstatus $300,000
-
2011-12-02soldstatus $210,000
-
2002-03-28soldstatus $115,000
-
1999-07-09soldstatus $85,500
-
1990-06-04soldstatus $70,300
-
1989-11-16soldstatus $72,000
-
1987-08-15soldstatus $60,000
-
1981-07-01soldstatus $67,000
ⓘ Source: listings_history table (triggers on properties + properties_extension) + one-shot
backfill from property_details.listing_events for pre-trigger history.
Tax reassessment forecast FL · Resets to sale price
- Current annual tax
- $7,656 · $638/mo
- Projected year-2 tax
- $7,656 · $638/mo
- Expected delta
- $0/yr ($0/mo · 0.0%)
ⓘ Screening estimate from a state-policy table — verify with the county assessor before closing.
Climate risk First Street
- Flood 4/10 Moderate FEMA zone X (shaded) · 23% chance over 30 yrs
- Wildfire 1/10 Low
- Heat 10/10 Extreme 7 d/yr ≥105°F today · 26 d/yr by 30 yrs out
- Wind 10/10 Extreme 99% chance of damaging wind over 30 yrs
- Air quality 2/10 Low 1 unhealthy d/yr today · 2 by 30 yrs out
Nearby sold comps map
Loading sold comps map…
Walkable amenities ~0.75 mi
Loading nearby amenities…
Taxation est. · year 1
- Rental income
- $55,680
- − Mortgage interest
- −$37,810
- − Property taxes
- −$7,656
- − Insurance
- −$3,375
- − Repairs & maintenance
- −$4,454
- − Management
- −$4,454
- − Depreciation
- −$19,636
- Taxable loss
- −$21,707
- Est. tax savings @ 24.0%
- +$5,210
- After-tax cash flow
- $-4,312/yr
For passive investors: Depreciation is non-cash, so a rental often shows a tax loss while cash-flowing — sheltering income. Rental losses are passive: they offset passive income freely, and up to $25,000/yr can offset ordinary (W-2) income if you actively participate and your MAGI is under $100k (phasing out to $0 by $150k); unused losses carry forward. On sale, claimed depreciation is recaptured at up to 25%, and gains may owe capital-gains tax (a 1031 exchange can defer both). Figures are a year-1 estimate at your 24.0% rate — not tax advice; consult a CPA.
Schools (NCES district)
- District
- Broward
- NCES district ID
- 1200180
- Math proficiency
- 42% ▼ -18.00%
- Reading proficiency
- 53% ▼ -5.00%
- Median HH income
- $52,139
- Composite
- 40.88/100
- National rank
- #3621
- State rank
- #46 of 73 in FL
Livability — Hollywood
- Score
- 76/100
- State rank
- #232
- US rank
- #3548
Category grades
Schools grade is shown separately in the Schools card above.
Census & demographics
- Census place
- Hollywood, FL
- County
- Broward County · 1,963,430 people
- City population
- 109,079
- Metro
- Miami-Fort Lauderdale-Pompano Beach, FL
- Population (ZIP)
- 46,322
- Household income
- $56,473
- Rent vs Own
- Severe rent burden
- 3948.0
Population outlook (Broward County) Hauer SSP2
- Today (2025)
- 2,207,033 people
- By 2030
- 2,360,704 · +7.0%
- By 2040
- 2,661,208 · +20.6%
- By 2050
- 2,946,698 · +33.5%
- By 2075
- 3,602,273 · +63.2%
- By 2100
- 3,970,984 · +79.9%
Race, ethnicity, and origin ACS 2023
- Neighborhood character
- Diverse neighborhood (Simpson 0.68)
- Race & ethnicity
- Hispanic / Latino 43% Two or more races 31% White 28% Black 24% Asian 1%
- Hispanic origin (detail)
- Mexican 1% Puerto Rican 4% Cuban 9% Dominican 3% Salvadoran 3%
- Common ancestry
- Hispanic 5% Lithuanian 2% Scotch-Irish 1%
- Foreign-born
- 41% · Canada, Jamaica, Dominican Republic
- Languages at home
- 48% English-only · Spanish 38% French/Haitian/Cajun 6% Russian/Polish/Slavic 2%
Political lean MEDSL · Broward
- 2024 margin
- D (+17.0) · D 58.0% · R 41.0%
- 2008→2024 swing
- -17.8pp toward R · 2008: 34.7pp · 2024: 17.0pp
- All cycles
- 2024: D+17.0 2020: D+29.8 2016: D+35.0 2012: D+34.9 2008: D+34.7
Not yet ingested
- Civics
- —
Market trends
- HPI YoY
- ▼ -406.34%
- Current HPI
- 524.7664
- Rent YoY
- ▲ 0.43%
- Metro
- Miami-Fort Lauderdale-Pompano Beach, FL
- State GDP YoY
- ▲ 3.28%
- F500 in state
- 36
Industry mix (Fortune 500 HQ in FL)
| Industry | F500 HQs | Revenue |
|---|---|---|
| Industrial Technology | 2 | $29B |
|
||
| Insurance | 2 | $17B |
|
||
| Retail | 1 | $60B |
|
||
| Technology Distribution | 1 | $58B |
|
||
| Homebuilding | 1 | $35B |
|
||
| Technology Manufacturing | 1 | $35B |
|
||
Price history
-96.5% since first listed17 events — show timeline
- 2026-05-06 Pending — MARMLS
- 2026-03-25 Listed for Rent $2,350 RMLSFL
- 2026-03-24 Rental Removed $2,350 GFLMLS
- 2026-03-19 Listed for Rent $2,350 GFLMLS
- 2026-02-13 Price Changed $675,000 MARMLS
- 2026-01-22 Price Changed $699,999 MARMLS
- 2025-12-03 Price Changed $725,000 MARMLS
- 2025-11-25 Listed $1,150,000 MARMLS
- 2020-03-23 Sold (Public Records) $252,350 Public Records
- 2013-06-11 Sold (Public Records) $300,000 Public Records
- 2011-12-02 Sold (Public Records) $210,000 Public Records
- 2002-03-28 Sold (Public Records) $115,000 Public Records
- 1999-07-09 Sold (Public Records) $85,500 Public Records
- 1990-06-04 Sold (Public Records) $70,300 Public Records
- 1989-11-16 Sold (Public Records) $72,000 Public Records
- 1987-08-15 Sold (Public Records) $60,000 Public Records
- 1981-07-01 Sold (Public Records) $67,000 Public Records
Property tax history
+9.1%/yrLatest (2025): $7,656 · +6.8% YoY. Source: county tax records.
Cash-flow waterfall
monthlySold comps — $/sqft
last 12 mo · ≤1 miLoading sold comps…