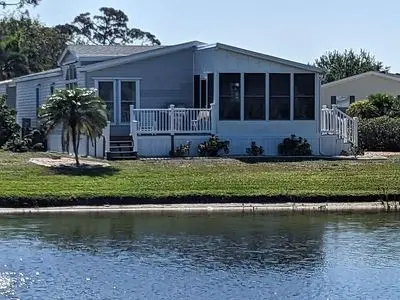
9177 Pinehaven Way · Rotonda, FL
Flood risk 8/10 · Major
- FEMA flood zone
- X (shaded)
- Chance of flooding over 30 yrs
- 0.96%
- Est. flood insurance / yr
- $507 – $1,088
Fire risk 3/10 · Minor
- Est. fire insurance / yr
- $947 – $1,759
Heat risk 10/10 · Severe
- Hot days now (above 107°F)
- 7 days/yr
- Hot days in 30 yrs
- 29 days/yr
Wind risk 10/10 · Severe
- Chance of severe wind over 30 yrs
- 99.0%
Air-quality risk 2/10 · Minimal
- Unhealthy air days now
- 1 days/yr
- Unhealthy air days in 30 yrs
- 1 days/yr
Risk factors via First Street. Map © Google.
Why this score? — see what drove the C grade
The composite is a weighted blend of 9 inputs, each scored 0–100. Each bar is that input's sub-score; the figure is the points it added to the 100-point composite (weight × sub-score).
- Cash flow +23.4/30.0
- DSCR +7.5/10.0
- ARV discount +7.5/15.0
- 1% rule +6.4/10.0
- Schools +4.6/10.0
- Livability +3.4/5.0
- Rent growth +2.5/5.0
- Condition / age +2.5/5.0
- Appreciation +0.0/10.0
$219,500
🖨 Deal sheet 📄 Offer letter ✓ Due diligence
Listing remarks
This doublewide manufactured home is situated in a friendly, over 55, seventy-two lot subdivision where you own your own lot. It is on a choice, waterfront, corner lot, with community amenities including a clubhouse, pool, spa, and playground with pickleball court. All furnishings are included. Recent upgrades include new laminate flooring, appliances, new roof. A large den can serve as a third bedroom. An on demand water heater provides endless hot water. The pond side of the house offers a 10& apos; by 13& apos; enclosed Florida room, as well as an open deck for enjoyment of the pond. Beneath the carport is a 12& apos; by 8& apos; shed with overhead door for golf cart stor
Key facts
- Open deck
- Recent upgrades
- Golf cart storage
Tags
Neighborhood map
What this means for you Summary
Snapshot
- This is a 2-bed/2.0-bath manufactured listed at $220k.
Deal economics
- At list price, monthly cash flow is $340 ($4k/yr) — positive.
- The deal already cash-flows at list — no discount required.
- Meets the 1% rule at list price ($2k rent vs $220k).
- Cap rate 8.5% vs local median 3.1% in Rotonda — top-decile yield for the area; either an underpriced asset or a hidden risk that comps aren't pricing in. Stress-test before assuming the spread holds.
Location & tenants
- Location reads 67/100 on livability (#548 in FL) — a middle-class / working-renter tenant base. Strengths: crime A+, housing A-, cost of living B+; Watch: schools D, amenities F, commute F.
- Charlotte (suburban): math 54% / reading 54% proficiency, ranked #22 of 73 in FL (top 30%) — acceptable for families but not a draw, mixed tenant base, ~2y average lease.
- Market conditions: Rents soft (-0.1%/yr); 734 active listings in the ZIP; 31 comparable units currently listed for rent nearby; rentals at typical pace (median 21d on market — plan ~3-4 weeks tenant-placement turnaround); 4,585 units permitted in Charlotte County in 2024 (703 in 5+ unit buildings).
- At $2,496/mo this rent would consume 52% of the median local household income ($57k/yr) (locally 329% of renters already pay >50% of income on rent) — very limited rent-growth headroom before tenants either downsize or default.
Forward outlook
- Local home prices are declining (-3.0%/yr); year-one equity from $2k of loan paydown is wiped out by about $7k of value loss. Plan a longer hold.
- Charlotte County population projected at +24% by 2050 — long-run rental-demand tailwind backs the buy-and-hold thesis.
Negotiation context
- Only 10 days on market — expect competitive offers; lowballing is unlikely to land.
- 3 sale attempts since 2y ago with the ask held roughly flat each time — persistent listings suggest the price (not the market) is what's stuck; bring a comps-based counter.
Risks & watch-outs
- Watch-outs: flood insurance adds $66/mo.
- Climate carrying-cost: severe flood risk; severe wind risk, 99% chance of damaging wind over 30y; extreme-heat days projected 7→29/yr by 2055 (HVAC capex compounding) — expect insurance premiums to compound above CPI over the hold.
Questions for the listing agent
- What's the actual annual flood-insurance premium (NFIP or private), and is the property in a SFHA with mandatory coverage?
- Is there a deadline driving the sale (1031 exchange, divorce, estate, relocation)? That informs how much negotiation room exists.
- Schools are D-rated, which usually means shorter tenancies and higher turnover. Who's the typical renter profile here, and what's been the actual vacancy rate?
- What's the average days-on-market for RENTAL listings here right now (not sales)? A rising rental-DOM trend means longer vacancies and softer asking-rent achievability than the comps imply.
- What's the recent tenant-quality profile in this submarket — average credit score on applications, eviction rate, late-payment / NSF rate, and stable-employment percentage? A property-management company in the area should have these aggregated.
- How much new for-sale + rental construction is in the pipeline within 1–3 miles? Heavy new supply typically softens prices + rents 12–24 months out; constrained supply supports both.
Investment metrics
- 1% rule
- 1.14% ✓
- Cap rate
- 8.51%
- Cash-on-cash
- 7.93%
- DSCR
- 1.35
- GRM
- 7.3
CMA / ARV
- ARV (on-the-fly)
- $142,506
- Comps found
- 1
Show comp detail 1 sale within ~0.75 mi
| Address | Dist | Beds/Ba | Sqft | Sold | Price | $/sf | Match |
|---|---|---|---|---|---|---|---|
| 3331 Goldfinch Ln | 0.21mi | 2/2.0 | 1,456 (-7%) | 0mo | $133,000 | $91 | 78 |
Match score weights: distance 35% · size 25% · config 20% · recency 20%. Top-matched comps best support the ARV.
Projected returns pro-forma
-3.0% appreciation · 0.0% rent growth · sell at horizon
- IRR
- -9.7%
- Equity multiple
- 0.66×
- Total profit
- $-21,152
- Equity at exit
- $32,728
- IRR
- -5.4%
- Equity multiple
- 0.70×
- Total profit
- $-18,407
- Equity at exit
- $18,978
Cash invested: $61,460 (down + closing). Projections, not guarantees.
Landlord ↔ Tenant lean methodology
- Overall (STATE)
- 87 Strongly Landlord-Friendly
- State Florida
- 87 Strongly Landlord-Friendly · R+3
- County
- — inherits STATE
- City
- — inherits STATE
ZIP-level market 34224
- Home prices YoY
- -18.9%
- Rents YoY
- -0.1%
- Active inventory
- 734
- Price-to-rent
- 7.3×
Monthly cashflow live
- Estimated rent
- $2,496 high interval (Pro) →
- Mortgage (P&I)
- −$1,151
- Tax from tax record
- −$324 /mo · $3,883/yr
- Insurance
- −$91
- Flood insurance flood zone
- −$66 /mo · $798/yr
- HOA
- −$0
- Vacancy / Maint / Mgmt
- −$524
- Net cashflow
- $340
Break-even live
UW: 25.0% down · 7.5% · 30yr · 1.5% tax · 5.0% vac · 8.0% maint · 8.0% mgmt
Financing live
Cash to close
- Down payment
- $54,875
- Closing costs
- $6,585
- Reserves months
- —
- Total cash needed
- —
Loan-product check · same deal, 3 products live
Conventional
25% down · 7.5% · 30yr
- Down + closing
- —
- Monthly P&I
- —
- Monthly cashflow
- —
- DSCR
- —
- Eligible?
- —
Personal DTI + credit; lowest rate.
DSCR
20% down · 8.5% · 30yr
- Down + closing
- —
- Monthly P&I
- —
- Monthly cashflow
- —
- DSCR
- —
- Eligible?
- —
No personal income docs; deal must DSCR.
Hard money
10% down · 12.0% · 12mo
- Down + closing
- —
- Monthly P&I
- —
- Monthly cashflow
- —
- DSCR
- —
- Eligible?
- —
Short-term bridge; refi at stabilization.
Rent comps 31 comps
| Address | Beds | Baths | Sqft | Rent | $/sqft | DOM | Units | Dist |
|---|---|---|---|---|---|---|---|---|
| 113 Boundary Blvd Unit B 1 Rotonda West, FL | 3.0 | 2.0 | 1325 | $1,695 | $1.28 | 20d | 1 | 0.28mi |
| 113 Boundary Blvd #2 Rotonda West, FL | 3.0 | 2.0 | 1323 | $1,625 | $1.23 | 13d | 1 | 0.28mi |
| 130 Boundary Blvd Unit B Rotonda West, FL | 2.0 | 2.0 | 2060 | $2,000 | $0.97 | 20d | 1 | 0.30mi |
| 93 Boundary Blvd #303 Rotonda West, FL | 2.0 | 2.0 | 1228 | $2,800 | $2.28 | 13d | 1 | 0.36mi |
| 100 Rotonda Lakes Cir Rotonda West, FL | 1.0–3.0 | 1.0–2.0 | 1024 | $1,126 | $1.10 | 13d | 1 | 0.40mi |
| 6800 Placida Rd #283 Englewood, FL | 2.0 | 2.0 | 1092 | $1,500 | $1.37 | 20d | 1 | 0.47mi |
| 18 Golfview Ct Rotonda West, FL | 3.0 | 2.0 | 1686 | $3,000 | $1.78 | 20d | 1 | 0.53mi |
| 173 Rotonda Cir Rotonda West, FL | 3.0 | 2.0 | 1350 | $3,200 | $2.37 | 20d | 1 | 0.56mi |
| 188 Boundary Blvd Unit B Rotonda West, FL | 2.0 | 2.0 | 2086 | $2,000 | $0.96 | 20d | 1 | 0.59mi |
| 37 Oakland Hills Pl Rotonda West, FL | 3.0 | 2.0 | 1321 | $4,000 | $3.03 | 20d | 1 | 0.70mi |
| 8541 Amberjack Cir #203 Englewood, FL | 3.0 | 2.0 | 2003 | $5,910 | $2.95 | 20d | 1 | 0.73mi |
| 60 Golfview Rd Rotonda West, FL | 3.0 | 2.0 | 1336 | $5,550 | $4.15 | 20d | 1 | 0.74mi |
| 65 Oakland Hills Pl Rotonda West, FL | 2.0 | 2.0 | 1444 | $4,500 | $3.12 | 20d | 1 | 0.88mi |
| 226 Boundary Blvd Rotonda West, FL | 2.0 | 2.0 | 1200 | $1,495 | $1.25 | 13d | 1 | 0.90mi |
| 239 Annapolis Ln Rotonda West, FL | 3.0 | 2.0 | 1747 | $2,000 | $1.14 | 20d | 1 | 0.91mi |
| 230 Annapolis Ln Rotonda West, FL | 3.0 | 2.0 | 1768 | $1,800 | $1.02 | 20d | 1 | 0.94mi |
| 42 Mark Twain Ln Rotonda West, FL | 3.0 | 2.5 | 1677 | $2,800 | $1.67 | 20d | 1 | 0.96mi |
| 8272 Harborside Cir Englewood, FL | 3.0 | 3.0 | 1590 | $5,200 | $3.27 | 20d | 1 | 0.98mi |
| 8234 Harborside Cir Englewood, FL | 3.0 | 3.0 | 1735 | $4,200 | $2.42 | 20d | 1 | 0.99mi |
| 8936 Scallop Way Placida, FL | 3.0 | 2.0 | 2158 | $5,200 | $2.41 | 20d | 1 | 1.11mi |
| 98 Caddy Rd Rotonda West, FL | 2.0 | 2.0 | 1167 | $4,000 | $3.43 | 20d | 1 | 1.15mi |
| 195 Rotonda Blvd W Unit A Rotonda West, FL | 3.0 | 2.0 | 1162 | $1,850 | $1.59 | 20d | 1 | 1.18mi |
| 87 Mark Twain Ln Rotonda West, FL | 3.0 | 2.0 | 1235 | $2,500 | $2.02 | 20d | 1 | 1.18mi |
| 10446 Coquina Ct Placida, FL | 3.0 | 2.0 | 1820 | $4,500 | $2.47 | 20d | 1 | 1.28mi |
| 118 Caddy Rd Rotonda West, FL | 3.0 | 2.0 | 1828 | $2,795 | $1.53 | 20d | 1 | 1.28mi |
| 8400 Placida Rd Unit G202 Rental Placida, FL | 2.0 | 2.5 | 1688 | $2,500 | $1.48 | 20d | 1 | 1.28mi |
| 278 Boundary Blvd Unit B Rotonda West, FL | 2.0 | 2.0 | 1138 | $1,625 | $1.43 | 20d | 1 | 1.29mi |
| 3923 Cape Haze Dr #302 Rotonda West, FL | 3.0 | 3.0 | 2044 | $3,100 | $1.52 | 20d | 1 | 1.31mi |
| 289 Boundary Blvd Unit 202 Rotonda West, FL | 3.0 | 2.0 | 1168 | $1,645 | $1.41 | 20d | 1 | 1.36mi |
| 9203 Griggs Rd #204 Englewood, FL | 3.0 | 2.5 | 2028 | $3,500 | $1.73 | 20d | 1 | 1.37mi |
| 36 Bunker Cir Rotonda West, FL | 2.0 | 2.0 | 1533 | $3,999 | $2.61 | 20d | 1 | 1.43mi |
Listing history 9 events
-
2026-06-18days on market $219,500 Active 10 DOM
-
2026-06-17days on market $219,500 Active 9 DOM
-
2026-06-16days on market $219,500 Active 8 DOM
-
2026-06-15days on market $219,500 Active 7 DOM
-
2026-06-14days on market $219,500 Active 5 DOM
-
2026-06-13days on market $219,500 Active 4 DOM
-
2026-06-10days on market $219,500 Active 2 DOM
-
2026-06-09remarks 683-char remark
-
2026-06-09$219,500 Active 1 DOM
ⓘ Source: listings_history table (triggers on properties + properties_extension) + one-shot
backfill from property_details.listing_events for pre-trigger history.
Tax reassessment forecast FL · Resets to sale price
- Current annual tax
- $3,883 · $324/mo
- Projected year-2 tax
- $3,883 · $324/mo
- Expected delta
- $0/yr ($0/mo · 0.0%)
ⓘ Screening estimate from a state-policy table — verify with the county assessor before closing.
Climate risk First Street
- Flood 8/10 Severe FEMA zone X (shaded) · 96% chance over 30 yrs
- Wildfire 3/10 Moderate
- Heat 10/10 Extreme 7 d/yr ≥107°F today · 29 d/yr by 30 yrs out
- Wind 10/10 Extreme 99% chance of damaging wind over 30 yrs
- Air quality 2/10 Low 1 unhealthy d/yr today · 1 by 30 yrs out
Nearby sold comps map
Loading sold comps map…
Walkable amenities ~0.75 mi
Loading nearby amenities…
Taxation est. · year 1
- Rental income
- $29,956
- − Mortgage interest
- −$12,295
- − Property taxes
- −$3,883
- − Insurance
- −$1,895
- − Repairs & maintenance
- −$2,396
- − Management
- −$2,396
- − Depreciation
- −$6,385
- Taxable income
- $704
- Est. tax owed @ 24.0%
- −$169
- After-tax cash flow
- $3,905/yr
For passive investors: Depreciation is non-cash, so a rental often shows a tax loss while cash-flowing — sheltering income. Rental losses are passive: they offset passive income freely, and up to $25,000/yr can offset ordinary (W-2) income if you actively participate and your MAGI is under $100k (phasing out to $0 by $150k); unused losses carry forward. On sale, claimed depreciation is recaptured at up to 25%, and gains may owe capital-gains tax (a 1031 exchange can defer both). Figures are a year-1 estimate at your 24.0% rate — not tax advice; consult a CPA.
Schools (NCES district)
- District
- Charlotte
- NCES district ID
- 1200240
- Math proficiency
- 54% ▼ -6.00%
- Reading proficiency
- 54% ▼ -1.00%
- Median HH income
- $44,864
- Composite
- 45.62/100
- National rank
- #2586
- State rank
- #22 of 73 in FL
Livability — Rotonda
- Score
- 67/100
- State rank
- #548
- US rank
- #10359
Category grades
Schools grade is shown separately in the Schools card above.
Census & demographics
- Census place
- Rotonda, FL
- County
- Charlotte County · 196,994 people
- City population
- 10,490
- Metro
- Punta Gorda, FL
- Population (ZIP)
- 15,536
- Household income
- $57,281
- Rent vs Own
- Severe rent burden
- 329.0
Population outlook (Charlotte County) Hauer SSP2
- Today (2025)
- 198,646 people
- By 2030
- 210,507 · +6.0%
- By 2040
- 230,857 · +16.2%
- By 2050
- 247,148 · +24.4%
- By 2075
- 281,777 · +41.8%
- By 2100
- 293,609 · +47.8%
Race, ethnicity, and origin ACS 2023
- Neighborhood character
- Predominantly White (92%)
- Race & ethnicity
- White 92% Two or more races 5% Hispanic / Latino 3% Asian 1%
- Common ancestry
- Romanian 4% Slovak 4% Lithuanian 4%
- Foreign-born
- 9% · Canada
- Languages at home
- 92% English-only · Other Indo-European 2% Spanish 2% German/W. Germanic 1%
Political lean MEDSL · Charlotte
- 2024 margin
- Solid R (+34.0) · D 32.7% · R 66.7%
- 2008→2024 swing
- -26.7pp toward R · 2008: -7.2pp · 2024: -34.0pp
- All cycles
- 2024: R+34.0 2020: R+26.6 2016: R+27.8 2012: R+14.3 2008: R+7.2
Not yet ingested
- Civics
- —
Market trends
- HPI YoY
- ▼ -75.76%
- Current HPI
- 325.0345
- Rent YoY
- ▼ -0.11%
- Metro
- Punta Gorda, FL
- State GDP YoY
- ▲ 3.28%
- F500 in state
- 36
Industry mix (Fortune 500 HQ in FL)
| Industry | F500 HQs | Revenue |
|---|---|---|
| Industrial Technology | 2 | $29B |
|
||
| Insurance | 2 | $17B |
|
||
| Retail | 1 | $60B |
|
||
| Technology Distribution | 1 | $58B |
|
||
| Homebuilding | 1 | $35B |
|
||
| Technology Manufacturing | 1 | $35B |
|
||
Price history
-23.0% since first listed16 events — show timeline
- 2026-06-09 Listed $219,500 FSBO.com
- 2025-04-29 Listing Removed — Stellar MLS as Distributed by MLS Grid
- 2025-03-26 Price Changed $220,000 Stellar MLS as Distributed by MLS Grid
- 2025-03-26 Price Changed $200,000 Stellar MLS as Distributed by MLS Grid
- 2025-02-17 Price Changed $224,800 Stellar MLS as Distributed by MLS Grid
- 2025-02-10 Price Changed $238,500 Stellar MLS as Distributed by MLS Grid
- 2025-01-03 Price Changed $239,500 Stellar MLS as Distributed by MLS Grid
- 2024-10-21 Relisted — Stellar MLS as Distributed by MLS Grid
- 2024-09-13 Pending — Stellar MLS as Distributed by MLS Grid
- 2024-07-11 Price Changed $249,900 Stellar MLS as Distributed by MLS Grid
- 2024-06-06 Price Changed $254,800 Stellar MLS as Distributed by MLS Grid
- 2024-05-21 Price Changed $259,800 Stellar MLS as Distributed by MLS Grid
- 2024-04-22 Price Changed $264,000 Stellar MLS as Distributed by MLS Grid
- 2024-03-20 Price Changed $269,900 Stellar MLS as Distributed by MLS Grid
- 2024-02-19 Price Changed $279,900 Stellar MLS as Distributed by MLS Grid
- 2024-02-06 Listed $284,900 Stellar MLS as Distributed by MLS Grid
Property tax history
+10.1%/yrLatest (2025): $3,883 · +134.9% YoY. Source: county tax records.
Cash-flow waterfall
monthlySold comps — $/sqft
last 12 mo · ≤1 miLoading sold comps…