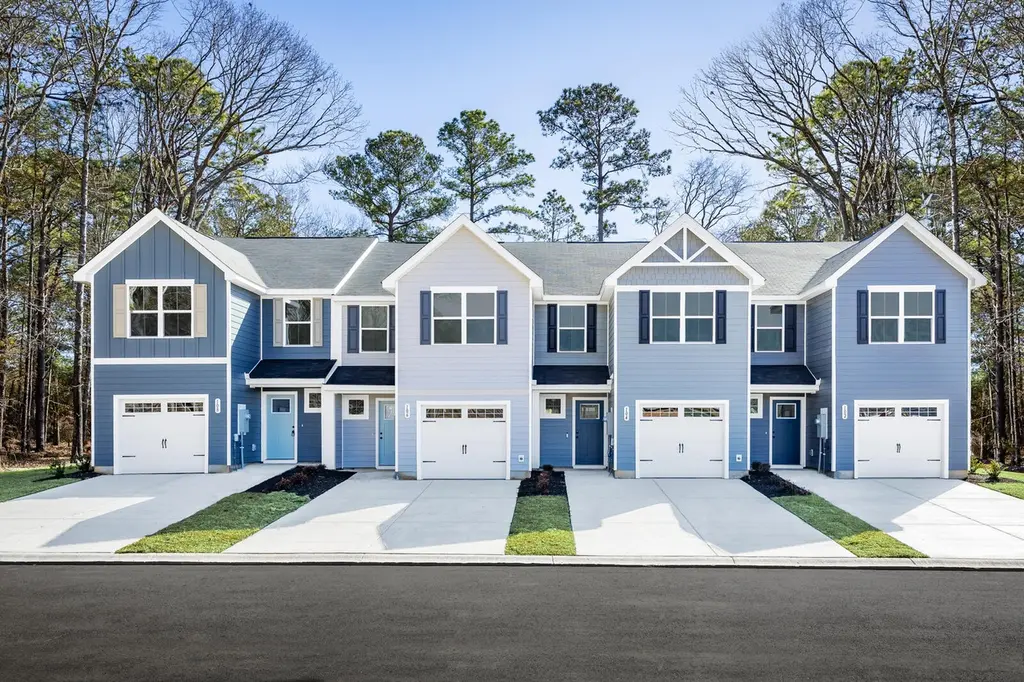
203 Picard Lp · Santee, SC
Flood risk No data
- FEMA flood zone
- —
- Chance of flooding over 30 yrs
- —
- Est. flood insurance / yr
- —
Fire risk No data
- Est. fire insurance / yr
- —
Heat risk No data
- Hot days now (above threshold)
- —
- Hot days in 30 yrs
- —
Wind risk No data
- Chance of severe wind over 30 yrs
- —
Air-quality risk No data
- Unhealthy air days now
- —
- Unhealthy air days in 30 yrs
- —
Risk factors via First Street. Map © Google.
Why this score? — see what drove the B grade
The composite is a weighted blend of 9 inputs, each scored 0–100. Each bar is that input's sub-score; the figure is the points it added to the 100-point composite (weight × sub-score).
- Cash flow +22.9/30.0
- ARV discount +15.0/15.0
- DSCR +7.4/10.0
- 1% rule +7.2/10.0
- Appreciation +6.7/10.0
- Schools +5.0/10.0
- Condition / age +4.0/5.0
- Livability +3.1/5.0
- Rent growth +2.5/5.0
$184,990
🖨 Deal sheet 📄 Offer letter ✓ Due diligence
Listing remarks
Welcome to Chapel Branch by Ryan Homes, an easy first step to homeownership with modern homes and peace of mind built in. From the upper $100s.
Key facts
- $175 HOA
- Garage
- Built 2026
Property features AI
Finance
- Other: Quick move-in available September 2026; All appliances included
- HOA & community: Monthly association fee ($175); Lawn maintenance included; Park access; Storage; Trash service
Exterior
- Parking: 1-car garage with garage door opener; Additional 'Other' parking
- Utilities: Public sewer; Dominion Energy; Tri-County Electric
- Home design: Residential townhouse; Single family attached; Two levels; Covered porch entry
- Construction: Fee simple ownership
- Exterior features: Asphalt roof; Wooded lot; Adjacent to U.S. Forestry Service; Lot under 0.5 acre
Interior
- Kitchen: Dishwasher; Disposal; Electric range; Microwave; Refrigerator
- Bedrooms: 3 bedrooms; Primary bedroom with walk-in closet
- Flooring: Carpet; Luxury vinyl; No interior square footage details provided
- Bathrooms: 2.5 bathrooms
- Heating & cooling: Central air; Electric heating; Heat pump
- Interior features: Kitchen island; Walk-in closets; Eat-in kitchen; Family room; Living/dining combo; Office
- Laundry & utility: Washer and dryer included; Laundry room
Neighborhood map
What this means for you Summary
Snapshot
- This is a 3-bed/2.5-bath townhouse listed at $185k. Condition is rated good.
Deal economics
- At list price, monthly cash flow is $326 ($4k/yr) — positive.
- The deal already cash-flows at list — no discount required.
- Meets the 1% rule at list price ($2k rent vs $185k).
- Cap rate 8.4% vs local median 5.4% in Santee — top-decile yield for the area; either an underpriced asset or a hidden risk that comps aren't pricing in. Stress-test before assuming the spread holds.
Location & tenants
- Location reads 61/100 on livability (#202 in SC) — a middle-class / working-renter tenant base. Strengths: cost of living A+, health & safety A+; Watch: crime F, amenities F, commute F.
- Zoned schools: Elloree Elementary (math 10%, 387 students, 100% FRL).
- Market conditions: 154 active listings in the ZIP; 3 comparable units currently listed for rent nearby; rentals at typical pace (median 23d on market — plan ~3-4 weeks tenant-placement turnaround); 87 units permitted in Orangeburg County in 2024 (0 in 5+ unit buildings).
Forward outlook
- In year one you build about $8k of equity ($1k loan paydown + $6k appreciation (3.5% local appreciation)).
- Orangeburg County population projected at -27% by 2050 — secular population decline; favor cash flow + early exit over multi-decade hold.
- At projected returns (3.5% appreciation + 3.0% rent growth), your $52k cash investment doubles in ~5 years — after that, you're playing with house money.
- By year 5, paydown + projected appreciation supports a ~$33k cash-out refi (75% LTV) — recoverable capital for the next deal without selling this one.
Negotiation context
- Only 5 days on market — expect competitive offers; lowballing is unlikely to land.
Questions for the listing agent
- What does the HOA fee cover, when was the last increase, and are there any pending special assessments or reserve-fund shortfalls?
- Is there a deadline driving the sale (1031 exchange, divorce, estate, relocation)? That informs how much negotiation room exists.
- Schools are D-rated, which usually means shorter tenancies and higher turnover. Who's the typical renter profile here, and what's been the actual vacancy rate?
- Crime grade is F in this area — have there been break-ins, vandalism, or insurance claims at this property in the last 3 years? What carrier currently insures it and at what premium?
- What's the average days-on-market for RENTAL listings here right now (not sales)? A rising rental-DOM trend means longer vacancies and softer asking-rent achievability than the comps imply.
- What's the recent tenant-quality profile in this submarket — average credit score on applications, eviction rate, late-payment / NSF rate, and stable-employment percentage? A property-management company in the area should have these aggregated.
- How much new for-sale + rental construction is in the pipeline within 1–3 miles? Heavy new supply typically softens prices + rents 12–24 months out; constrained supply supports both.
Investment metrics
- 1% rule
- 1.22% ✓
- Cap rate
- 8.41%
- Cash-on-cash
- 7.55%
- DSCR
- 1.34
- GRM
- 6.8
CMA / ARV
- ARV (on-the-fly)
- $224,952
- Comps found
- 12
Show comp detail 12 sales within ~0.75 mi
| Address | Dist | Beds/Ba | Sqft | Sold | Price | $/sf | Match |
|---|---|---|---|---|---|---|---|
| 102 Tancaw Pl | 0.02mi | 3/2.5 | 1,442 (0%) | 7mo | $219,990 | $153 | 93 |
| 108 Tancaw Pl | 0.03mi | 3/2.5 | 1,442 (0%) | 12mo | $230,990 | $160 | 88 |
| 113 Picard Loop | 0.10mi | 3/2.5 | 1,442 (0%) | 9mo | $229,990 | $159 | 88 |
| 111 Picard Loop | 0.11mi | 3/2.5 | 1,442 (0%) | 11mo | $229,990 | $159 | 86 |
| 109 Picard Loop | 0.12mi | 3/2.5 | 1,442 (0%) | 14mo | $227,990 | $158 | 83 |
| 338 Picard Loop | 0.16mi | 3/2.5 | 1,634 (+13%) | 4mo | $246,000 | $151 | 67 |
| 294 Picard Loop | 0.21mi | 3/2.5 | 1,634 (+13%) | 17mo | $247,990 | $152 | 54 |
| 300 Picard Loop | 0.22mi | 3/2.5 | 1,634 (+13%) | 17mo | $247,990 | $152 | 54 |
| 290 Picard Loop | 0.21mi | 3/2.5 | 1,634 (+13%) | 18mo | $247,990 | $152 | 53 |
| 340 Picard Loop | 0.18mi | 3/2.5 | 1,634 (+13%) | 22mo | $249,990 | $153 | 51 |
| 306 Picard Loop | 0.21mi | 3/2.5 | 1,634 (+13%) | 21mo | $264,990 | $162 | 50 |
| 304 Picard Loop | 0.21mi | 3/2.5 | 1,634 (+13%) | 22mo | $254,990 | $156 | 50 |
Match score weights: distance 35% · size 25% · config 20% · recency 20%. Top-matched comps best support the ARV.
Projected returns pro-forma
3.47% appreciation · 3.0% rent growth · sell at horizon
- IRR
- 15.8%
- Equity multiple
- 1.92×
- Total profit
- $47,859
- Equity at exit
- $88,155
- IRR
- 17.1%
- Equity multiple
- 3.62×
- Total profit
- $135,828
- Equity at exit
- $139,860
Cash invested: $51,797 (down + closing). Projections, not guarantees.
Landlord ↔ Tenant lean methodology
- Overall (STATE)
- 90 Strongly Landlord-Friendly
- State South Carolina
- 90 Strongly Landlord-Friendly · R+6
- County
- — inherits STATE
- City
- — inherits STATE
ZIP-level market 29142
- Home prices YoY
- 1.8%
- Active inventory
- 154
- Price-to-rent
- 6.8×
Monthly cashflow live
- Estimated rent
- $2,252 medium interval (Pro) →
- Mortgage (P&I)
- −$970
- Tax est. 1.5%
- −$231 /mo · $2,775/yr
- Insurance
- −$77
- HOA
- −$175
- Vacancy / Maint / Mgmt
- −$473
- Net cashflow
- $326
Break-even live
UW: 25.0% down · 7.5% · 30yr · 1.5% tax · 5.0% vac · 8.0% maint · 8.0% mgmt
Financing live
Cash to close
- Down payment
- $46,248
- Closing costs
- $5,550
- Reserves months
- —
- Total cash needed
- —
Loan-product check · same deal, 3 products live
Conventional
25% down · 7.5% · 30yr
- Down + closing
- —
- Monthly P&I
- —
- Monthly cashflow
- —
- DSCR
- —
- Eligible?
- —
Personal DTI + credit; lowest rate.
DSCR
20% down · 8.5% · 30yr
- Down + closing
- —
- Monthly P&I
- —
- Monthly cashflow
- —
- DSCR
- —
- Eligible?
- —
No personal income docs; deal must DSCR.
Hard money
10% down · 12.0% · 12mo
- Down + closing
- —
- Monthly P&I
- —
- Monthly cashflow
- —
- DSCR
- —
- Eligible?
- —
Short-term bridge; refi at stabilization.
Rent comps 3 comps
| Address | Beds | Baths | Sqft | Rent | $/sqft | DOM | Units | Dist |
|---|---|---|---|---|---|---|---|---|
| 764 Striped Bass Ct Santee, SC | 3.0 | 2.0 | 1183 | $2,000 | $1.69 | 23d | 1 | 0.38mi |
| 208 Trillium Ct Santee, SC | 3.0 | 3.0 | 1500 | $2,100 | $1.40 | 23d | 1 | 0.81mi |
| 127 Ballard Ln Santee, SC | 2.0 | 2.0 | 1300 | $2,999 | $2.31 | 23d | 1 | 0.93mi |
HOA detail
- Monthly dues
- $175 · $2,100/yr
Listing history 6 events
-
2026-06-12pricestatusdays on market $184,990 Pending 5 DOM
-
2026-06-09days on market $187,990 Active 4 DOM
-
2026-06-08days on market $187,990 Active 3 DOM
-
2026-06-07days on market $187,990 Active 2 DOM
-
2026-06-07remarks 143-char remark
-
2026-06-07$187,990 Active 1 DOM
ⓘ Source: listings_history table (triggers on properties + properties_extension) + one-shot
backfill from property_details.listing_events for pre-trigger history.
Nearby sold comps map
Loading sold comps map…
Walkable amenities ~0.75 mi
Loading nearby amenities…
Taxation est. · year 1
- Rental income
- $27,027
- − Mortgage interest
- −$10,362
- − Property taxes
- −$2,775
- − Insurance
- −$925
- − Repairs & maintenance
- −$2,162
- − Management
- −$2,162
- − HOA
- −$2,100
- − Depreciation
- −$5,382
- Taxable income
- $1,159
- Est. tax owed @ 24.0%
- −$278
- After-tax cash flow
- $3,632/yr
For passive investors: Depreciation is non-cash, so a rental often shows a tax loss while cash-flowing — sheltering income. Rental losses are passive: they offset passive income freely, and up to $25,000/yr can offset ordinary (W-2) income if you actively participate and your MAGI is under $100k (phasing out to $0 by $150k); unused losses carry forward. On sale, claimed depreciation is recaptured at up to 25%, and gains may owe capital-gains tax (a 1031 exchange can defer both). Figures are a year-1 estimate at your 24.0% rate — not tax advice; consult a CPA.
Condition & rehab AI · 13 photos
This townhouse is in good condition with modern amenities and a well-maintained exterior. It offers a good investment opportunity with potential for value enhancement through minor updates.
Value-add opportunities
- Both Painting the exterior siding — Fresh paint can enhance curb appeal and property value.
- Both Landscaping improvements — Enhanced landscaping can improve curb appeal and attract potential buyers/tenants.
- Both Adding smart home features — Smart home features can increase convenience and appeal to tech-savvy buyers/tenants.
- Both Upgrading the kitchen appliances — Modern appliances can make the kitchen more functional and attractive to potential buyers/tenants.
Renovation cost estimate screening
Value-add ROI direction
- Both Painting the exterior siding — Fresh paint can enhance curb appeal and property value. ↑
- Both Landscaping improvements — Enhanced landscaping can improve curb appeal and attract potential buyers/tenants. ↑
- Both Adding smart home features — Smart home features can increase convenience and appeal to tech-savvy buyers/tenants. ↑
- Both Upgrading the kitchen appliances — Modern appliances can make the kitchen more functional and attractive to potential buyers/tenants. ↑
ⓘ Cost ranges are severity-bucket heuristics (US national rule-of-thumb). Get contractor quotes + a written scope before underwriting a rehab budget.
Schools (NCES district)
No district data.
Livability — Santee
- Score
- 61/100
- State rank
- #202
- US rank
- #17354
Category grades
Schools grade is shown separately in the Schools card above.
Census & demographics
- Census place
- Santee, SC
- Population (ZIP)
- 4,658
Population outlook (Orangeburg County) Hauer SSP2
- Today (2025)
- 82,698 people
- By 2030
- 78,615 · -4.9%
- By 2040
- 69,308 · -16.2%
- By 2050
- 60,629 · -26.7%
- By 2075
- 42,678 · -48.4%
- By 2100
- 28,136 · -66.0%
Race, ethnicity, and origin ACS 2023
- Neighborhood character
- Majority Black (64%)
- Race & ethnicity
- Black 64% White 31% Asian 3% Hispanic / Latino 2%
- Common ancestry
- Lithuanian 2% Romanian 2%
- Foreign-born
- 1%
- Languages at home
- 96% English-only · Other Indo-European 2% Spanish 1%
Political lean MEDSL · Orangeburg
- 2024 margin
- Strong D (+24.6) · D 61.8% · R 37.2% · Other 1.1%
- 2008→2024 swing
- -13.5pp toward R · 2008: 38.1pp · 2024: 24.6pp
- All cycles
- 2024: D+24.6 2020: D+33.2 2016: D+37.0 2012: D+43.5 2008: D+38.1
Not yet ingested
- Civics
- —
Market trends
- HPI YoY
- ▲ 3.47%
- Current HPI
- 193.5623
- Rent YoY
- —
- Metro
- —
- State GDP YoY
- ▲ 4.51%
- F500 in state
- 2
Industry mix (Fortune 500 HQ in SC)
| Industry | F500 HQs | Revenue |
|---|---|---|
| Packaging | 1 | $7B |
|
||
Price history
1 event — show timeline
- 2026-06-05 Listed $187,990 Charleston Trident MLS
Cash-flow waterfall
monthlySold comps — $/sqft
last 12 mo · ≤1 miLoading sold comps…