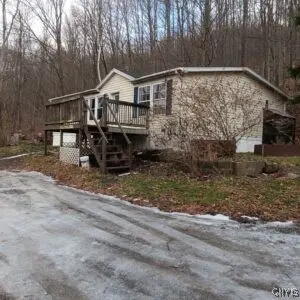
4915 State Route 245 · Naples, NY
Flood risk 1/10 · Minimal
- FEMA flood zone
- X
- Chance of flooding over 30 yrs
- 0.0%
- Est. flood insurance / yr
- $507 – $1,088
Fire risk 4/10 · Minor
- Est. fire insurance / yr
- $691 – $1,283
Heat risk 3/10 · Minor
- Hot days now (above 90°F)
- 8 days/yr
- Hot days in 30 yrs
- 19 days/yr
Wind risk 1/10 · Minimal
- Chance of severe wind over 30 yrs
- —
Air-quality risk 2/10 · Minimal
- Unhealthy air days now
- 0 days/yr
- Unhealthy air days in 30 yrs
- 1 days/yr
Risk factors via First Street. Map © Google.
Why this score? — see what drove the C grade
The composite is a weighted blend of 9 inputs, each scored 0–100. Each bar is that input's sub-score; the figure is the points it added to the 100-point composite (weight × sub-score).
- Cash flow +22.3/30.0
- ARV discount +7.5/15.0
- DSCR +7.1/10.0
- 1% rule +6.0/10.0
- Schools +4.8/10.0
- Livability +3.4/5.0
- Rent growth +2.5/5.0
- Condition / age +2.5/5.0
- Appreciation +0.0/10.0
$124,900
🖨 Deal sheet 📄 Offer letter ✓ Due diligence
Listing remarks MLS
This 3 bedroom two bath doublewide features a master bedroom with full bath, eat-in kitchen, living room, new furnace and interior paint.
Key facts
- New furnace
- Interior paint
- Eat-in kitchen
Tags
Neighborhood map
What this means for you Summary
Snapshot
- This is a 3-bed/2.0-bath manufactured listed at $125k.
Deal economics
- At list price, monthly cash flow is $206 ($2k/yr) — positive.
- The deal already cash-flows at list — no discount required.
- Meets the 1% rule at list price ($1k rent vs $125k).
- Recommended offer: $110k (12.0% below list) — sets the bar for market timing.
- Cap rate 8.3% vs local median 1.1% in Naples — top-decile yield for the area; either an underpriced asset or a hidden risk that comps aren't pricing in. Stress-test before assuming the spread holds.
Location & tenants
- Location reads 67/100 on livability (#608 in NY) — a middle-class / working-renter tenant base. Strengths: cost of living A+, housing A+, health & safety A+; Watch: employment D, crime F, amenities F.
- Naples Central School District (rural): math 51% / reading 61% proficiency, ranked #292 of 590 in NY (top 50%) — acceptable for families but not a draw, mixed tenant base, ~2y average lease.
- Market conditions: 51 active listings in the ZIP; 107 units permitted in Yates County in 2024 (8 in 5+ unit buildings).
Forward outlook
- Local home prices are declining (-3.0%/yr); year-one equity from $864 of loan paydown is wiped out by about $4k of value loss. Plan a longer hold.
- Yates County population projected at -20% by 2050 — secular population decline; favor cash flow + early exit over multi-decade hold.
Negotiation context
- It's been on market 152 days — a 12% lower offer ($110k) is reasonable based on typical stale-listing flexibility.
- Current owner paid $79k; list at $125k implies a 58% gain — meaningful room to come down on a strong offer.
Questions for the listing agent
- It's been on market 152 days. Have you received any prior offers? Is the seller open to a 12% concession, seller financing, or rate buy-down credit?
- Why hasn't it sold? Are there any deal-killer items the seller is aware of (foundation, flood, title, zoning, code violations)?
- Is there a deadline driving the sale (1031 exchange, divorce, estate, relocation)? That informs how much negotiation room exists.
- Schools are B-rated — typically a magnet for longer-tenancy family renters. What's the average tenant stay here, and is there a school-zone premium baked into asking?
- Crime grade is F in this area — have there been break-ins, vandalism, or insurance claims at this property in the last 3 years? What carrier currently insures it and at what premium?
- What's the average days-on-market for RENTAL listings here right now (not sales)? A rising rental-DOM trend means longer vacancies and softer asking-rent achievability than the comps imply.
- What's the recent tenant-quality profile in this submarket — average credit score on applications, eviction rate, late-payment / NSF rate, and stable-employment percentage? A property-management company in the area should have these aggregated.
- How much new for-sale + rental construction is in the pipeline within 1–3 miles? Heavy new supply typically softens prices + rents 12–24 months out; constrained supply supports both.
Investment metrics
- 1% rule
- 1.10% ✓
- Cap rate
- 8.27%
- Cash-on-cash
- 7.07%
- DSCR
- 1.31
- GRM
- 7.6
CMA / ARV
No comps found within radius.
Projected returns pro-forma
-3.0% appreciation · 3.0% rent growth · sell at horizon
- IRR
- -5.4%
- Equity multiple
- 0.80×
- Total profit
- $-7,080
- Equity at exit
- $18,623
- IRR
- 4.2%
- Equity multiple
- 1.31×
- Total profit
- $10,864
- Equity at exit
- $10,799
Cash invested: $34,972 (down + closing). Projections, not guarantees.
Landlord ↔ Tenant lean methodology
- Overall (STATE)
- 15 Strongly Tenant-Friendly
- State New York
- 15 Strongly Tenant-Friendly · D+10
- County
- — inherits STATE
- City
- — inherits STATE
ZIP-level market 14512
- Home prices YoY
- -4.3%
- Active inventory
- 51
- Price-to-rent
- 7.6×
Monthly cashflow live
- Estimated rent
- $1,373 medium interval (Pro) →
- Mortgage (P&I)
- −$655
- Tax from tax record
- −$172 /mo · $2,062/yr
- Insurance
- −$52
- HOA
- −$0
- Vacancy / Maint / Mgmt
- −$288
- Net cashflow
- $206
Break-even live
UW: 25.0% down · 7.5% · 30yr · 1.5% tax · 5.0% vac · 8.0% maint · 8.0% mgmt
Financing live
Cash to close
- Down payment
- $31,225
- Closing costs
- $3,747
- Reserves months
- —
- Total cash needed
- —
Loan-product check · same deal, 3 products live
Conventional
25% down · 7.5% · 30yr
- Down + closing
- —
- Monthly P&I
- —
- Monthly cashflow
- —
- DSCR
- —
- Eligible?
- —
Personal DTI + credit; lowest rate.
DSCR
20% down · 8.5% · 30yr
- Down + closing
- —
- Monthly P&I
- —
- Monthly cashflow
- —
- DSCR
- —
- Eligible?
- —
No personal income docs; deal must DSCR.
Hard money
10% down · 12.0% · 12mo
- Down + closing
- —
- Monthly P&I
- —
- Monthly cashflow
- —
- DSCR
- —
- Eligible?
- —
Short-term bridge; refi at stabilization.
Listing history 19 events
-
2026-06-18days on market $124,900 Active 152 DOM
-
2026-06-17days on market $124,900 Active 151 DOM
-
2026-06-16days on market $124,900 Active 150 DOM
-
2026-06-15days on market $124,900 Active 149 DOM
-
2026-06-13days on market $124,900 Active 147 DOM
-
2026-06-13days on market $124,900 Active 146 DOM
-
2026-06-10days on market $124,900 Active 144 DOM
-
2026-06-09days on market $124,900 Active 143 DOM
-
2026-06-09days on market $124,900 Active 142 DOM
-
2026-06-07days on market $124,900 Active 141 DOM
-
2026-06-03days on market $124,900 Active 137 DOM
-
2026-06-03days on market $124,900 Active 136 DOM
-
2026-06-01days on market $124,900 Active 135 DOM
-
2026-05-31days on market $124,900 Active 134 DOM
-
2026-01-17$124,900 Active 137-char remark
Show marketing remark (137 chars)
This 3 bedroom two bath doublewide features a master bedroom with full bath, eat-in kitchen, living room, new furnace and interior paint.
-
2016-10-27soldstatus $78,852
-
2005-10-05soldstatus $45,000
-
1998-07-07soldstatus $14,000
-
1996-07-01soldstatus $12,000
ⓘ Source: listings_history table (triggers on properties + properties_extension) + one-shot
backfill from property_details.listing_events for pre-trigger history.
Tax reassessment forecast NY · Partial reset (capped growth)
- Current annual tax
- $2,062 · $172/mo
- Projected year-2 tax
- $2,087 · $174/mo
- Expected delta
- +$24/yr (+$2/mo · 1.2%)
ⓘ Screening estimate from a state-policy table — verify with the county assessor before closing.
Climate risk First Street
- Flood 1/10 Low FEMA zone X · 0% chance over 30 yrs
- Wildfire 4/10 Moderate
- Heat 3/10 Moderate 8 d/yr ≥90°F today · 19 d/yr by 30 yrs out
- Wind 1/10 Low
- Air quality 2/10 Low 0 unhealthy d/yr today · 1 by 30 yrs out
Nearby sold comps map
Loading sold comps map…
Walkable amenities ~0.75 mi
Loading nearby amenities…
Taxation est. · year 1
- Rental income
- $16,481
- − Mortgage interest
- −$6,996
- − Property taxes
- −$2,062
- − Insurance
- −$624
- − Repairs & maintenance
- −$1,319
- − Management
- −$1,319
- − Depreciation
- −$3,633
- Taxable income
- $528
- Est. tax owed @ 24.0%
- −$127
- After-tax cash flow
- $2,347/yr
For passive investors: Depreciation is non-cash, so a rental often shows a tax loss while cash-flowing — sheltering income. Rental losses are passive: they offset passive income freely, and up to $25,000/yr can offset ordinary (W-2) income if you actively participate and your MAGI is under $100k (phasing out to $0 by $150k); unused losses carry forward. On sale, claimed depreciation is recaptured at up to 25%, and gains may owe capital-gains tax (a 1031 exchange can defer both). Figures are a year-1 estimate at your 24.0% rate — not tax advice; consult a CPA.
Schools (NCES district)
- District
- Naples Central School District
- NCES district ID
- 3620220
- Math proficiency
- 51% ▼ -10.00%
- Reading proficiency
- 61% ▲ 9.00%
- Median HH income
- $51,934
- Composite
- 47.91/100
- National rank
- #2212
- State rank
- #292 of 590 in NY
Livability — Naples
- Score
- 67/100
- State rank
- #608
- US rank
- #10973
Category grades
Schools grade is shown separately in the Schools card above.
Census & demographics
- Population (ZIP)
- 4,908
Population outlook (Yates County) Hauer SSP2
- Today (2025)
- 23,773 people
- By 2030
- 22,867 · -3.8%
- By 2040
- 20,750 · -12.7%
- By 2050
- 18,917 · -20.4%
- By 2075
- 15,090 · -36.5%
- By 2100
- 11,428 · -51.9%
Race, ethnicity, and origin ACS 2023
- Neighborhood character
- Predominantly White (95%)
- Race & ethnicity
- White 95% Two or more races 3%
- Common ancestry
- Romanian 4% Iranian 3% Lithuanian 2%
- Foreign-born
- 3% · Canada
- Languages at home
- 98% English-only · German/W. Germanic 1% Spanish 1%
Political lean MEDSL · Yates
- 2024 margin
- R (+16.2) · D 41.9% · R 58.1%
- 2008→2024 swing
- -12.5pp toward R · 2008: -3.7pp · 2024: -16.2pp
- All cycles
- 2024: R+16.2 2020: R+18.6 2016: R+21.9 2012: R+3.0 2008: R+3.7
Not yet ingested
- Civics
- —
Market trends
- HPI YoY
- ▼ -13.68%
- Current HPI
- 301.9192
- Rent YoY
- —
- Metro
- —
- State GDP YoY
- ▲ 2.60%
- F500 in state
- 92
Industry mix (Fortune 500 HQ in NY)
| Industry | F500 HQs | Revenue |
|---|---|---|
| Financial Services | 10 | $950B |
|
||
| Consumer Goods | 9 | $162B |
|
||
| Insurance | 4 | $225B |
|
||
| Telecommunications | 2 | $144B |
|
||
| Pharmaceuticals | 2 | $112B |
|
||
| Media / Entertainment | 2 | $69B |
|
||
Price history
+940.8% since first listed5 events — show timeline
- 2026-01-17 Listed $124,900 CNYIS
- 2016-10-27 Sold (Public Records) $78,852 Public Records
- 2005-10-05 Sold (Public Records) $45,000 Public Records
- 1998-07-07 Sold (Public Records) $14,000 Public Records
- 1996-07-01 Sold (Public Records) $12,000 Public Records
Property tax history
-2.9%/yrLatest (2025): $2,062 · -0.6% YoY. Source: county tax records.
Cash-flow waterfall
monthlySold comps — $/sqft
last 12 mo · ≤1 miLoading sold comps…