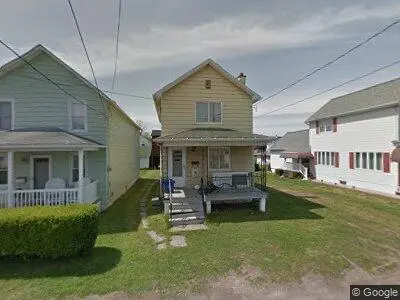
144 Lackawanna Ave · Duryea, PA
Flood risk 9/10 · Severe
- FEMA flood zone
- X
- Chance of flooding over 30 yrs
- 0.99%
- Est. flood insurance / yr
- $507 – $1,088
Fire risk 4/10 · Minor
- Est. fire insurance / yr
- $511 – $949
Heat risk 4/10 · Minor
- Hot days now (above 95°F)
- 7 days/yr
- Hot days in 30 yrs
- 16 days/yr
Wind risk 3/10 · Minor
- Chance of severe wind over 30 yrs
- 4.0%
Air-quality risk 2/10 · Minimal
- Unhealthy air days now
- 0 days/yr
- Unhealthy air days in 30 yrs
- 1 days/yr
Risk factors via First Street. Map © Google.
Why this score? — see what drove the B- grade
The composite is a weighted blend of 9 inputs, each scored 0–100. Each bar is that input's sub-score; the figure is the points it added to the 100-point composite (weight × sub-score).
- Cash flow +25.8/30.0
- ARV discount +15.0/15.0
- DSCR +8.6/10.0
- 1% rule +6.8/10.0
- Livability +3.3/5.0
- Schools +3.0/10.0
- Rent growth +2.5/5.0
- Condition / age +2.5/5.0
- Appreciation +0.0/10.0
$110,000
🖨 Deal sheet (PDF) 📄 Offer letter ✓ Due diligence
Listing remarks
Single family home in need of cosmetic updates. Detached two story garage larger than home itself. Property could be easily divided into two separate properties.
Key facts
- Cosmetic updates
- Listed 30 days
Tags
Neighborhood map
What this means for you Summary
Snapshot
- This is a 2-bed/1.0-bath single-family listed at $110k.
Deal economics
- At list price, monthly cash flow is $200 ($2k/yr) — positive.
- The deal already cash-flows at list — no discount required.
- Meets the 1% rule at list price ($1k rent vs $110k).
- Recommended offer: $108k (1.5% below list) — sets the bar for market timing.
Location & tenants
- Location reads 66/100 on livability (#1,029 in PA) — a middle-class / working-renter tenant base. Strengths: cost of living A+, crime A, housing B+; Watch: amenities F, commute F, health & safety F.
- Pittston Area SD (suburban): math 30% / reading 40% proficiency, ranked #418 of 539 in PA (top 78%) — families likely to look elsewhere, expect single-tenant / working-renter base with shorter leases.
- Zoned schools: Pittston City Intrmd Ctr (math 25% / reading 44%, grade F, #1,049 of 1,518 statewide, top 71%, 648 students, 63% FRL); Pittston Area Ms (math 6% / reading 36%, grade F, #432 of 512 statewide, top 85%, 964 students, 55% FRL); Pittston Area Shs (math 77% / reading 50%, grade B-, #69 of 437 statewide, top 16%, 1,022 students, 44% FRL).
- Market conditions: 20 active listings in the ZIP; 9 comparable units currently listed for rent nearby; rentals at typical pace (median 23d on market — plan ~3-4 weeks tenant-placement turnaround); 44% of comp listings sitting > 30 days — soft ceiling on asking rent; 349 units permitted in Luzerne County in 2024 (16 in 5+ unit buildings).
Forward outlook
- Local home prices are declining (-3.0%/yr); year-one equity from $761 of loan paydown is wiped out by about $3k of value loss. Plan a longer hold.
- Luzerne County population projected at +4% by 2050 — modest demand growth; plan on rents tracking national, not racing it.
Negotiation context
- It's been on market 30 days — a 2% lower offer ($108k) is reasonable based on typical stale-listing flexibility.
Risks & watch-outs
- Watch-outs: flood insurance adds $66/mo; built in 1940 — expect roof / HVAC / electrical / plumbing capex.
- Climate carrying-cost: severe flood risk — expect insurance premiums to compound above CPI over the hold.
Questions for the listing agent
- Built in 1940 — when were the roof, HVAC, electrical panel, plumbing, and water heater last replaced?
- What's the actual annual flood-insurance premium (NFIP or private), and is the property in a SFHA with mandatory coverage?
- Is there a deadline driving the sale (1031 exchange, divorce, estate, relocation)? That informs how much negotiation room exists.
- Schools are D-rated, which usually means shorter tenancies and higher turnover. Who's the typical renter profile here, and what's been the actual vacancy rate?
- What's the average days-on-market for RENTAL listings here right now (not sales)? A rising rental-DOM trend means longer vacancies and softer asking-rent achievability than the comps imply.
- What's the recent tenant-quality profile in this submarket — average credit score on applications, eviction rate, late-payment / NSF rate, and stable-employment percentage? A property-management company in the area should have these aggregated.
- How much new for-sale + rental construction is in the pipeline within 1–3 miles? Heavy new supply typically softens prices + rents 12–24 months out; constrained supply supports both.
Investment metrics
- 1% rule
- 1.18% ✓
- Cap rate
- 9.20%
- Cash-on-cash
- 10.39%
- DSCR
- 1.46
- GRM
- 7.0
CMA / ARV
- ARV (on-the-fly)
- $177,408
- Comps found
- 6
Show comp detail 6 sales within ~0.75 mi
| Address | Dist | Beds/Ba | Sqft | Sold | Price | $/sf | Match |
|---|---|---|---|---|---|---|---|
| 131 Stephenson St | 0.12mi | 2/1.0 | 977 (+9%) | 5mo | $135,000 | $138 | 76 |
| 221 New St | 0.44mi | 3/2.0 (+1) | 936 (+4%) | 1mo | $223,000 | $238 | 62 |
| 192 Evans St | 0.30mi | 2/1.0 | 858 (-4%) | 20mo | $75,000 | $87 | 62 |
| 178 Columbia St | 0.42mi | 2/2.0 | 980 (+9%) | 11mo | $230,175 | $235 | 52 |
| 171 Columbia St | 0.39mi | 3/1.5 (+1) | 960 (+7%) | 21mo | $190,000 | $198 | 46 |
| 706 Donnelly St | 0.55mi | 2/1.0 | 1,016 (+13%) | 16mo | $101,000 | $99 | 39 |
Match score weights: distance 35% · size 25% · config 20% · recency 20%. Top-matched comps best support the ARV.
Projected returns pro-forma
-3.0% appreciation · 3.0% rent growth · sell at horizon
- IRR
- -4.3%
- Equity multiple
- 0.84×
- Total profit
- $-5,011
- Equity at exit
- $16,401
- IRR
- 5.4%
- Equity multiple
- 1.40×
- Total profit
- $12,309
- Equity at exit
- $9,511
Cash invested: $30,800 (down + closing). Projections, not guarantees.
Landlord ↔ Tenant lean methodology
- Overall (STATE)
- 62 Landlord-Friendly
- State Pennsylvania
- 62 Landlord-Friendly · EVEN
- County
- — inherits STATE
- City
- — inherits STATE
ZIP-level market 18642
- Home prices YoY
- -15.5%
- Active inventory
- 20
- Price-to-rent
- 7.0×
Monthly cashflow live
- Estimated rent
- $1,303 high interval (Pro) →
- Mortgage (P&I)
- −$577
- Tax from tax record
- −$140 /mo · $1,683/yr
- Insurance
- −$46
- Flood insurance flood zone
- −$66 /mo · $798/yr
- HOA
- −$0
- Vacancy / Maint / Mgmt
- −$274
- Net cashflow
- $200
Break-even live
Sensitivity live
| Price | -10% $262 | -5% $231 | +0% $200 | +5% $169 | +10% $138 |
|---|---|---|---|---|---|
| Rent | -10% $97 | -5% $149 | +0% $200 | +5% $252 | +10% $303 |
| Rate | -1.0pp $256 | -0.5pp $228 | base $200 | +0.5pp $172 | +1.0pp $143 |
UW: 25.0% down · 7.5% · 30yr · 1.5% tax · 5.0% vac · 8.0% maint · 8.0% mgmt
Financing live
Cash to close
- Down payment
- $27,500
- Closing costs
- $3,300
- Reserves months
- —
- Total cash needed
- —
Loan-product check · same deal, 3 products live
Conventional
25% down · 7.5% · 30yr
- Down + closing
- —
- Monthly P&I
- —
- Monthly cashflow
- —
- DSCR
- —
- Eligible?
- —
Personal DTI + credit; lowest rate.
DSCR
20% down · 8.5% · 30yr
- Down + closing
- —
- Monthly P&I
- —
- Monthly cashflow
- —
- DSCR
- —
- Eligible?
- —
No personal income docs; deal must DSCR.
Hard money
10% down · 12.0% · 12mo
- Down + closing
- —
- Monthly P&I
- —
- Monthly cashflow
- —
- DSCR
- —
- Eligible?
- —
Short-term bridge; refi at stabilization.
Rent comps 9 comps
| Address | Beds | Baths | Sqft | Rent | $/sqft | DOM | Units | Dist |
|---|---|---|---|---|---|---|---|---|
| 127 Dickson St Duryea, PA | 2.0 | 1.0 | 900 | $1,200 | $1.33 | 45d | 1 | 0.19mi |
| 230 Swetland St Duryea, PA | 2.0 | 1.0 | 950 | $1,400 | $1.47 | 15d | 1 | 0.32mi |
| 230 Swetland St Duryea, PA | 2.0 | 1.0 | 1092 | $1,400 | $1.28 | 23d | 1 | 0.32mi |
| 962 Wood St Unit 2 Old Forge, PA | 2.0 | 1.0 | 964 | $1,250 | $1.30 | 45d | 1 | 1.12mi |
| 970 Wood St Old Forge, PA | 2.0 | 1.0 | 768 | $1,300 | $1.69 | 15d | 1 | 1.13mi |
| 33 Chapel St Pittston, PA | 1.0 | 1.0 | 600 | $995 | $1.66 | 45d | 1 | 1.29mi |
| 152 Drakes Ln Old Forge, PA | 2.0 | 1.0 | 979 | $1,700 | $1.74 | 15d | 1 | 1.39mi |
| 864 S Main St #3 Old Forge, PA | 2.0 | 1.0 | 965 | $1,350 | $1.40 | 15d | 1 | 1.42mi |
| 287 Parsonage St Pittston, PA | 2.0 | 1.0 | 850 | $1,200 | $1.41 | 45d | 1 | 1.45mi |
Listing history 16 events
-
2026-06-22days on market $110,000 Active 30 DOM
-
2026-06-18days on market $110,000 Active 27 DOM
-
2026-06-17days on market $110,000 Active 26 DOM
-
2026-06-16days on market $110,000 Active 25 DOM
-
2026-06-15days on market $110,000 Active 24 DOM
-
2026-06-14days on market $110,000 Active 22 DOM
-
2026-06-13days on market $110,000 Active 21 DOM
-
2026-06-10days on market $110,000 Active 19 DOM
-
2026-06-09days on market $110,000 Active 18 DOM
-
2026-06-08days on market $110,000 Active 17 DOM
-
2026-06-07days on market $110,000 Active 16 DOM
-
2026-06-02days on market $110,000 Active 11 DOM
-
2026-06-01days on market $110,000 Active 10 DOM
-
2026-05-31days on market $110,000 Active 9 DOM
-
2026-05-30days on market $110,000 Active 8 DOM
-
2026-05-23$110,000 Active
ⓘ Source: listings_history table (triggers on properties + properties_extension) + one-shot
backfill from property_details.listing_events for pre-trigger history.
Tax reassessment forecast PA · Partial reset (capped growth)
- Current annual tax
- $1,683 · $140/mo
- Projected year-2 tax
- $1,710 · $143/mo
- Expected delta
- +$28/yr (+$2/mo · 1.6%)
ⓘ Screening estimate from a state-policy table — verify with the county assessor before closing.
Climate risk First Street
- Flood 9/10 Extreme FEMA zone X · 99% chance over 30 yrs
- Wildfire 4/10 Moderate
- Heat 4/10 Moderate 7 d/yr ≥95°F today · 16 d/yr by 30 yrs out
- Wind 3/10 Moderate 4% chance of damaging wind over 30 yrs
- Air quality 2/10 Low 0 unhealthy d/yr today · 1 by 30 yrs out
Nearby sold comps map
Loading sold comps map…
Walkable amenities ~0.75 mi
Loading nearby amenities…
Taxation est. · year 1
- Rental income
- $15,639
- − Mortgage interest
- −$6,162
- − Property taxes
- −$1,683
- − Insurance
- −$1,348
- − Repairs & maintenance
- −$1,251
- − Management
- −$1,251
- − Depreciation
- −$3,200
- Taxable income
- $745
- Est. tax owed @ 24.0%
- −$179
- After-tax cash flow
- $2,224/yr
For passive investors: Depreciation is non-cash, so a rental often shows a tax loss while cash-flowing — sheltering income. Rental losses are passive: they offset passive income freely, and up to $25,000/yr can offset ordinary (W-2) income if you actively participate and your MAGI is under $100k (phasing out to $0 by $150k); unused losses carry forward. On sale, claimed depreciation is recaptured at up to 25%, and gains may owe capital-gains tax (a 1031 exchange can defer both). Figures are a year-1 estimate at your 24.0% rate — not tax advice; consult a CPA.
Schools (NCES district)
- District
- Pittston Area SD
- NCES district ID
- 4219200
- Math proficiency
- 30% ▼ -12.00%
- Reading proficiency
- 40% ▼ -19.00%
- Median HH income
- $45,316
- Composite
- 29.86/100
- National rank
- #6409
- State rank
- #418 of 539 in PA
Livability — Duryea
- Score
- 66/100
- State rank
- #1029
- US rank
- #11458
Category grades
Schools grade is shown separately in the Schools card above.
Census & demographics
- Census place
- Duryea, PA
- City population
- 4,469
- Population (ZIP)
- 4,469
Population outlook (Luzerne County) Hauer SSP2
- Today (2025)
- 319,505 people
- By 2030
- 319,943 · +0.1%
- By 2040
- 322,643 · +1.0%
- By 2050
- 330,817 · +3.5%
- By 2075
- 379,145 · +18.7%
- By 2100
- 431,908 · +35.2%
Race, ethnicity, and origin ACS 2023
- Neighborhood character
- Predominantly White (78%)
- Race & ethnicity
- White 78% Hispanic / Latino 21% Two or more races 19%
- Hispanic origin (detail)
- Mexican 16% Puerto Rican 2%
- Common ancestry
- Romanian 20% Scotch-Irish 3% Iranian 2%
- Foreign-born
- 7% · Canada
- Languages at home
- 82% English-only · Spanish 16%
Political lean MEDSL · Luzerne
- 2024 margin
- R (+19.2) · D 40.0% · R 59.2%
- 2008→2024 swing
- -27.6pp toward R · 2008: 8.4pp · 2024: -19.2pp
- All cycles
- 2024: R+19.2 2020: R+14.4 2016: R+19.6 2012: D+4.8 2008: D+8.4
Not yet ingested
- Civics
- —
Market trends
- HPI YoY
- ▼ -34.99%
- Current HPI
- 190.5926
- Rent YoY
- —
- Metro
- —
- State GDP YoY
- ▲ 1.68%
- F500 in state
- 34
Industry mix (Fortune 500 HQ in PA)
| Industry | F500 HQs | Revenue |
|---|---|---|
| Healthcare | 2 | $309B |
|
||
| Insurance | 2 | $27B |
|
||
| Telecommunications / Media | 1 | $124B |
|
||
| Industrial Distribution | 1 | $22B |
|
||
| Financial Services | 1 | $20B |
|
||
| Chemicals / Materials | 1 | $18B |
|
||
Price history
1 event — show timeline
- 2026-05-23 Listed $110,000 FSBO.com
Property tax history
+1.9%/yrLatest (2026): $1,683 · +0.4% YoY. Source: county tax records.
Cash-flow waterfall
monthlySold comps — $/sqft
last 12 mo · ≤1 miLoading sold comps…