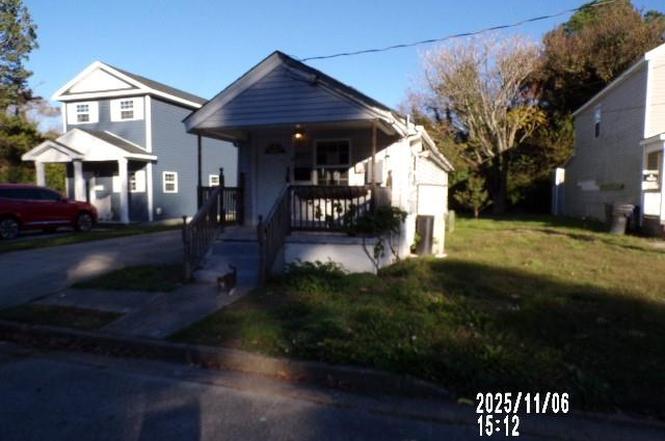
2107 Pearl St · Portsmouth, VA
Flood risk 5/10 · Moderate
- FEMA flood zone
- X (shaded)
- Chance of flooding over 30 yrs
- 0.47%
- Est. flood insurance / yr
- $507 – $1,088
Fire risk 1/10 · Minimal
- Est. fire insurance / yr
- $666 – $1,236
Heat risk 9/10 · Severe
- Hot days now (above 106°F)
- 7 days/yr
- Hot days in 30 yrs
- 16 days/yr
Wind risk 8/10 · Major
- Chance of severe wind over 30 yrs
- 80.0%
Air-quality risk 5/10 · Moderate
- Unhealthy air days now
- 6 days/yr
- Unhealthy air days in 30 yrs
- 7 days/yr
Risk factors via First Street. Map © Google.
Why this score? — see what drove the B- grade
The composite is a weighted blend of 9 inputs, each scored 0–100. Each bar is that input's sub-score; the figure is the points it added to the 100-point composite (weight × sub-score).
- Cash flow +25.4/30.0
- ARV discount +15.0/15.0
- DSCR +8.4/10.0
- 1% rule +6.5/10.0
- Schools +3.9/10.0
- Livability +3.7/5.0
- Rent growth +3.3/5.0
- Condition / age +2.5/5.0
- Appreciation +0.0/10.0
$122,900
🖨 Deal sheet 📄 Offer letter ✓ Due diligence
Listing remarks
PRICE REDUCED-Come see this charming 2 bedroom 2 full bath Bungalow/ Ranch home waiting for you to update and revitalize-located near shopping and main roads. The kitchen is open to eat-in area and living room with electric range, dishwasher and microwave. The primary bedroom is well proportioned with carpeting-the remaining bedroom is also good sized-bathrooms feature tub/shower combinations-the shed is there for extra storage. This property may qualify for Seller Financing (Vendee). If Property was built prior to 1978, Lead Based Paint Potentially Exists.
Key facts
- Bungalow ranch home
- Electric range
- Dishwasher
Tags
Neighborhood map
What this means for you Summary
Snapshot
- This is a 2-bed/2.0-bath single-family listed at $123k.
Deal economics
- At list price, monthly cash flow is $282 ($3k/yr) — positive.
- The deal already cash-flows at list — no discount required.
- Meets the 1% rule at list price ($1k rent vs $123k).
- Recommended offer: $116k (6.0% below list) — sets the bar for market timing.
- Cap rate 9.0% vs local median 4.6% in Portsmouth — top-decile yield for the area; either an underpriced asset or a hidden risk that comps aren't pricing in. Stress-test before assuming the spread holds.
Location & tenants
- Location reads 73/100 on livability (#172 in VA) — a middle-class / working-renter tenant base. Strengths: amenities A+, cost of living A+, housing A+; Watch: employment C-, crime F, commute F.
- Portsmouth City Public School District (urban): math 34% / reading 58% proficiency, ranked #107 of 131 in VA (top 82%) — families likely to look elsewhere, expect single-tenant / working-renter base with shorter leases.
- Zoned schools: Brighton Elementary (math 12% / reading 32%, grade F, #1,069 of 1,108 statewide, top 97%, 411 students, 97% FRL) — zoned schools average 97% FRL vs 60% district-wide (37 pts higher); higher-poverty schools than district average — tighter screening recommended.
- Zoned-school proficiency averages 22% at this address vs 46% district-wide (-24 pts) — the specific schools serving this property underperform the Portsmouth City Public School District average; the district grade overstates school quality for this exact location.
- Market conditions: Rents rising (+3.3%/yr); 131 active listings in the ZIP; 40 comparable units currently listed for rent nearby; rentals at typical pace (median 24d on market — plan ~3-4 weeks tenant-placement turnaround); 300 units permitted in Portsmouth city in 2024 (112 in 5+ unit buildings).
- This rent runs 34% of the median local income ($50k/yr) — at the standard rent-burdened threshold; future hikes will face affordability resistance.
Forward outlook
- Local home prices are declining (-3.0%/yr); year-one equity from $850 of loan paydown is wiped out by about $4k of value loss. Plan a longer hold.
Negotiation context
- It's been on market 81 days — a 6% lower offer ($116k) is reasonable based on typical stale-listing flexibility.
- 4 sale attempts since 10y ago; this cycle's ask has dropped $20k (14%) from the opening price — seller is motivated, your offer sets the floor, not the list.
Risks & watch-outs
- Watch-outs: built in 1939 — expect roof / HVAC / electrical / plumbing capex.
- Climate carrying-cost: moderate flood risk; severe wind risk, 80% chance of damaging wind over 30y; extreme-heat days projected 7→16/yr by 2055 (HVAC capex compounding) — expect insurance premiums to compound above CPI over the hold.
Questions for the listing agent
- It's been on market 81 days. Have you received any prior offers? Is the seller open to a 6% concession, seller financing, or rate buy-down credit?
- Built in 1939 — when were the roof, HVAC, electrical panel, plumbing, and water heater last replaced?
- Why hasn't it sold? Are there any deal-killer items the seller is aware of (foundation, flood, title, zoning, code violations)?
- Is there a deadline driving the sale (1031 exchange, divorce, estate, relocation)? That informs how much negotiation room exists.
- Schools are B-rated — typically a magnet for longer-tenancy family renters. What's the average tenant stay here, and is there a school-zone premium baked into asking?
- Crime grade is F in this area — have there been break-ins, vandalism, or insurance claims at this property in the last 3 years? What carrier currently insures it and at what premium?
- What's the average days-on-market for RENTAL listings here right now (not sales)? A rising rental-DOM trend means longer vacancies and softer asking-rent achievability than the comps imply.
- What's the recent tenant-quality profile in this submarket — average credit score on applications, eviction rate, late-payment / NSF rate, and stable-employment percentage? A property-management company in the area should have these aggregated.
- How much new for-sale + rental construction is in the pipeline within 1–3 miles? Heavy new supply typically softens prices + rents 12–24 months out; constrained supply supports both.
Investment metrics
- 1% rule
- 1.15% ✓
- Cap rate
- 9.04%
- Cash-on-cash
- 9.83%
- DSCR
- 1.44
- GRM
- 7.2
CMA / ARV
- ARV (on-the-fly)
- $165,696
- Comps found
- 12
Show comp detail 12 sales within ~0.75 mi
| Address | Dist | Beds/Ba | Sqft | Sold | Price | $/sf | Match |
|---|---|---|---|---|---|---|---|
| 1211 Fayette St | 0.14mi | 2/1.0 | 881 (+2%) | 10mo | $169,000 | $192 | 78 |
| 1111 Fayette St | 0.06mi | 3/1.0 (+1) | 905 (+5%) | 9mo | $72,000 | $80 | 73 |
| 1200 Fayette St | 0.11mi | 3/1.0 (+1) | 814 (-6%) | 9mo | $133,500 | $164 | 69 |
| 2918 Mulberry St | 0.49mi | 2/1.0 | 884 (+2%) | 3mo | $210,000 | $238 | 67 |
| 1432 Lasalle Ave | 0.37mi | 3/1.5 (+1) | 882 (+2%) | 9mo | $195,600 | $222 | 64 |
| 2220 Camden Ave | 0.17mi | 3/1.0 (+1) | 780 (-10%) | 4mo | $100,000 | $128 | 64 |
| 2016 Parker Ave | 0.26mi | 2/1.0 | 978 (+13%) | 12mo | $98,000 | $100 | 51 |
| 2600 Roanoke Ave | 0.66mi | 3/1.0 (+1) | 900 (+4%) | 2mo | $107,000 | $119 | 51 |
| 1216 Summit Ave | 0.36mi | 2/1.0 | 760 (-12%) | 12mo | $175,000 | $230 | 50 |
| 1921 Nashville Ave | 0.74mi | 2/1.0 | 800 (-7%) | 1mo | $194,000 | $243 | 49 |
| 2200 Deep Creek Blvd | 0.65mi | 2/1.0 | 768 (-11%) | 1mo | $200,000 | $260 | 46 |
| 1536 Centre Ave | 0.55mi | 3/1.5 (+1) | 975 (+13%) | 1mo | $110,000 | $113 | 45 |
Match score weights: distance 35% · size 25% · config 20% · recency 20%. Top-matched comps best support the ARV.
Projected returns pro-forma
-3.0% appreciation · 3.31% rent growth · sell at horizon
- IRR
- -1.2%
- Equity multiple
- 0.96×
- Total profit
- $-1,508
- Equity at exit
- $18,325
- IRR
- 8.9%
- Equity multiple
- 1.69×
- Total profit
- $23,684
- Equity at exit
- $10,626
Cash invested: $34,412 (down + closing). Projections, not guarantees.
Landlord ↔ Tenant lean methodology
- Overall (STATE)
- 55 Moderately Landlord-Leaning
- State Virginia
- 55 Moderately Landlord-Leaning · D+2
- County
- — inherits STATE
- City
- — inherits STATE
ZIP-level market 23704
- Home prices YoY
- -4.6%
- Rents YoY
- 3.3%
- Active inventory
- 131
- Price-to-rent
- 7.2×
Monthly cashflow live
- Estimated rent
- $1,415 high interval (Pro) →
- Mortgage (P&I)
- −$645
- Tax from tax record
- −$140 /mo · $1,683/yr
- Insurance
- −$51
- HOA
- −$0
- Vacancy / Maint / Mgmt
- −$297
- Net cashflow
- $282
Break-even live
UW: 25.0% down · 7.5% · 30yr · 1.5% tax · 5.0% vac · 8.0% maint · 8.0% mgmt
Financing live
Cash to close
- Down payment
- $30,725
- Closing costs
- $3,687
- Reserves months
- —
- Total cash needed
- —
Loan-product check · same deal, 3 products live
Conventional
25% down · 7.5% · 30yr
- Down + closing
- —
- Monthly P&I
- —
- Monthly cashflow
- —
- DSCR
- —
- Eligible?
- —
Personal DTI + credit; lowest rate.
DSCR
20% down · 8.5% · 30yr
- Down + closing
- —
- Monthly P&I
- —
- Monthly cashflow
- —
- DSCR
- —
- Eligible?
- —
No personal income docs; deal must DSCR.
Hard money
10% down · 12.0% · 12mo
- Down + closing
- —
- Monthly P&I
- —
- Monthly cashflow
- —
- DSCR
- —
- Eligible?
- —
Short-term bridge; refi at stabilization.
Rent comps 40 comps
| Address | Beds | Baths | Sqft | Rent | $/sqft | DOM | Units | Dist |
|---|---|---|---|---|---|---|---|---|
| 2007 Elm Ave Portsmouth, VA | 3.0 | 1.0 | 903 | $1,300 | $1.44 | 20d | 1 | 0.07mi |
| 923 Randolph St Portsmouth, VA | 2.0 | 1.0 | 800 | $1,062 | $1.33 | 43d | 1 | 0.26mi |
| 2756 Peach St Portsmouth, VA | 2.0 | 1.5 | 1040 | $1,495 | $1.44 | 23d | 1 | 0.36mi |
| 1915 Lansing Ave Portsmouth, VA | 3.0 | 1.0 | 1085 | $1,675 | $1.54 | 3d | 1 | 0.37mi |
| 1915 Des Moines Ave Portsmouth, VA | 3.0 | 1.0 | 1070 | $1,700 | $1.59 | 23d | 1 | 0.42mi |
| 1915 Des Moines Ave Portsmouth, VA | 3.0 | 1.0 | 1070 | $1,700 | $1.59 | 16d | 1 | 0.42mi |
| 811 Randolph St Unit A Portsmouth, VA | 2.0 | 1.0 | 800 | $1,150 | $1.44 | 43d | 1 | 0.45mi |
| 1416 Richmond Ave Portsmouth, VA | 2.0 | 1.0 | 1024 | $1,150 | $1.12 | 43d | 1 | 0.45mi |
| 2906 Chestnut St Unit 1328007P Portsmouth, VA | 2.0 | 1.0 | 947 | $4,650 | $4.91 | 7d | 1 | 0.47mi |
| 548 Madison St Portsmouth, VA | 1.0 | 1.0 | 750 | $1,249 | $1.67 | 43d | 1 | 0.58mi |
| 548 Madison St Portsmouth, VA | 2.0 | 1.0 | 900 | $1,349 | $1.50 | 16d | 3 | 0.58mi |
| 548 Madison St Unit 54311--D Portsmouth, VA | 1.0 | 1.0 | 750 | $1,249 | $1.67 | 23d | 1 | 0.58mi |
| 548 Madison St Unit 542-21-C Portsmouth, VA | 2.0 | 1.0 | 900 | $1,349 | $1.50 | 23d | 1 | 0.58mi |
| 1029 Green St Portsmouth, VA | 2.0 | 1.5 | 802 | $1,199 | $1.50 | 17d | 1 | 0.65mi |
| 1003 Green St Unit 1003 Portsmouth, VA | 2.0 | 1.5 | 837 | $1,195 | $1.43 | 23d | 1 | 0.65mi |
| 2810 Roanoke Ave Portsmouth, VA | 3.0 | 1.5 | 1100 | $2,100 | $1.91 | 43d | 1 | 0.67mi |
| 915 Green St Portsmouth, VA | 2.0 | 1.0 | 837 | $1,195 | $1.43 | 43d | 1 | 0.70mi |
| 533 Columbia St Portsmouth, VA | 2.0 | 2.0 | 1110 | $1,495 | $1.35 | 43d | 1 | 0.80mi |
| 622 Effingham St Portsmouth, VA | 2.0–3.0 | 1.5–2.0 | 1027 | $507 | $0.49 | 23d | 2 | 0.80mi |
| 531 County St Unit 3 Portsmouth, VA | 1.0 | 1.0 | 725 | $900 | $1.24 | 12d | 1 | 0.84mi |
| 531 County St Unit 3 Portsmouth, VA | 1.0 | 1.0 | 725 | $900 | $1.24 | 7d | 1 | 0.84mi |
| 1100 High St Portsmouth, VA | 2.0–3.0 | 1.5–2.0 | 1003 | $1,010 | $1.01 | 2d | 5 | 0.85mi |
| 714 King St Portsmouth, VA | 2.0 | 2.0 | 935 | $1,899 | $2.03 | 43d | 1 | 0.86mi |
| 714 King St Unit 00 714204 Portsmouth, VA | 1.0 | 1.0 | 670 | $1,499 | $2.24 | 17d | 1 | 0.86mi |
| 710 Dinwiddie St Portsmouth, VA | 1.0 | 1.0 | 850 | $1,150 | $1.35 | 3d | 1 | 0.86mi |
| 605 Dinwiddie St Unit B Portsmouth, VA | 2.0 | 1.0 | 900 | $1,650 | $1.83 | 43d | 1 | 0.92mi |
| 800 Crawford St Portsmouth, VA | 1.0 | 1.0 | 825 | $1,599 | $1.94 | 23d | 1 | 0.95mi |
| 507 High St Portsmouth, VA | 1.0 | 1.0 | 686 | $1,474 | $2.15 | 3d | 1 | 0.95mi |
| 231 Edison Ave Portsmouth, VA | 2.0 | 1.5 | 1100 | $1,275 | $1.16 | 19d | 1 | 0.97mi |
| 231 Edison Ave Unit 231 Portsmouth, VA | 2.0 | 1.5 | 1050 | $1,275 | $1.21 | 10d | 1 | 0.97mi |
| 1140 London Blvd Portsmouth, VA | 2.0 | 2.0 | 1016 | $1,902 | $1.87 | 3d | 1 | 1.01mi |
| 941 Holladay St Portsmouth, VA | 1.0 | 1.0 | 720 | $900 | $1.25 | 43d | 1 | 1.09mi |
| 525 North St #1 Portsmouth, VA | 1.0 | 1.0 | 630 | $1,100 | $1.75 | 43d | 1 | 1.12mi |
| 111 High St #409 Portsmouth, VA | 2.0 | 2.5 | 1078 | $2,500 | $2.32 | 7d | 1 | 1.13mi |
| 412 North St Portsmouth, VA | 2.0 | 1.0 | 850 | $1,415 | $1.66 | 23d | 2 | 1.19mi |
| 3304 Killian Ave Portsmouth, VA | 3.0 | 1.0 | 800 | $2,000 | $2.50 | 23d | 1 | 1.21mi |
| 320 Dinwiddie St Portsmouth, VA | 1.0 | 1.0 | 700 | $1,150 | $1.64 | 23d | 1 | 1.22mi |
| 303 North St #2 Portsmouth, VA | 1.0 | 1.0 | 800 | $1,224 | $1.53 | 14d | 1 | 1.22mi |
| 359 Middle St Portsmouth, VA | 1.0 | 1.0 | 700 | $1,150 | $1.64 | 43d | 1 | 1.23mi |
| 303 Effingham St Unit S-2F Portsmouth, VA | 3.0 | 2.0 | 1122 | $1,950 | $1.74 | 23d | 1 | 1.25mi |
Listing history 14 events
-
2026-02-18status Under Contract
-
2026-02-05price $122,900
-
2026-01-07price $132,900
-
2025-11-28$142,900 Active
-
2023-02-28soldstatus $155,000
-
2023-02-24historical
-
2023-01-22status Under Contract
-
2023-01-04$150,000 Active
-
2017-12-22soldstatus $70,000
-
2017-11-29status Under Contract
-
2017-10-19$70,000 Active
-
2016-04-08status Under Contract
-
2016-03-14price $17,900
-
2016-02-19$19,900 Active
ⓘ Source: listings_history table (triggers on properties + properties_extension) + one-shot
backfill from property_details.listing_events for pre-trigger history.
Tax reassessment forecast VA · Resets to sale price
- Current annual tax
- $1,683 · $140/mo
- Projected year-2 tax
- $1,683 · $140/mo
- Expected delta
- $0/yr ($0/mo · 0.0%)
ⓘ Screening estimate from a state-policy table — verify with the county assessor before closing.
Climate risk First Street
- Flood 5/10 Major FEMA zone X (shaded) · 47% chance over 30 yrs
- Wildfire 1/10 Low
- Heat 9/10 Extreme 7 d/yr ≥106°F today · 16 d/yr by 30 yrs out
- Wind 8/10 Severe 80% chance of damaging wind over 30 yrs
- Air quality 5/10 Major 6 unhealthy d/yr today · 7 by 30 yrs out
Nearby sold comps map
Loading sold comps map…
Walkable amenities ~0.75 mi
Loading nearby amenities…
Taxation est. · year 1
- Rental income
- $16,980
- − Mortgage interest
- −$6,884
- − Property taxes
- −$1,683
- − Insurance
- −$614
- − Repairs & maintenance
- −$1,358
- − Management
- −$1,358
- − Depreciation
- −$3,575
- Taxable income
- $1,506
- Est. tax owed @ 24.0%
- −$361
- After-tax cash flow
- $3,021/yr
For passive investors: Depreciation is non-cash, so a rental often shows a tax loss while cash-flowing — sheltering income. Rental losses are passive: they offset passive income freely, and up to $25,000/yr can offset ordinary (W-2) income if you actively participate and your MAGI is under $100k (phasing out to $0 by $150k); unused losses carry forward. On sale, claimed depreciation is recaptured at up to 25%, and gains may owe capital-gains tax (a 1031 exchange can defer both). Figures are a year-1 estimate at your 24.0% rate — not tax advice; consult a CPA.
Schools (NCES district)
- District
- Portsmouth City Public School District
- NCES district ID
- 5103000
- Math proficiency
- 34% ▼ -40.00%
- Reading proficiency
- 58% ▼ -12.00%
- Median HH income
- $46,152
- Composite
- 39.01/100
- National rank
- #4071
- State rank
- #107 of 131 in VA
Livability — Portsmouth
- Score
- 73/100
- State rank
- #172
- US rank
- #5381
Category grades
Schools grade is shown separately in the Schools card above.
Census & demographics
- Census place
- Portsmouth, VA
- County
- Portsmouth City · 96,366 people
- City population
- 96,366
- Metro
- Virginia Beach-Norfolk-Newport News, VA-NC
- Population (ZIP)
- 19,207
- Household income
- $49,583
- Rent vs Own
- Severe rent burden
- 1727.0
Population outlook (Portsmouth County) Hauer SSP2
- Today (2025)
- 96,730 people
- By 2030
- 96,760 · +0.0%
- By 2040
- 96,573 · -0.2%
- By 2050
- 95,606 · -1.2%
- By 2075
- 93,579 · -3.3%
- By 2100
- 83,756 · -13.4%
Race, ethnicity, and origin ACS 2023
- Neighborhood character
- Predominantly Black (66%)
- Race & ethnicity
- Black 66% White 24% Two or more races 6% Hispanic / Latino 4% Asian 2%
- Common ancestry
- Slovak 1% Romanian 1% Lithuanian 1%
- Foreign-born
- 2% · Canada
- Languages at home
- 96% English-only · Spanish 2%
Political lean MEDSL · Portsmouth
- 2024 margin
- Solid D (+38.6) · D 68.6% · R 30.0% · Other 1.4%
- 2008→2024 swing
- -0.7pp no change · 2008: 39.3pp · 2024: 38.6pp
- All cycles
- 2024: D+38.6 2020: D+40.8 2016: D+36.5 2012: D+39.6 2008: D+39.3
Not yet ingested
- Civics
- —
Market trends
- HPI YoY
- ▼ -15.69%
- Current HPI
- 322.7335
- Rent YoY
- ▲ 3.31%
- Metro
- Virginia Beach-Norfolk-Newport News, VA-NC
- State GDP YoY
- ▲ 2.40%
- F500 in state
- 50
Industry mix (Fortune 500 HQ in VA)
| Industry | F500 HQs | Revenue |
|---|---|---|
| Aerospace / Defense | 4 | $236B |
|
||
| Technology / Defense | 3 | $32B |
|
||
| Financial Services | 2 | $176B |
|
||
| Utilities | 2 | $27B |
|
||
| Insurance | 2 | $25B |
|
||
| Technology | 2 | $15B |
|
||
Price history
+517.6% since first listed14 events — show timeline
- 2026-02-18 Pending — REINMLS
- 2026-02-05 Price Changed $122,900 REINMLS
- 2026-01-07 Price Changed $132,900 REINMLS
- 2025-11-28 Listed $142,900 REINMLS
- 2023-02-28 Sold (Public Records) $155,000 Public Records
- 2023-02-24 Listing Removed — REINMLS
- 2023-01-22 Pending — REINMLS
- 2023-01-04 Listed $150,000 REINMLS
- 2017-12-22 Sold (Public Records) $70,000 Public Records
- 2017-11-29 Pending — REINMLS
- 2017-10-19 Listed $70,000 REINMLS
- 2016-04-08 Pending — REINMLS
- 2016-03-14 Price Changed $17,900 REINMLS
- 2016-02-19 Listed $19,900 REINMLS
Property tax history
+4.0%/yrLatest (2025): $1,683 · +2.1% YoY. Source: county tax records.
Cash-flow waterfall
monthlySold comps — $/sqft
last 12 mo · ≤1 miLoading sold comps…