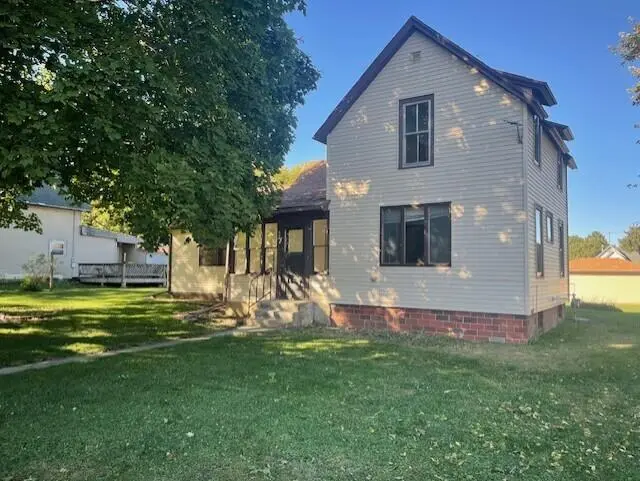
623 E Chestnut St · Hubbard, IA
Flood risk 1/10 · Minimal
- FEMA flood zone
- X (unshaded)
- Chance of flooding over 30 yrs
- 0.0%
- Est. flood insurance / yr
- $473 – $860
Fire risk 1/10 · Minimal
- Est. fire insurance / yr
- $902 – $1,676
Heat risk 3/10 · Minor
- Hot days now (above 102°F)
- 7 days/yr
- Hot days in 30 yrs
- 15 days/yr
Wind risk 2/10 · Minimal
- Chance of severe wind over 30 yrs
- —
Air-quality risk 1/10 · Minimal
- Unhealthy air days now
- 0 days/yr
- Unhealthy air days in 30 yrs
- 0 days/yr
Risk factors via First Street. Map © Google.
Why this score? — see what drove the B- grade
The composite is a weighted blend of 9 inputs, each scored 0–100. Each bar is that input's sub-score; the figure is the points it added to the 100-point composite (weight × sub-score).
- Cash flow +22.4/30.0
- ARV discount +11.9/15.0
- DSCR +7.2/10.0
- Appreciation +6.8/10.0
- Schools +5.7/10.0
- 1% rule +5.3/10.0
- Livability +3.3/5.0
- Rent growth +2.5/5.0
- Condition / age +2.5/5.0
$124,500
🖨 Deal sheet 📄 Offer letter ✓ Due diligence
Listing remarks MLS
Call to see this great home in the friendly town of Hubbard. A perfect place to make a home for your family or income potential as a rental. Newer roof & siding. New heating system in 2026! Appliances stay.
Key facts
- Newer roof
- Newer siding
- Newer heating system
Tags
Neighborhood map
What this means for you Summary
Snapshot
- This is a 4-bed/1.0-bath single-family listed at $124k.
Deal economics
- At list price, monthly cash flow is $207 ($2k/yr) — positive.
- The deal already cash-flows at list — no discount required.
- Meets the 1% rule at list price ($1k rent vs $124k).
- Recommended offer: $110k (12.0% below list) — sets the bar for market timing.
Location & tenants
- Location reads 66/100 on livability (#508 in IA) — a middle-class / working-renter tenant base. Strengths: cost of living A+, housing A+, employment B; Watch: amenities F, commute F, health & safety D-.
- Hubbard-Radcliffe Community School District (rural): math 68% / reading 65% proficiency, ranked #175 of 289 in IA (top 61%) — acceptable for families but not a draw, mixed tenant base, ~2y average lease.
- Market conditions: 15 active listings in the ZIP; 6 units permitted in Hardin County in 2024 (0 in 5+ unit buildings).
Forward outlook
- In year one you build about $5k of equity ($861 loan paydown + $5k appreciation (3.7% local appreciation)).
- Hardin County population projected to shrink 6% by 2050 — rents likely to lag national; underwrite the cash flow, not the appreciation.
- At projected returns (3.7% appreciation + 3.0% rent growth), your $35k cash investment doubles in ~4 years — after that, you're playing with house money.
- By year 7, paydown + projected appreciation supports a ~$35k cash-out refi (75% LTV) — recoverable capital for the next deal without selling this one.
Negotiation context
- It's been on market 210 days — a 12% lower offer ($110k) is reasonable based on typical stale-listing flexibility.
- 2 sale attempts with the ask held roughly flat each time — persistent listings suggest the price (not the market) is what's stuck; bring a comps-based counter.
Risks & watch-outs
- Watch-outs: built in 1900 — expect roof / HVAC / electrical / plumbing capex.
Questions for the listing agent
- It's been on market 210 days. Have you received any prior offers? Is the seller open to a 12% concession, seller financing, or rate buy-down credit?
- Built in 1900 — when were the roof, HVAC, electrical panel, plumbing, and water heater last replaced?
- Why hasn't it sold? Are there any deal-killer items the seller is aware of (foundation, flood, title, zoning, code violations)?
- Is there a deadline driving the sale (1031 exchange, divorce, estate, relocation)? That informs how much negotiation room exists.
- Schools are B-rated — typically a magnet for longer-tenancy family renters. What's the average tenant stay here, and is there a school-zone premium baked into asking?
- What's the average days-on-market for RENTAL listings here right now (not sales)? A rising rental-DOM trend means longer vacancies and softer asking-rent achievability than the comps imply.
- What's the recent tenant-quality profile in this submarket — average credit score on applications, eviction rate, late-payment / NSF rate, and stable-employment percentage? A property-management company in the area should have these aggregated.
- How much new for-sale + rental construction is in the pipeline within 1–3 miles? Heavy new supply typically softens prices + rents 12–24 months out; constrained supply supports both.
Investment metrics
- 1% rule
- 1.03% ✓
- Cap rate
- 8.29%
- Cash-on-cash
- 7.12%
- DSCR
- 1.32
- GRM
- 8.1
CMA / ARV
- ARV (median comp)
- $137,920
- List price
- $124,500
- Delta
- -9.73%
- Verdict
- FAIR
- Comps
- 13 within 1.0 mi
Show comp detail 3 sales within ~0.75 mi
| Address | Dist | Beds/Ba | Sqft | Sold | Price | $/sf | Match |
|---|---|---|---|---|---|---|---|
| 107 N Wisconsin St | 0.39mi | 4/1.0 | 1,296 (-2%) | 0mo | $10,000 | $8 | 78 |
| 301 E Elm St | 0.23mi | 3/1.5 (-1) | 1,290 (-3%) | 22mo | $120,000 | $93 | 59 |
| 213 S Illinois St | 0.22mi | 3/2.5 (-1) | 1,172 (-12%) | 21mo | $132,500 | $113 | 42 |
Match score weights: distance 35% · size 25% · config 20% · recency 20%. Top-matched comps best support the ARV.
Projected returns pro-forma
3.7% appreciation · 3.0% rent growth · sell at horizon
- IRR
- 15.9%
- Equity multiple
- 1.94×
- Total profit
- $32,819
- Equity at exit
- $60,944
- IRR
- 17.0%
- Equity multiple
- 3.66×
- Total profit
- $92,775
- Equity at exit
- $97,979
Cash invested: $34,860 (down + closing). Projections, not guarantees.
Landlord ↔ Tenant lean methodology
- Overall (STATE)
- 83 Strongly Landlord-Friendly
- State Iowa
- 83 Strongly Landlord-Friendly · R+6
- County
- — inherits STATE
- City
- — inherits STATE
ZIP-level market 50122
- Home prices YoY
- 2.3%
- Active inventory
- 15
- Price-to-rent
- 8.1×
Monthly cashflow live
- Estimated rent
- $1,285 medium interval (Pro) →
- Mortgage (P&I)
- −$653
- Tax from tax record
- −$104 /mo · $1,244/yr
- Insurance
- −$52
- HOA
- −$0
- Vacancy / Maint / Mgmt
- −$270
- Net cashflow
- $207
Break-even live
UW: 25.0% down · 7.5% · 30yr · 1.5% tax · 5.0% vac · 8.0% maint · 8.0% mgmt
Financing live
Cash to close
- Down payment
- $31,125
- Closing costs
- $3,735
- Reserves months
- —
- Total cash needed
- —
Loan-product check · same deal, 3 products live
Conventional
25% down · 7.5% · 30yr
- Down + closing
- —
- Monthly P&I
- —
- Monthly cashflow
- —
- DSCR
- —
- Eligible?
- —
Personal DTI + credit; lowest rate.
DSCR
20% down · 8.5% · 30yr
- Down + closing
- —
- Monthly P&I
- —
- Monthly cashflow
- —
- DSCR
- —
- Eligible?
- —
No personal income docs; deal must DSCR.
Hard money
10% down · 12.0% · 12mo
- Down + closing
- —
- Monthly P&I
- —
- Monthly cashflow
- —
- DSCR
- —
- Eligible?
- —
Short-term bridge; refi at stabilization.
Listing history 20 events
-
2026-06-18days on market $124,500 Active 210 DOM
-
2026-06-17days on market $124,500 Active 209 DOM
-
2026-06-16days on market $124,500 Active 208 DOM
-
2026-06-15days on market $124,500 Active 207 DOM
-
2026-06-13days on market $124,500 Active 205 DOM
-
2026-06-12days on market $124,500 Active 204 DOM
-
2026-06-09days on market $124,500 Active 201 DOM
-
2026-06-08days on market $124,500 Active 200 DOM
-
2026-06-07days on market $124,500 Active 199 DOM
-
2026-06-05days on market $124,500 Active 197 DOM
-
2026-06-04days on market $124,500 Active 195 DOM
-
2026-06-02days on market $124,500 Active 194 DOM
-
2026-06-01days on market $124,500 Active 193 DOM
-
2026-05-31days on market $124,500 Active 192 DOM
-
2026-05-31days on market $124,500 Active 191 DOM
-
2026-05-18price $124,500 213-char remark
Show marketing remark (213 chars)
Call to see this great home in the friendly town of Hubbard. A perfect place to make a home for your family or income potential as a rental. Newer roof & siding. New heating system in 2026! Appliances stay.
-
2025-11-20$128,500 Active 213-char remark
Show marketing remark (213 chars)
Call to see this great home in the friendly town of Hubbard. A perfect place to make a home for your family or income potential as a rental. Newer roof & siding. New heating system in 2026! Appliances stay.
-
2025-09-10price $128,500
-
2025-07-29price $135,000
-
2025-06-24$140,000 Active
ⓘ Source: listings_history table (triggers on properties + properties_extension) + one-shot
backfill from property_details.listing_events for pre-trigger history.
Tax reassessment forecast IA · Partial reset (capped growth)
- Current annual tax
- $1,244 · $104/mo
- Projected year-2 tax
- $1,599 · $133/mo
- Expected delta
- +$355/yr (+$30/mo · 28.6%)
ⓘ Screening estimate from a state-policy table — verify with the county assessor before closing.
Climate risk First Street
- Flood 1/10 Low FEMA zone X (unshaded) · 0% chance over 30 yrs
- Wildfire 1/10 Low
- Heat 3/10 Moderate 7 d/yr ≥102°F today · 15 d/yr by 30 yrs out
- Wind 2/10 Low
- Air quality 1/10 Low 0 unhealthy d/yr today · 0 by 30 yrs out
Nearby sold comps map
Loading sold comps map…
Walkable amenities ~0.75 mi
Loading nearby amenities…
Taxation est. · year 1
- Rental income
- $15,420
- − Mortgage interest
- −$6,974
- − Property taxes
- −$1,244
- − Insurance
- −$622
- − Repairs & maintenance
- −$1,234
- − Management
- −$1,234
- − Depreciation
- −$3,622
- Taxable income
- $491
- Est. tax owed @ 24.0%
- −$118
- After-tax cash flow
- $2,363/yr
For passive investors: Depreciation is non-cash, so a rental often shows a tax loss while cash-flowing — sheltering income. Rental losses are passive: they offset passive income freely, and up to $25,000/yr can offset ordinary (W-2) income if you actively participate and your MAGI is under $100k (phasing out to $0 by $150k); unused losses carry forward. On sale, claimed depreciation is recaptured at up to 25%, and gains may owe capital-gains tax (a 1031 exchange can defer both). Figures are a year-1 estimate at your 24.0% rate — not tax advice; consult a CPA.
Schools (NCES district)
- District
- Hubbard-Radcliffe Community School District
- NCES district ID
- 1914310
- Math proficiency
- 68% ▼ -4.00%
- Reading proficiency
- 65% ▼ -2.00%
- Median HH income
- $56,284
- Composite
- 57.09/100
- National rank
- #1103
- State rank
- #175 of 289 in IA
Livability — Hubbard
- Score
- 66/100
- State rank
- #508
- US rank
- #11245
Category grades
Schools grade is shown separately in the Schools card above.
Census & demographics
- Census place
- Hubbard, IA
- City population
- 1,348
- Population (ZIP)
- 1,348
Population outlook (Hardin County) Hauer SSP2
- Today (2025)
- 17,474 people
- By 2030
- 17,369 · -0.6%
- By 2040
- 17,018 · -2.6%
- By 2050
- 16,454 · -5.8%
- By 2075
- 14,665 · -16.1%
- By 2100
- 12,404 · -29.0%
Race, ethnicity, and origin ACS 2023
- Neighborhood character
- Predominantly White (96%)
- Race & ethnicity
- White 96% Hispanic / Latino 3%
- Common ancestry
- Portuguese 14% Italian 1% Iranian 1%
- Foreign-born
- 2% · South Korea, Canada
Political lean MEDSL · Hardin
- 2024 margin
- Solid R (+38.4) · D 30.3% · R 68.7% · Other 1.1%
- 2008→2024 swing
- -39.3pp toward R · 2008: 0.9pp · 2024: -38.4pp
- All cycles
- 2024: R+38.4 2020: R+32.0 2016: R+29.2 2012: R+7.1 2008: D+0.9
Not yet ingested
- Civics
- —
Market trends
- HPI YoY
- ▲ 3.70%
- Current HPI
- 164.9646
- Rent YoY
- —
- Metro
- —
- State GDP YoY
- ▲ 2.48%
- F500 in state
- 4
Industry mix (Fortune 500 HQ in IA)
| Industry | F500 HQs | Revenue |
|---|---|---|
| Financial Services | 1 | $16B |
|
||
| Retail / Convenience | 1 | $15B |
|
||
Price history
-11.1% since first listed5 events — show timeline
- 2026-05-18 Price Changed $124,500 CIBOR
- 2025-11-20 Listed $128,500 CIBOR
- 2025-09-10 Price Changed $128,500 IAR
- 2025-07-29 Price Changed $135,000 IAR
- 2025-06-24 Listed $140,000 IAR
Property tax history
+2.0%/yrLatest (2025): $1,244 · +0.6% YoY. Source: county tax records.
Cash-flow waterfall
monthlySold comps — $/sqft
last 12 mo · ≤1 miLoading sold comps…