8018 Sagramore Rd · Rosedale, MD
Flood risk 1/10 · Minimal
- FEMA flood zone
- X (unshaded)
- Chance of flooding over 30 yrs
- 0.0%
- Est. flood insurance / yr
- $473 – $860
Fire risk 1/10 · Minimal
- Est. fire insurance / yr
- $755 – $1,403
Heat risk 8/10 · Major
- Hot days now (above 103°F)
- 7 days/yr
- Hot days in 30 yrs
- 15 days/yr
Wind risk 6/10 · Moderate
- Chance of severe wind over 30 yrs
- 27.0%
Air-quality risk 5/10 · Moderate
- Unhealthy air days now
- 6 days/yr
- Unhealthy air days in 30 yrs
- 8 days/yr
Risk factors via First Street. Map © Google.
Why this score? — see what drove the B grade
The composite is a weighted blend of 9 inputs, each scored 0–100. Each bar is that input's sub-score; the figure is the points it added to the 100-point composite (weight × sub-score).
- Cash flow +30.0/30.0
- 1% rule +10.0/10.0
- DSCR +10.0/10.0
- ARV discount +7.5/15.0
- Livability +4.0/5.0
- Rent growth +3.7/5.0
- Condition / age +2.5/5.0
- Schools +2.3/10.0
- Appreciation +0.0/10.0
$170,000
🖨 Deal sheet 📄 Offer letter ✓ Due diligence
Listing remarks MLS
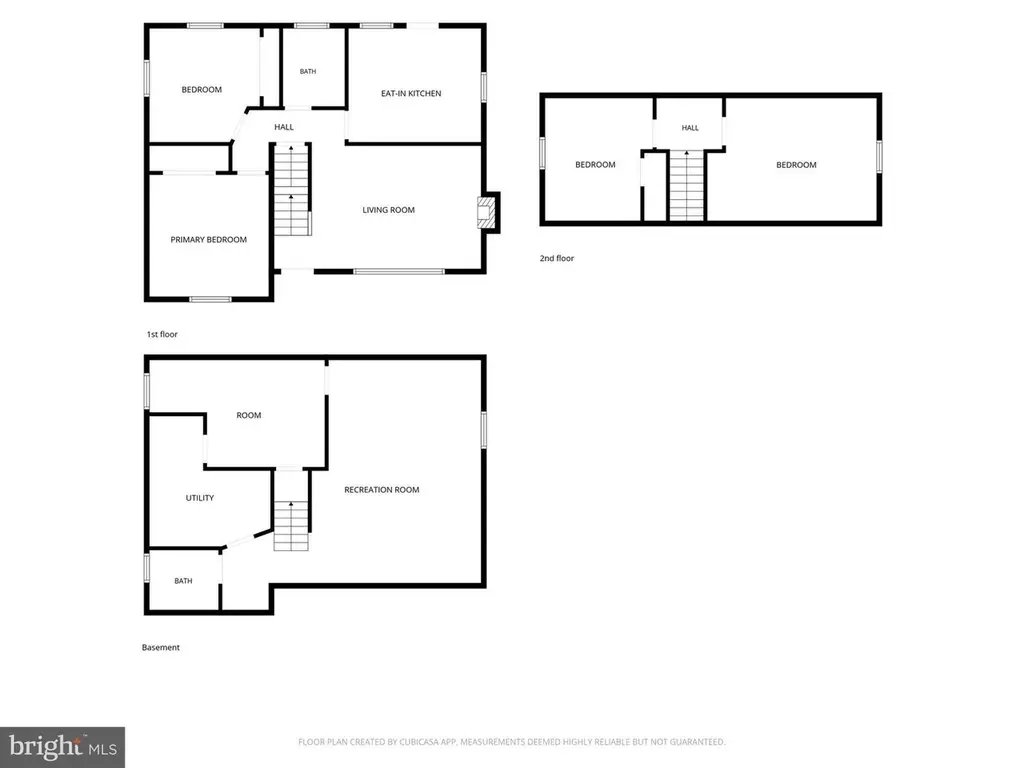
DIRECT ALL QUESTIONS TO ALTERNATE AGENT. Charming Cape Cod home with four bedrooms, two full baths, a driveway, and a finished basement! Energy efficient windows and central AC and furnace were installed around 2011! Come see it today!
Key facts
- 6,490 sq ft lot
- Built 1974
- Listed 7 days
Property features AI
Exterior
- Parking: Driveway; On-street parking
- Utilities: Public water; Public sewer; Electric cooling fuel; Natural gas heating and hot water
- Home design: Detached structure; Brick construction; Composite roof; Permanent foundation; Below-average condition
- Construction: Brick exterior; Composite roof; Permanent foundation; Above-grade and below-grade structures
- Exterior features: Awning(s); Patio(s)
Interior
- Kitchen: Gas range/oven; Refrigerator
- Bedrooms: Two bedrooms on the main level; Two bedrooms on the first upper level
- Bathrooms: One full bathroom (main level); One half bathroom (lower level)
- Heating & cooling: Forced-air heating (natural gas); Central air conditioning (electric); Natural gas hot water
- Interior features: Dry wall ceilings and walls; Living room, family room, and bonus room; One fireplace
- Laundry & utility: Front-loading washer and dryer
Neighborhood map
What this means for you Summary
Snapshot
- This is a 4-bed/1.5-bath single-family listed at $170k.
Deal economics
- At list price, monthly cash flow is $746 ($9k/yr) — positive.
- The deal already cash-flows at list — no discount required.
- Meets the 1% rule at list price ($3k rent vs $170k).
- Cap rate 11.6% vs local median 4.9% in Rosedale — top-decile yield for the area; either an underpriced asset or a hidden risk that comps aren't pricing in. Stress-test before assuming the spread holds.
Location & tenants
- Location reads 81/100 on livability (#37 in MD, #1,338 nationally) — a professional / high-income tenant draw. Strengths: commute A+, housing A+, health & safety A+; Watch: crime F.
- Baltimore County Public Schools (suburban): math 15% / reading 34% proficiency, ranked #11 of 24 in MD (top 46%) — low school quality limits family demand, transient renter base, plan for 1-2y turnover.
- Market conditions: Rents rising fast (+5.0%/yr); 101 active listings in the ZIP; 15 comparable units currently listed for rent nearby; rentals at typical pace (median 24d on market — plan ~3-4 weeks tenant-placement turnaround); 40% of comp listings sitting > 30 days — soft ceiling on asking rent; solid renter incomes; 1,511 units permitted in Baltimore County in 2024 (643 in 5+ unit buildings).
- This rent runs 34% of the median local income ($92k/yr) — at the standard rent-burdened threshold; future hikes will face affordability resistance.
Forward outlook
- Local home prices are declining (-3.0%/yr); year-one equity from $1k of loan paydown is wiped out by about $5k of value loss. Plan a longer hold.
- Baltimore County population projected at +12% by 2050 — modest demand growth; plan on rents tracking national, not racing it.
- At projected returns (-3.0% appreciation + 5.0% rent growth), your $48k cash investment doubles in ~6 years — after that, you're playing with house money.
Negotiation context
- Only 7 days on market — expect competitive offers; lowballing is unlikely to land.
- 3 sale attempts since 24y ago; this cycle's ask has dropped $10k (6%) from the opening price — seller is motivated, your offer sets the floor, not the list.
Risks & watch-outs
- Climate carrying-cost: major wind risk, 27% chance of damaging wind over 30y; extreme-heat days projected 7→15/yr by 2055 (HVAC capex compounding) — expect insurance premiums to compound above CPI over the hold.
Questions for the listing agent
- Built in 1974 — when were the roof, HVAC, electrical panel, plumbing, and water heater last replaced?
- Is there a deadline driving the sale (1031 exchange, divorce, estate, relocation)? That informs how much negotiation room exists.
- Crime grade is F in this area — have there been break-ins, vandalism, or insurance claims at this property in the last 3 years? What carrier currently insures it and at what premium?
- What's the average days-on-market for RENTAL listings here right now (not sales)? A rising rental-DOM trend means longer vacancies and softer asking-rent achievability than the comps imply.
- What's the recent tenant-quality profile in this submarket — average credit score on applications, eviction rate, late-payment / NSF rate, and stable-employment percentage? A property-management company in the area should have these aggregated.
- How much new for-sale + rental construction is in the pipeline within 1–3 miles? Heavy new supply typically softens prices + rents 12–24 months out; constrained supply supports both.
Investment metrics
- 1% rule
- 1.52% ✓
- Cap rate
- 11.56%
- Cash-on-cash
- 18.82%
- DSCR
- 1.84
- GRM
- 5.5
CMA / ARV
- ARV (on-the-fly)
- $346,245
- Comps found
- 12
Show comp detail 12 sales within ~0.75 mi
| Address | Dist | Beds/Ba | Sqft | Sold | Price | $/sf | Match |
|---|---|---|---|---|---|---|---|
| 8007 Sagramore Rd | 0.08mi | 4/1.5 | 1,692 (+0%) | 2mo | $370,000 | $219 | 94 |
| 8029 Neighbors Ave | 0.09mi | 4/2.0 | 1,692 (+0%) | 1mo | $339,000 | $200 | 92 |
| 8020 Neighbors Ave | 0.11mi | 4/2.5 | 1,759 (+4%) | 8mo | $360,000 | $205 | 77 |
| 8022 Neighbors Ave | 0.11mi | 3/2.5 (-1) | 1,576 (-7%) | 6mo | $365,000 | $232 | 69 |
| 7932 Philadelphia Rd | 0.54mi | 4/2.5 | 1,740 (+3%) | 2mo | $360,000 | $207 | 65 |
| 7 Weyhill Ct | 0.49mi | 3/1.5 (-1) | 1,668 (-1%) | 9mo | $330,000 | $198 | 62 |
| 7927 Underhill Rd | 0.38mi | 4/3.0 | 1,745 (+3%) | 10mo | $335,000 | $192 | 62 |
| 8100 Old Philadelphia Rd | 0.49mi | 4/2.5 | 1,868 (+11%) | 6mo | $325,000 | $174 | 50 |
| 5543 Lanham Way | 0.56mi | 5/2.0 (+1) | 1,872 (+11%) | 3mo | $417,500 | $223 | 46 |
| 5617 Daybreak Ter | 0.67mi | 3/2.0 (-1) | 1,572 (-7%) | 10mo | $385,000 | $245 | 42 |
| 1814 Weyburn Rd | 0.74mi | 3/1.5 (-1) | 1,884 (+12%) | 4mo | $265,000 | $141 | 38 |
| 8426 Coco Rd | 0.70mi | 4/3.0 | 1,869 (+11%) | 10mo | $359,900 | $193 | 35 |
Match score weights: distance 35% · size 25% · config 20% · recency 20%. Top-matched comps best support the ARV.
Projected returns pro-forma
-3.0% appreciation · 4.97% rent growth · sell at horizon
- IRR
- 13.0%
- Equity multiple
- 1.53×
- Total profit
- $25,319
- Equity at exit
- $25,348
- IRR
- 23.5%
- Equity multiple
- 3.23×
- Total profit
- $105,985
- Equity at exit
- $14,698
Cash invested: $47,600 (down + closing). Projections, not guarantees.
Landlord ↔ Tenant lean methodology
- Overall (STATE)
- 27 Tenant-Leaning
- State Maryland
- 27 Tenant-Leaning · D+14
- County
- — inherits STATE
- City
- — inherits STATE
ZIP-level market 21237
- Rents YoY
- 5.0%
- Active inventory
- 101
- Price-to-rent
- 5.5×
Monthly cashflow live
- Estimated rent
- $2,579 high interval (Pro) →
- Mortgage (P&I)
- −$891
- Tax from tax record
- −$329 /mo · $3,944/yr
- Insurance
- −$71
- HOA
- −$0
- Vacancy / Maint / Mgmt
- −$542
- Net cashflow
- $746
Break-even live
UW: 25.0% down · 7.5% · 30yr · 1.5% tax · 5.0% vac · 8.0% maint · 8.0% mgmt
Financing live
Cash to close
- Down payment
- $42,500
- Closing costs
- $5,100
- Reserves months
- —
- Total cash needed
- —
Loan-product check · same deal, 3 products live
Conventional
25% down · 7.5% · 30yr
- Down + closing
- —
- Monthly P&I
- —
- Monthly cashflow
- —
- DSCR
- —
- Eligible?
- —
Personal DTI + credit; lowest rate.
DSCR
20% down · 8.5% · 30yr
- Down + closing
- —
- Monthly P&I
- —
- Monthly cashflow
- —
- DSCR
- —
- Eligible?
- —
No personal income docs; deal must DSCR.
Hard money
10% down · 12.0% · 12mo
- Down + closing
- —
- Monthly P&I
- —
- Monthly cashflow
- —
- DSCR
- —
- Eligible?
- —
Short-term bridge; refi at stabilization.
Rent comps 15 comps
| Address | Beds | Baths | Sqft | Rent | $/sqft | DOM | Units | Dist |
|---|---|---|---|---|---|---|---|---|
| 8006 Woodhaven Ct Rosedale, MD | 4.0 | 3.0 | 1680 | $3,200 | $1.90 | 23d | 1 | 0.21mi |
| 8212 Dorset Ave Rosedale, MD | 4.0 | 1.5 | 1479 | $2,250 | $1.52 | 43d | 1 | 0.24mi |
| 1732 Chesaco Ave Rosedale, MD | 3.0 | 1.0 | 1260 | $2,295 | $1.82 | 43d | 1 | 0.29mi |
| 8133 Bartholomew Ct Baltimore, MD | 3.0 | 2.5 | 1600 | $2,700 | $1.69 | 23d | 1 | 0.50mi |
| 2009 Longview Ave Rosedale, MD | 3.0 | 2.0 | 1062 | $2,500 | $2.35 | 14d | 1 | 0.85mi |
| 5248 Darien Rd Baltimore, MD | 3.0 | 1.0 | 1584 | $2,100 | $1.33 | 43d | 1 | 0.93mi |
| 6512 Golden Ring Rd Rosedale, MD | 4.0 | 3.0 | 1089 | $2,800 | $2.57 | 16d | 1 | 0.95mi |
| 5253 Cedgate Rd Unit 1 Baltimore, MD | 3.0 | 1.5 | 1152 | $2,200 | $1.91 | 43d | 1 | 0.96mi |
| 32 Tameron Pl Rosedale, MD | 3.0 | 2.5 | 1720 | $2,300 | $1.34 | 2d | 1 | 1.07mi |
| 5611 Force Rd Baltimore, MD | 3.0 | 1.5 | 1296 | $1,850 | $1.43 | 43d | 1 | 1.22mi |
| 4905 Greencrest Rd Baltimore, MD | 3.0 | 1.5 | 1536 | $1,950 | $1.27 | 43d | 1 | 1.22mi |
| 5313 Todd Ave Baltimore, MD | 3.0 | 1.5 | 1280 | $1,800 | $1.41 | 16d | 1 | 1.25mi |
| 5938 Clayton Ave Baltimore, MD | 4.0 | 2.0 | 1296 | $2,872 | $2.22 | 16d | 1 | 1.30mi |
| 30 Morning Ct Rosedale, MD | 3.0 | 3.5 | 1980 | $3,350 | $1.69 | 17d | 1 | 1.33mi |
| 4924 Frankford Ave Baltimore, MD | 4.0 | 2.0 | 1176 | $2,600 | $2.21 | 23d | 1 | 1.47mi |
Listing history 7 events
-
2026-06-15status $170,000 Pending 7 DOM
-
2026-06-15days on market $170,000 Active 7 DOM
-
2026-06-13days on market $170,000 Active 5 DOM
-
2026-06-09statusdays on market $170,000 Active 1 DOM
-
2026-06-08days on market $170,000 Coming Soon 4 DOM
-
2026-06-07remarks 693-char remark
-
2026-06-07$170,000 Coming Soon 3 DOM
ⓘ Source: listings_history table (triggers on properties + properties_extension) + one-shot
backfill from property_details.listing_events for pre-trigger history.
Tax reassessment forecast MD · Partial reset (capped growth)
- Current annual tax
- $3,944 · $329/mo
- Projected year-2 tax
- $3,944 · $329/mo
- Expected delta
- $0/yr ($0/mo · 0.0%)
ⓘ Screening estimate from a state-policy table — verify with the county assessor before closing.
Climate risk First Street
- Flood 1/10 Low FEMA zone X (unshaded) · 0% chance over 30 yrs
- Wildfire 1/10 Low
- Heat 8/10 Severe 7 d/yr ≥103°F today · 15 d/yr by 30 yrs out
- Wind 6/10 Major 27% chance of damaging wind over 30 yrs
- Air quality 5/10 Major 6 unhealthy d/yr today · 8 by 30 yrs out
Nearby sold comps map
Loading sold comps map…
Walkable amenities ~0.75 mi
Loading nearby amenities…
Taxation est. · year 1
- Rental income
- $30,949
- − Mortgage interest
- −$9,523
- − Property taxes
- −$3,944
- − Insurance
- −$850
- − Repairs & maintenance
- −$2,476
- − Management
- −$2,476
- − Depreciation
- −$4,945
- Taxable income
- $6,735
- Est. tax owed @ 24.0%
- −$1,616
- After-tax cash flow
- $7,341/yr
For passive investors: Depreciation is non-cash, so a rental often shows a tax loss while cash-flowing — sheltering income. Rental losses are passive: they offset passive income freely, and up to $25,000/yr can offset ordinary (W-2) income if you actively participate and your MAGI is under $100k (phasing out to $0 by $150k); unused losses carry forward. On sale, claimed depreciation is recaptured at up to 25%, and gains may owe capital-gains tax (a 1031 exchange can defer both). Figures are a year-1 estimate at your 24.0% rate — not tax advice; consult a CPA.
Schools (NCES district)
- District
- Baltimore County Public Schools
- NCES district ID
- 2400120
- Math proficiency
- 15% ▼ -16.00%
- Reading proficiency
- 34% ▼ -5.00%
- Median HH income
- $66,746
- Composite
- 23.17/100
- National rank
- #7948
- State rank
- #11 of 24 in MD
Livability — Rosedale
- Score
- 81/100
- State rank
- #37
- US rank
- #1338
Category grades
Schools grade is shown separately in the Schools card above.
Census & demographics
- Census place
- Rosedale, MD
- County
- Baltimore County · 769,527 people
- City population
- 30,851
- Metro
- Baltimore-Columbia-Towson, MD
- Population (ZIP)
- 31,425
- Household income
- $91,693
- Rent vs Own
- Severe rent burden
- 887.0
Population outlook (Baltimore County) Hauer SSP2
- Today (2025)
- 885,518 people
- By 2030
- 909,272 · +2.7%
- By 2040
- 951,547 · +7.5%
- By 2050
- 990,955 · +11.9%
- By 2075
- 1,086,411 · +22.7%
- By 2100
- 1,135,078 · +28.2%
Race, ethnicity, and origin ACS 2023
- Neighborhood character
- Diverse neighborhood (Simpson 0.66)
- Race & ethnicity
- White 42% Black 38% Hispanic / Latino 9% Asian 7% Two or more races 5%
- Hispanic origin (detail)
- Mexican 1% Puerto Rican 2% Cuban 1%
- Common ancestry
- Romanian 5% Lithuanian 1% Slovak 1%
- Foreign-born
- 17% · Canada, India, South Korea
- Languages at home
- 78% English-only · Spanish 7% Other Indo-European 4% Tagalog/Filipino 2%
Political lean MEDSL · Baltimore
- 2024 margin
- Strong D (+24.5) · D 61.0% · R 36.5% · Other 2.5%
- 2008→2024 swing
- +9.9pp toward D · 2008: 14.6pp · 2024: 24.5pp
- All cycles
- 2024: D+24.5 2020: D+27.0 2016: D+17.4 2012: D+16.4 2008: D+14.6
Not yet ingested
- Civics
- —
Market trends
- HPI YoY
- ▼ -151.40%
- Current HPI
- 242.8057
- Rent YoY
- ▲ 4.97%
- Metro
- Baltimore-Columbia-Towson, MD
- State GDP YoY
- ▲ 2.97%
- F500 in state
- 12
Industry mix (Fortune 500 HQ in MD)
| Industry | F500 HQs | Revenue |
|---|---|---|
| Aerospace / Defense | 1 | $71B |
|
||
| Utilities | 1 | $25B |
|
||
| Hotels | 1 | $24B |
|
||
| Consumer Goods | 1 | $7B |
|
||
| Real Estate | 1 | $6B |
|
||
| Chemicals | 1 | $2B |
|
||
Price history
+486.2% since first listed14 events — show timeline
- 2026-06-04 Coming Soon $170,000 BRIGHT MLS
- 2018-06-15 Sold (Public Records) $185,000 Public Records
- 2018-05-25 Sold (MLS) $185,000 BRIGHT MLS
- 2018-05-25 Sold (MLS) $185,000 MRIS
- 2018-04-21 Pending — BRIGHT MLS
- 2018-04-21 Pending — MRIS
- 2018-04-02 Listed $179,900 BRIGHT MLS
- 2018-04-02 Listed $179,900 MRIS
- 2003-04-22 Sold (Public Records) $139,900 Public Records
- 2003-03-28 Sold (MLS) $139,900 MRIS
- 2003-02-25 Delisted — MRIS
- 2002-10-17 Listed $139,900 MRIS
- 1989-03-15 Sold (Public Records) $92,500 Public Records
- 1974-06-18 Sold (Public Records) $29,000 Public Records
Property tax history
+4.7%/yrLatest (2025): $3,944 · +7.9% YoY. Source: county tax records.
Cash-flow waterfall
monthlySold comps — $/sqft
last 12 mo · ≤1 miLoading sold comps…