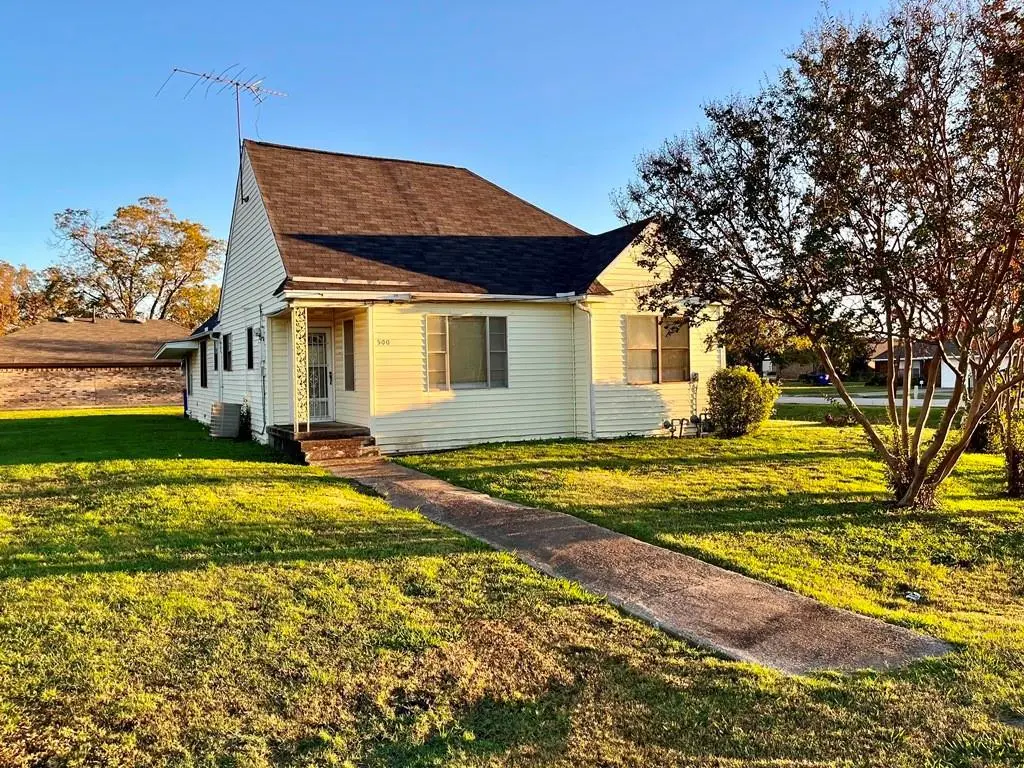
500 Chestnut Trl · Forney, TX
Flood risk 1/10 · Minimal
- FEMA flood zone
- X (unshaded)
- Chance of flooding over 30 yrs
- 0.0%
- Est. flood insurance / yr
- $507 – $1,088
Fire risk 4/10 · Minor
- Est. fire insurance / yr
- $1,222 – $2,270
Heat risk 7/10 · Major
- Hot days now (above 110°F)
- 7 days/yr
- Hot days in 30 yrs
- 24 days/yr
Wind risk 6/10 · Moderate
- Chance of severe wind over 30 yrs
- 27.0%
Air-quality risk 2/10 · Minimal
- Unhealthy air days now
- 1 days/yr
- Unhealthy air days in 30 yrs
- 1 days/yr
Risk factors via First Street. Map © Google.
Why this score? — see what drove the D grade
The composite is a weighted blend of 9 inputs, each scored 0–100. Each bar is that input's sub-score; the figure is the points it added to the 100-point composite (weight × sub-score).
- ARV discount +13.6/15.0
- Cash flow +8.3/30.0
- Schools +4.0/10.0
- 1% rule +3.8/10.0
- Livability +3.8/5.0
- Rent growth +2.9/5.0
- Condition / age +2.5/5.0
- DSCR +2.2/10.0
- Appreciation +0.0/10.0
$249,900
🖨 Deal sheet (PDF) 📄 Offer letter ✓ Due diligence
Listing remarks MLS
New Price Adjustment!!! Wow...this is a unique find with 2 homes on one large corner lot in Forney, Tx at an affordable price!!! The main home features 3 bedrooms, 2 baths, 2 living areas, 2 dining areas, and more. 2nd home is a 2 bed-1 bath and would make a cute guest cottage or small rental unit for extra income. Location between Forney's Charming Historical Downtown area and it's up and coming commercial developments off of Hwy 80, is just icing on the cake. Do not hesitate on this one of a kind opportunity. Both of these homes are awaiting your special touch...View this property today!!!
Key facts
- Large corner lot
- Guest cottage
- 0.36 acre lot
Tags
Neighborhood map
What this means for you Summary
Snapshot
- This is a 3-bed/2.0-bath single-family listed at $250k.
Deal economics
- At list price, monthly cash flow is $-230 ($-3k/yr) — negative.
- To cash-flow at today's rent, offer at most $209k (16.2% below list).
- To meet the 1% rule (rent ≥ 1% of price), the offer needs to be $220k (12.0% below list).
- Recommended offer: $209k (16.2% below list) — sets the bar for cash-flow.
- Cap rate 5.2% vs local median 4.1% in Forney — meaningfully above typical; check what's discounted (condition, days-on-market, listing class) to confirm the premium yield is real.
Location & tenants
- Location reads 76/100 on livability (#98 in TX, #3,339 nationally) — a middle-class / working-renter tenant base. Strengths: crime A+, employment A+, cost of living A+; Watch: amenities C-, commute F.
- Forney ISD (rural): math 41% / reading 44% proficiency, ranked #234 of 826 in TX (top 28%) — families likely to look elsewhere, expect single-tenant / working-renter base with shorter leases.
- Market conditions: Rents rising (+1.4%/yr); 2179 active listings in the ZIP; 37 comparable units currently listed for rent nearby; rentals at typical pace (median 23d on market — plan ~3-4 weeks tenant-placement turnaround); solid renter incomes; 1,747 units permitted in Kaufman County in 2024 (180 in 5+ unit buildings).
Forward outlook
- Local home prices are declining (-3.0%/yr); year-one equity from $2k of loan paydown is wiped out by about $7k of value loss. Plan a longer hold.
- Kaufman County population projected at +43% by 2050 — long-run rental-demand tailwind backs the buy-and-hold thesis.
Negotiation context
- It's been on market 118 days — a 9% lower offer ($227k) is reasonable based on typical stale-listing flexibility.
- 4 sale attempts since 2y ago with the ask held roughly flat each time — persistent listings suggest the price (not the market) is what's stuck; bring a comps-based counter.
Risks & watch-outs
- Watch-outs: property tax is 2.7% of price; built in 1940 — expect roof / HVAC / electrical / plumbing capex.
- Climate carrying-cost: major wind risk, 27% chance of damaging wind over 30y; extreme-heat days projected 7→24/yr by 2055 (HVAC capex compounding) — expect insurance premiums to compound above CPI over the hold.
Questions for the listing agent
- What do current leases actually rent for vs. the listed asking? Can we see a recent rent roll and the last 12 months of T-12 income?
- It's been on market 118 days. Have you received any prior offers? Is the seller open to a 16% concession, seller financing, or rate buy-down credit?
- Built in 1940 — when were the roof, HVAC, electrical panel, plumbing, and water heater last replaced?
- Property tax is high relative to price — has the assessment been appealed recently, and will the sale trigger a re-assessment?
- Why hasn't it sold? Are there any deal-killer items the seller is aware of (foundation, flood, title, zoning, code violations)?
- Is there a deadline driving the sale (1031 exchange, divorce, estate, relocation)? That informs how much negotiation room exists.
- Schools are B-rated — typically a magnet for longer-tenancy family renters. What's the average tenant stay here, and is there a school-zone premium baked into asking?
- The area grade is low — what's the realistic commute time and amenity access for the typical tenant pool here? Any planned neighborhood developments (good or bad) we should know about?
- What's the average days-on-market for RENTAL listings here right now (not sales)? A rising rental-DOM trend means longer vacancies and softer asking-rent achievability than the comps imply.
- What's the recent tenant-quality profile in this submarket — average credit score on applications, eviction rate, late-payment / NSF rate, and stable-employment percentage? A property-management company in the area should have these aggregated.
- How much new for-sale + rental construction is in the pipeline within 1–3 miles? Heavy new supply typically softens prices + rents 12–24 months out; constrained supply supports both.
Investment metrics
- 1% rule
- 0.88% ✗
- Cap rate
- 5.19%
- Cash-on-cash
- -3.94%
- DSCR
- 0.82
- GRM
- 9.5
CMA / ARV
- ARV (median comp)
- $289,131
- List price
- $249,900
- Delta
- -13.57%
- Verdict
- UNDERPRICED
- Comps
- 20 within 1.0 mi
Show comp detail 12 sales within ~0.75 mi
| Address | Dist | Beds/Ba | Sqft | Sold | Price | $/sf | Match |
|---|---|---|---|---|---|---|---|
| 1009 E Buffalo St | 0.15mi | 4/2.0 (+1) | 1,920 (-4%) | 2mo | $299,900 | $156 | 80 |
| 110 Stanford | 0.35mi | 3/2.0 | 1,750 (-12%) | 12mo | $324,900 | $186 | 53 |
| 108 Elmwood Trl | 0.67mi | 4/2.0 (+1) | 1,905 (-5%) | 4mo | $307,000 | $161 | 52 |
| 111 Princeton Cir | 0.58mi | 3/2.0 | 2,168 (+8%) | 9mo | $354,900 | $164 | 52 |
| 308 N Mcgraw St | 0.59mi | 3/3.0 | 1,800 (-10%) | 2mo | $245,000 | $136 | 50 |
| 530 Elm St | 0.42mi | 4/2.0 (+1) | 1,710 (-14%) | 5mo | $319,990 | $187 | 47 |
| 534 Elm St | 0.42mi | 4/2.0 (+1) | 1,710 (-14%) | 5mo | $319,990 | $187 | 47 |
| 302 S Chestnut St | 0.54mi | 3/2.0 | 1,747 (-13%) | 14mo | $280,000 | $160 | 43 |
| 428 N Mcgraw St | 0.62mi | 3/2.5 | 2,281 (+14%) | 6mo | $324,900 | $142 | 41 |
| 103 Villanova Cir | 0.55mi | 3/2.0 | 1,730 (-14%) | 14mo | $319,999 | $185 | 40 |
| 108 Aspenwood Trl | 0.73mi | 4/2.0 (+1) | 2,271 (+14%) | 1mo | $309,900 | $136 | 38 |
| 107 Elmwood Trl | 0.70mi | 4/2.0 (+1) | 1,806 (-10%) | 13mo | $292,500 | $162 | 35 |
Match score weights: distance 35% · size 25% · config 20% · recency 20%. Top-matched comps best support the ARV.
Projected returns pro-forma
-3.0% appreciation · 1.42% rent growth · sell at horizon
- IRR
- -24.9%
- Equity multiple
- 0.17×
- Total profit
- $-58,385
- Equity at exit
- $37,261
- IRR
- -26.9%
- Equity multiple
- -0.18×
- Total profit
- $-82,625
- Equity at exit
- $21,607
Cash invested: $69,972 (down + closing). Projections, not guarantees.
Landlord ↔ Tenant lean methodology
- Overall (STATE)
- 87 Strongly Landlord-Friendly
- State Texas
- 87 Strongly Landlord-Friendly · R+5
- County
- — inherits STATE
- City
- — inherits STATE
ZIP-level market 75126
- Rents YoY
- 1.4%
- Active inventory
- 2179
- Price-to-rent
- 9.5×
Monthly cashflow live
- Estimated rent
- $2,199 high interval (Pro) →
- Mortgage (P&I)
- −$1,311
- Tax from tax record
- −$552 /mo · $6,625/yr
- Insurance
- −$104
- HOA
- −$0
- Vacancy / Maint / Mgmt
- −$462
- Net cashflow
- $-230
Break-even live
Sensitivity live
| Price | -10% $-88 | -5% $-159 | +0% $-230 | +5% $-300 | +10% $-371 |
|---|---|---|---|---|---|
| Rent | -10% $-403 | -5% $-317 | +0% $-230 | +5% $-143 | +10% $-56 |
| Rate | -1.0pp $-104 | -0.5pp $-166 | base $-230 | +0.5pp $-294 | +1.0pp $-360 |
UW: 25.0% down · 7.5% · 30yr · 1.5% tax · 5.0% vac · 8.0% maint · 8.0% mgmt
Financing live
Cash to close
- Down payment
- $62,475
- Closing costs
- $7,497
- Reserves months
- —
- Total cash needed
- —
Loan-product check · same deal, 3 products live
Conventional
25% down · 7.5% · 30yr
- Down + closing
- —
- Monthly P&I
- —
- Monthly cashflow
- —
- DSCR
- —
- Eligible?
- —
Personal DTI + credit; lowest rate.
DSCR
20% down · 8.5% · 30yr
- Down + closing
- —
- Monthly P&I
- —
- Monthly cashflow
- —
- DSCR
- —
- Eligible?
- —
No personal income docs; deal must DSCR.
Hard money
10% down · 12.0% · 12mo
- Down + closing
- —
- Monthly P&I
- —
- Monthly cashflow
- —
- DSCR
- —
- Eligible?
- —
Short-term bridge; refi at stabilization.
Rent comps 37 comps
| Address | Beds | Baths | Sqft | Rent | $/sqft | DOM | Units | Dist |
|---|---|---|---|---|---|---|---|---|
| 300 Stanford Forney, TX | 3.0 | 2.0 | 1714 | $1,999 | $1.17 | 3d | 1 | 0.29mi |
| 124 Stanford Forney, TX | 3.0 | 2.0 | 1488 | $1,800 | $1.21 | 7d | 1 | 0.33mi |
| 304 Burgett St Forney, TX | 3.0 | 2.0 | 1417 | $1,595 | $1.13 | 44d | 1 | 0.55mi |
| 121 Princeton Cir Forney, TX | 3.0 | 2.0 | 1604 | $2,095 | $1.31 | 12d | 1 | 0.57mi |
| 321 S Chestnut St Forney, TX | 4.0 | 2.0 | 1831 | $2,150 | $1.17 | 25d | 1 | 0.61mi |
| 102 Galloping Trl Forney, TX | 3.0 | 2.0 | 1663 | $1,999 | $1.20 | 7d | 1 | 0.89mi |
| 113 Galloping Trl Forney, TX | 3.0 | 2.0 | 1482 | $1,769 | $1.19 | 17d | 1 | 0.93mi |
| 105 Fieldwood Ct Forney, TX | 3.0 | 2.0 | 1820 | $2,400 | $1.32 | 21d | 1 | 0.94mi |
| 308 Southlake Dr Forney, TX | 3.0 | 2.0 | 1491 | $1,965 | $1.32 | 3d | 1 | 1.00mi |
| 106 Painted Trl Forney, TX | 4.0 | 2.5 | 2926 | $2,395 | $0.82 | 44d | 1 | 1.01mi |
| 106 Painted Trl Forney, TX | 4.0 | 2.0 | 2926 | $2,725 | $0.93 | 13d | 1 | 1.01mi |
| 413 Driftwood Ct Forney, TX | 3.0 | 2.0 | 1733 | $1,999 | $1.15 | 11d | 1 | 1.05mi |
| 413 Driftwood Ct Forney, TX | 3.0 | 2.0 | 1733 | $2,000 | $1.15 | 15d | 1 | 1.05mi |
| 293 Arbury Dr Forney, TX | 4.0 | 3.5 | 2928 | $2,590 | $0.88 | 7d | 1 | 1.07mi |
| 293 Arbury Dr Forney, TX | 4.0 | 3.5 | 2928 | $2,801 | $0.96 | 25d | 1 | 1.07mi |
| 611 Orchard Ln Forney, TX | 4.0 | 2.0 | 1540 | $2,000 | $1.30 | 22d | 1 | 1.08mi |
| 308 Chinaberry Trl Forney, TX | 3.0 | 2.0 | 1772 | $1,950 | $1.10 | 44d | 1 | 1.09mi |
| 315 Forestwood Dr Forney, TX | 4.0 | 2.0 | 2102 | $2,085 | $0.99 | 25d | 1 | 1.10mi |
| 203 Spruce Trl Forney, TX | 4.0 | 2.5 | 2934 | $2,350 | $0.80 | 44d | 1 | 1.10mi |
| 110 Meadow Ct Forney, TX | 3.0 | 2.0 | 1840 | $1,795 | $0.98 | 13d | 1 | 1.11mi |
| 511 Brazos St Forney, TX | 3.0 | 2.0 | 1570 | $1,945 | $1.24 | 7d | 1 | 1.12mi |
| 315 Red Oak Ct Forney, TX | 3.0 | 2.0 | 1927 | $2,100 | $1.09 | 44d | 1 | 1.13mi |
| 404 Woodcrest Way Forney, TX | 3.0 | 2.0 | 1434 | $1,900 | $1.32 | 44d | 1 | 1.17mi |
| 501 Branch St Forney, TX | 3.0 | 2.0 | 2130 | $2,320 | $1.09 | 5d | 1 | 1.18mi |
| 236 Pennridge Dr Forney, TX | 3.0 | 2.0 | 1871 | $2,295 | $1.23 | 25d | 1 | 1.19mi |
| 2201 Woodberry Dr Forney, TX | 3.0 | 2.0 | 1839 | $2,050 | $1.11 | 44d | 1 | 1.24mi |
| 2105 Cardinal Dr Forney, TX | 4.0 | 2.0 | 1763 | $2,200 | $1.25 | 22d | 1 | 1.26mi |
| 108 Antler Trl Forney, TX | 4.0 | 2.0 | 2250 | $2,449 | $1.09 | 25d | 1 | 1.26mi |
| 413 Redbud Dr Unit NA Forney, TX | 3.0 | 2.0 | 1671 | $2,200 | $1.32 | 44d | 1 | 1.30mi |
| 213 Long Prairie Dr Forney, TX | 4.0 | 2.5 | 1964 | $2,025 | $1.03 | 17d | 1 | 1.32mi |
| 236 Archer Way Forney, TX | 3.0 | 2.0 | 2016 | $2,300 | $1.14 | 19d | 1 | 1.37mi |
| 107 Huckleberry Rd Forney, TX | 4.0 | 2.5 | 2186 | $2,900 | $1.33 | 44d | 1 | 1.40mi |
| 502 Ponderosa Dr Forney, TX | 3.0 | 2.0 | 2131 | $2,170 | $1.02 | 13d | 1 | 1.41mi |
| 616 Carl C Senter St Forney, TX | 4.0 | 2.0 | 1507 | $1,950 | $1.29 | 44d | 1 | 1.42mi |
| 114 Cole St Forney, TX | 4.0 | 3.0 | 2603 | $2,529 | $0.97 | 22d | 1 | 1.45mi |
| 511 Rosewood Ln Forney, TX | 4.0 | 2.0 | 1900 | $2,070 | $1.09 | 22d | 1 | 1.47mi |
| 2127 Pecan Ridge Dr Forney, TX | 3.0 | 2.0 | 2113 | $2,100 | $0.99 | 44d | 1 | 1.48mi |
Listing history 11 events
-
2026-05-11status Pending 604-char remark
Show marketing remark (604 chars)
New Price Adjustment!!! Wow...this is a unique find with 2 homes on one large corner lot in Forney, Tx at an affordable price!!! The main home features 3 bedrooms, 2 baths, 2 living areas, 2 dining areas, and more. 2nd home is a 2 bed-1 bath and would make a cute guest cottage or small rental unit for extra income. Location between Forney's Charming Historical Downtown area and it's up and coming commercial developments off of Hwy 80, is just icing on the cake. Do not hesitate on this one of a kind opportunity. Both of these homes are awaiting your special touch...View this property today!!!
-
2026-04-02status Active 604-char remark
Show marketing remark (604 chars)
New Price Adjustment!!! Wow...this is a unique find with 2 homes on one large corner lot in Forney, Tx at an affordable price!!! The main home features 3 bedrooms, 2 baths, 2 living areas, 2 dining areas, and more. 2nd home is a 2 bed-1 bath and would make a cute guest cottage or small rental unit for extra income. Location between Forney's Charming Historical Downtown area and it's up and coming commercial developments off of Hwy 80, is just icing on the cake. Do not hesitate on this one of a kind opportunity. Both of these homes are awaiting your special touch...View this property today!!!
-
2026-03-31historical 604-char remark
Show marketing remark (604 chars)
New Price Adjustment!!! Wow...this is a unique find with 2 homes on one large corner lot in Forney, Tx at an affordable price!!! The main home features 3 bedrooms, 2 baths, 2 living areas, 2 dining areas, and more. 2nd home is a 2 bed-1 bath and would make a cute guest cottage or small rental unit for extra income. Location between Forney's Charming Historical Downtown area and it's up and coming commercial developments off of Hwy 80, is just icing on the cake. Do not hesitate on this one of a kind opportunity. Both of these homes are awaiting your special touch...View this property today!!!
-
2026-01-22historical Active Option Contract 604-char remark
Show marketing remark (604 chars)
New Price Adjustment!!! Wow...this is a unique find with 2 homes on one large corner lot in Forney, Tx at an affordable price!!! The main home features 3 bedrooms, 2 baths, 2 living areas, 2 dining areas, and more. 2nd home is a 2 bed-1 bath and would make a cute guest cottage or small rental unit for extra income. Location between Forney's Charming Historical Downtown area and it's up and coming commercial developments off of Hwy 80, is just icing on the cake. Do not hesitate on this one of a kind opportunity. Both of these homes are awaiting your special touch...View this property today!!!
-
2026-01-12$249,900 Active 604-char remark
Show marketing remark (604 chars)
New Price Adjustment!!! Wow...this is a unique find with 2 homes on one large corner lot in Forney, Tx at an affordable price!!! The main home features 3 bedrooms, 2 baths, 2 living areas, 2 dining areas, and more. 2nd home is a 2 bed-1 bath and would make a cute guest cottage or small rental unit for extra income. Location between Forney's Charming Historical Downtown area and it's up and coming commercial developments off of Hwy 80, is just icing on the cake. Do not hesitate on this one of a kind opportunity. Both of these homes are awaiting your special touch...View this property today!!!
-
2025-12-31historical
-
2025-08-06price $249,900
-
2025-05-15price $260,000
-
2025-02-27$289,900 Active
-
2025-02-18historical
-
2024-11-19$299,900 Active
ⓘ Source: listings_history table (triggers on properties + properties_extension) + one-shot
backfill from property_details.listing_events for pre-trigger history.
Tax reassessment forecast TX · Resets to sale price
- Current annual tax
- $6,625 · $552/mo
- Projected year-2 tax
- $6,625 · $552/mo
- Expected delta
- $0/yr ($0/mo · 0.0%)
ⓘ Screening estimate from a state-policy table — verify with the county assessor before closing.
Climate risk First Street
- Flood 1/10 Low FEMA zone X (unshaded) · 0% chance over 30 yrs
- Wildfire 4/10 Moderate
- Heat 7/10 Severe 7 d/yr ≥110°F today · 24 d/yr by 30 yrs out
- Wind 6/10 Major 27% chance of damaging wind over 30 yrs
- Air quality 2/10 Low 1 unhealthy d/yr today · 1 by 30 yrs out
Nearby sold comps map
Loading sold comps map…
Walkable amenities ~0.75 mi
Loading nearby amenities…
Taxation est. · year 1
- Rental income
- $26,385
- − Mortgage interest
- −$13,998
- − Property taxes
- −$6,625
- − Insurance
- −$1,250
- − Repairs & maintenance
- −$2,111
- − Management
- −$2,111
- − Depreciation
- −$7,270
- Taxable loss
- −$6,979
- Est. tax savings @ 24.0%
- +$1,675
- After-tax cash flow
- $-1,081/yr
For passive investors: Depreciation is non-cash, so a rental often shows a tax loss while cash-flowing — sheltering income. Rental losses are passive: they offset passive income freely, and up to $25,000/yr can offset ordinary (W-2) income if you actively participate and your MAGI is under $100k (phasing out to $0 by $150k); unused losses carry forward. On sale, claimed depreciation is recaptured at up to 25%, and gains may owe capital-gains tax (a 1031 exchange can defer both). Figures are a year-1 estimate at your 24.0% rate — not tax advice; consult a CPA.
Schools (NCES district)
- District
- Forney ISD
- NCES district ID
- 4819560
- Math proficiency
- 41% ▼ -20.00%
- Reading proficiency
- 44% ▼ -12.00%
- Median HH income
- $86,679
- Composite
- 40.07/100
- National rank
- #3812
- State rank
- #234 of 826 in TX
Livability — Forney
- Score
- 76/100
- State rank
- #98
- US rank
- #3339
Category grades
Schools grade is shown separately in the Schools card above.
Census & demographics
- Census place
- Forney, TX
- County
- Kaufman County · 122,338 people
- City population
- 84,799
- Metro
- Dallas-Fort Worth-Arlington, TX
- Population (ZIP)
- 84,799
- Household income
- $103,673
- Rent vs Own
- Severe rent burden
- 1306.0
Population outlook (Kaufman County) Hauer SSP2
- Today (2025)
- 138,716 people
- By 2030
- 150,815 · +8.7%
- By 2040
- 174,877 · +26.1%
- By 2050
- 198,020 · +42.8%
- By 2075
- 251,908 · +81.6%
- By 2100
- 285,325 · +105.7%
Race, ethnicity, and origin ACS 2023
- Neighborhood character
- Diverse neighborhood (Simpson 0.68)
- Race & ethnicity
- White 45% Black 25% Hispanic / Latino 23% Two or more races 14% Asian 3%
- Hispanic origin (detail)
- Mexican 18% Puerto Rican 1%
- Common ancestry
- Italian 2% Slovak 1% Portuguese 1%
- Foreign-born
- 12% · Canada, Vietnam
- Languages at home
- 79% English-only · Spanish 14% Arabic 1% Vietnamese 1%
Political lean MEDSL · Kaufman
- 2024 margin
- Strong R (+27.9) · D 35.6% · R 63.5%
- 2008→2024 swing
- +7.9pp toward D · 2008: -35.8pp · 2024: -27.9pp
- All cycles
- 2024: R+27.9 2020: R+33.9 2016: R+47.0 2012: R+44.4 2008: R+35.8
Not yet ingested
- Civics
- —
Market trends
- HPI YoY
- ▼ -102.93%
- Current HPI
- 148.5749
- Rent YoY
- ▲ 1.42%
- Metro
- Dallas-Fort Worth-Arlington, TX
- State GDP YoY
- ▲ 3.95%
- F500 in state
- 110
Industry mix (Fortune 500 HQ in TX)
| Industry | F500 HQs | Revenue |
|---|---|---|
| Energy | 16 | $1,198B |
|
||
| Technology | 5 | $198B |
|
||
| Engineering / Construction | 4 | $72B |
|
||
| Energy Services | 3 | $60B |
|
||
| Utilities | 3 | $41B |
|
||
| Healthcare | 2 | $330B |
|
||
Price history
-16.7% since first listed11 events — show timeline
- 2026-05-11 Pending — NTREIS
- 2026-04-02 Relisted — NTREIS
- 2026-03-31 Listing Removed — NTREIS
- 2026-01-22 Contingent — NTREIS
- 2026-01-12 Listed $249,900 NTREIS
- 2025-12-31 Listing Removed — NTREIS
- 2025-08-06 Price Changed $249,900 NTREIS
- 2025-05-15 Price Changed $260,000 NTREIS
- 2025-02-27 Listed $289,900 NTREIS
- 2025-02-18 Listing Removed — NTREIS
- 2024-11-19 Listed $299,900 NTREIS
Property tax history
+6.8%/yrLatest (2025): $6,625 · +9.1% YoY. Source: county tax records.
Cash-flow waterfall
monthlySold comps — $/sqft
last 12 mo · ≤1 miLoading sold comps…