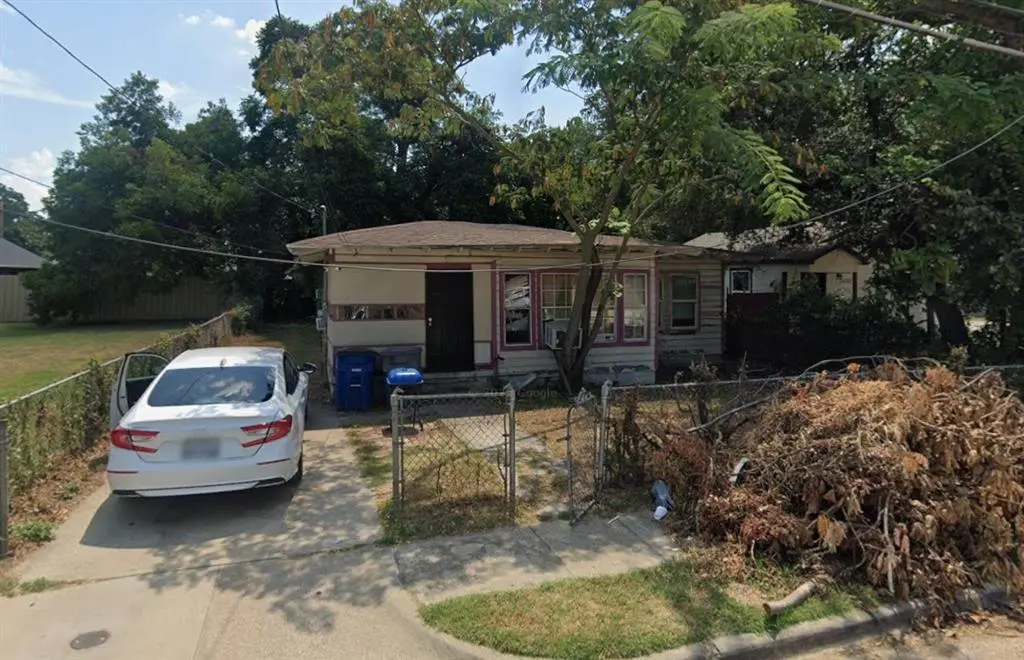
2406 Bethurum Ave · Dallas, TX
Flood risk 7/10 · Major
- FEMA flood zone
- X
- Chance of flooding over 30 yrs
- 0.99%
- Est. flood insurance / yr
- $507 – $1,088
Fire risk 3/10 · Minor
- Est. fire insurance / yr
- $1,222 – $2,270
Heat risk 7/10 · Major
- Hot days now (above 110°F)
- 7 days/yr
- Hot days in 30 yrs
- 24 days/yr
Wind risk 6/10 · Moderate
- Chance of severe wind over 30 yrs
- 27.0%
Air-quality risk 2/10 · Minimal
- Unhealthy air days now
- 1 days/yr
- Unhealthy air days in 30 yrs
- 2 days/yr
Risk factors via First Street. Map © Google.
Why this score? — see what drove the B+ grade
The composite is a weighted blend of 9 inputs, each scored 0–100. Each bar is that input's sub-score; the figure is the points it added to the 100-point composite (weight × sub-score).
- Cash flow +26.8/30.0
- ARV discount +15.0/15.0
- DSCR +9.2/10.0
- 1% rule +7.8/10.0
- Appreciation +5.4/10.0
- Rent growth +4.3/5.0
- Livability +4.0/5.0
- Schools +2.8/10.0
- Condition / age +2.5/5.0
$145,000
🖨 Deal sheet 📄 Offer letter ✓ Due diligence
Listing remarks MLS
Calling all investors, builders, and visionaries! This property at 2406 Bethurum Drive presents an incredible opportunity in one of Dallas’ fastest-evolving neighborhoods. Situated just minutes from Downtown Dallas and the Fair Park entertainment district, this area is undergoing a strong resurgence — with older homes being replaced by sleek, modern new builds at all price points. The existing structure is in distressed condition and will likely make the most sense as a tear-down, but savvy investors may also see potential in a fix-and-flip project. The true value here lies in the land and unbeatable location, surrounded by ongoing redevelopment and rising property values. Whether you’re looking to build your dream home in the heart of the city or add a high-performing investment to your portfolio, this property offers a rare chance to be part of the area’s exciting transformation.
Key facts
- Distressed condition
- Tear-down
- Fix-and-flip project
Tags
Neighborhood map
What this means for you Summary
Snapshot
- This is a 3-bed/1.0-bath single-family listed at $145k.
Deal economics
- At list price, monthly cash flow is $329 ($4k/yr) — positive.
- The deal already cash-flows at list — no discount required.
- Meets the 1% rule at list price ($2k rent vs $145k).
- Recommended offer: $128k (12.0% below list) — sets the bar for market timing.
- Cap rate 9.6% vs local median 2.3% in Dallas — top-decile yield for the area; either an underpriced asset or a hidden risk that comps aren't pricing in. Stress-test before assuming the spread holds.
Location & tenants
- Location reads 81/100 on livability (#24 in TX, #1,380 nationally) — a professional / high-income tenant draw. Strengths: amenities A+, commute A+, housing A+; Watch: schools C-, crime F.
- Dallas ISD (urban): math 31% / reading 36% proficiency, ranked #559 of 826 in TX (top 68%) — families likely to look elsewhere, expect single-tenant / working-renter base with shorter leases; 83% free/reduced lunch — lower-income household profile, screen leases tightly.
- Market conditions: Rents rising fast (+7.2%/yr); 248 active listings in the ZIP; 31 comparable units currently listed for rent nearby; rentals at typical pace (median 21d on market — plan ~3-4 weeks tenant-placement turnaround); 12,577 units permitted in Dallas County in 2024 (6,829 in 5+ unit buildings).
- At $1,857/mo this rent would consume 49% of the median local household income ($46k/yr) (locally 1464% of renters already pay >50% of income on rent) — very limited rent-growth headroom before tenants either downsize or default.
Forward outlook
- In year one you build about $2k of equity ($1k loan paydown + $1k appreciation (0.8% local appreciation)).
- Dallas County population projected at +35% by 2050 — long-run rental-demand tailwind backs the buy-and-hold thesis.
- At projected returns (0.8% appreciation + 7.2% rent growth), your $41k cash investment doubles in ~5 years — after that, you're playing with house money.
Negotiation context
- It's been on market 200 days — a 12% lower offer ($128k) is reasonable based on typical stale-listing flexibility.
Risks & watch-outs
- Watch-outs: flood insurance adds $66/mo; built in 1916 — expect roof / HVAC / electrical / plumbing capex.
- Climate carrying-cost: major flood risk; major wind risk, 27% chance of damaging wind over 30y; extreme-heat days projected 7→24/yr by 2055 (HVAC capex compounding) — expect insurance premiums to compound above CPI over the hold.
Questions for the listing agent
- It's been on market 200 days. Have you received any prior offers? Is the seller open to a 12% concession, seller financing, or rate buy-down credit?
- Built in 1916 — when were the roof, HVAC, electrical panel, plumbing, and water heater last replaced?
- What's the actual annual flood-insurance premium (NFIP or private), and is the property in a SFHA with mandatory coverage?
- Why hasn't it sold? Are there any deal-killer items the seller is aware of (foundation, flood, title, zoning, code violations)?
- Is there a deadline driving the sale (1031 exchange, divorce, estate, relocation)? That informs how much negotiation room exists.
- Crime grade is F in this area — have there been break-ins, vandalism, or insurance claims at this property in the last 3 years? What carrier currently insures it and at what premium?
- What's the average days-on-market for RENTAL listings here right now (not sales)? A rising rental-DOM trend means longer vacancies and softer asking-rent achievability than the comps imply.
- What's the recent tenant-quality profile in this submarket — average credit score on applications, eviction rate, late-payment / NSF rate, and stable-employment percentage? A property-management company in the area should have these aggregated.
- How much new for-sale + rental construction is in the pipeline within 1–3 miles? Heavy new supply typically softens prices + rents 12–24 months out; constrained supply supports both.
Investment metrics
- 1% rule
- 1.28% ✓
- Cap rate
- 9.57%
- Cash-on-cash
- 11.69%
- DSCR
- 1.52
- GRM
- 6.5
CMA / ARV
- ARV (median comp)
- $232,358
- List price
- $145,000
- Delta
- -37.60%
- Verdict
- UNDERPRICED
- Comps
- 20 within 1.0 mi
Show comp detail 12 sales within ~0.75 mi
| Address | Dist | Beds/Ba | Sqft | Sold | Price | $/sf | Match |
|---|---|---|---|---|---|---|---|
| 2807 Silkwood St | 0.34mi | 3/3.0 | 1,200 (+3%) | 1mo | $248,000 | $207 | 70 |
| 2526 Bethurum Ave | 0.09mi | 3/2.0 | 1,292 (+11%) | 4mo | $250,000 | $193 | 70 |
| 2515 Hooper St | 0.32mi | 3/2.5 | 1,225 (+5%) | 7mo | $249,000 | $203 | 64 |
| 2719 Starks Ave | 0.54mi | 3/2.0 | 1,143 (-2%) | 5mo | $279,900 | $245 | 64 |
| 2415 Hooper St | 0.23mi | 2/2.0 (-1) | 1,050 (-10%) | 4mo | $239,900 | $228 | 61 |
| 2411 Hooper St | 0.23mi | 2/2.0 (-1) | 1,050 (-10%) | 5mo | $239,900 | $228 | 60 |
| 2413 Hooper St | 0.23mi | 2/2.0 (-1) | 1,050 (-10%) | 5mo | $239,900 | $228 | 60 |
| 2714 Stephenson Dr | 0.55mi | 3/2.5 | 1,225 (+5%) | 1mo | $210,000 | $171 | 59 |
| 2417 Hooper St | 0.24mi | 2/2.0 (-1) | 1,050 (-10%) | 5mo | $239,900 | $228 | 59 |
| 2714 Silkwood St | 0.31mi | 3/2.0 | 1,311 (+13%) | 4mo | $230,000 | $175 | 57 |
| 2404 Garden Dr | 0.43mi | 4/2.5 (+1) | 1,270 (+9%) | 6mo | $224,500 | $177 | 49 |
| 2402 Garden Dr | 0.43mi | 4/2.5 (+1) | 1,270 (+9%) | 6mo | $255,500 | $201 | 48 |
Match score weights: distance 35% · size 25% · config 20% · recency 20%. Top-matched comps best support the ARV.
Projected returns pro-forma
0.79% appreciation · 7.19% rent growth · sell at horizon
- IRR
- 14.4%
- Equity multiple
- 1.75×
- Total profit
- $30,441
- Equity at exit
- $47,916
- IRR
- 21.0%
- Equity multiple
- 3.85×
- Total profit
- $115,847
- Equity at exit
- $62,469
Cash invested: $40,600 (down + closing). Projections, not guarantees.
Landlord ↔ Tenant lean methodology
- Overall (STATE)
- 87 Strongly Landlord-Friendly
- State Texas
- 87 Strongly Landlord-Friendly · R+5
- County
- — inherits STATE
- City
- — inherits STATE
ZIP-level market 75215
- Home prices YoY
- 0.3%
- Rents YoY
- 7.2%
- Active inventory
- 248
- Price-to-rent
- 6.5×
Monthly cashflow live
- Estimated rent
- $1,857 high interval (Pro) →
- Mortgage (P&I)
- −$760
- Tax from tax record
- −$251 /mo · $3,006/yr
- Insurance
- −$60
- Flood insurance flood zone
- −$66 /mo · $798/yr
- HOA
- −$0
- Vacancy / Maint / Mgmt
- −$390
- Net cashflow
- $329
Break-even live
UW: 25.0% down · 7.5% · 30yr · 1.5% tax · 5.0% vac · 8.0% maint · 8.0% mgmt
Financing live
Cash to close
- Down payment
- $36,250
- Closing costs
- $4,350
- Reserves months
- —
- Total cash needed
- —
Loan-product check · same deal, 3 products live
Conventional
25% down · 7.5% · 30yr
- Down + closing
- —
- Monthly P&I
- —
- Monthly cashflow
- —
- DSCR
- —
- Eligible?
- —
Personal DTI + credit; lowest rate.
DSCR
20% down · 8.5% · 30yr
- Down + closing
- —
- Monthly P&I
- —
- Monthly cashflow
- —
- DSCR
- —
- Eligible?
- —
No personal income docs; deal must DSCR.
Hard money
10% down · 12.0% · 12mo
- Down + closing
- —
- Monthly P&I
- —
- Monthly cashflow
- —
- DSCR
- —
- Eligible?
- —
Short-term bridge; refi at stabilization.
Rent comps 31 comps
| Address | Beds | Baths | Sqft | Rent | $/sqft | DOM | Units | Dist |
|---|---|---|---|---|---|---|---|---|
| 2207 Anderson St Dallas, TX | 3.0 | 2.5 | 1419 | $2,300 | $1.62 | 7d | 1 | 0.14mi |
| 2203 Anderson St Dallas, TX | 3.0 | 2.5 | 1219 | $2,200 | $1.80 | 43d | 1 | 0.14mi |
| 2216 Dyson St Dallas, TX | 3.0 | 2.0 | 1056 | $2,100 | $1.99 | 24d | 1 | 0.16mi |
| 2807 Valentine St Dallas, TX | 3.0 | 2.0 | 1400 | $1,500 | $1.07 | 14d | 1 | 0.29mi |
| 2642 Anderson St Dallas, TX | 2.0 | 1.0 | 820 | $1,150 | $1.40 | 24d | 1 | 0.33mi |
| 2927 Dorris St Dallas, TX | 3.0 | 2.0 | 1298 | $1,914 | $1.47 | 43d | 1 | 0.38mi |
| 2727 Choice St Dallas, TX | 3.0 | 2.0 | 1175 | $1,799 | $1.53 | 24d | 1 | 0.56mi |
| 5000 Linder Ave Dallas, TX | 3.0 | 2.0 | 1327 | $1,950 | $1.47 | 43d | 1 | 0.61mi |
| 2561 Elsie Faye Heggins St Dallas, TX | 3.0 | 2.0 | 876 | $1,390 | $1.59 | 6d | 1 | 0.67mi |
| 2563 Elsie Faye Heggins St Dallas, TX | 3.0 | 2.0 | 876 | $1,240 | $1.42 | 15d | 1 | 0.67mi |
| 2603 Elsie Faye Heggins St Dallas, TX | 3.0 | 2.0 | 876 | $1,385 | $1.58 | 43d | 1 | 0.68mi |
| 2513 Southland St Dallas, TX | 2.0 | 1.0 | 1010 | $1,299 | $1.29 | 2d | 1 | 0.69mi |
| 2513 Southland St Dallas, TX | 2.0 | 1.0 | 1010 | $1,399 | $1.39 | 20d | 1 | 0.69mi |
| 2615 Elsie Faye Heggins St Dallas, TX | 3.0 | 2.0 | 876 | $1,280 | $1.46 | 15d | 1 | 0.69mi |
| 2627 Elsie Faye Heggins St Dallas, TX | 3.0 | 2.0 | 876 | $1,280 | $1.46 | 43d | 1 | 0.70mi |
| 2838 Frost Ave Dallas, TX | 2.0 | 1.0 | 1200 | $1,400 | $1.17 | 24d | 1 | 0.75mi |
| 2829 Oakdale St Dallas, TX | 3.0 | 2.0 | 1028 | $1,840 | $1.79 | 7d | 1 | 0.77mi |
| 2840 Oakdale St Dallas, TX | 3.0 | 2.0 | 1379 | $1,900 | $1.38 | 43d | 1 | 0.79mi |
| 1628 Poplar St Dallas, TX | 2.0 | 1.0 | 903 | $1,400 | $1.55 | 43d | 1 | 0.93mi |
| 1630 Poplar St Dallas, TX | 2.0 | 1.0 | 903 | $1,400 | $1.55 | 24d | 1 | 0.94mi |
| 4722 Meadow St Dallas, TX | 2.0–3.0 | 2.0 | 1107 | $1,475 | $1.33 | 11d | 4 | 1.06mi |
| 4024 Myrtle St Dallas, TX | 3.0 | 2.0 | 1106 | $1,595 | $1.44 | 4d | 1 | 1.08mi |
| 4611 Bradshaw St Dallas, TX | 3.0 | 2.0 | 1145 | $1,550 | $1.35 | 24d | 1 | 1.23mi |
| 4503 Bradshaw St Dallas, TX | 4.0 | 2.0 | 1263 | $1,600 | $1.27 | 7d | 1 | 1.27mi |
| 3711 Guaranty St Dallas, TX | 3.0 | 1.0 | 984 | $1,800 | $1.83 | 14d | 1 | 1.34mi |
| 2822 McDermott Ave Dallas, TX | 3.0 | 2.0 | 1200 | $1,795 | $1.50 | 24d | 1 | 1.36mi |
| 3609 Cleveland St Dallas, TX | 4.0 | 2.5 | 1500 | $2,700 | $1.80 | 7d | 1 | 1.39mi |
| 3526 Elsie Faye Heggins St Dallas, TX | 3.0 | 2.0 | 1113 | $1,795 | $1.61 | 7d | 1 | 1.42mi |
| 3526 Elsie Faye Heggins St Dallas, TX | 3.0 | 2.0 | 1113 | $1,795 | $1.61 | 24d | 1 | 1.42mi |
| 3501 Latimer St Dallas, TX | 2.0 | 1.0 | 1008 | $1,095 | $1.09 | 2d | 1 | 1.48mi |
| 3627 Sidney St Dallas, TX | 3.0 | 2.0 | 1090 | $1,614 | $1.48 | 6d | 1 | 1.48mi |
Listing history 4 events
-
2026-05-31days on market $145,000 Active 200 DOM
-
2025-11-12$145,000 Active 918-char remark
Show marketing remark (918 chars)
Calling all investors, builders, and visionaries! This property at 2406 Bethurum Drive presents an incredible opportunity in one of Dallas’ fastest-evolving neighborhoods. Situated just minutes from Downtown Dallas and the Fair Park entertainment district, this area is undergoing a strong resurgence — with older homes being replaced by sleek, modern new builds at all price points. The existing structure is in distressed condition and will likely make the most sense as a tear-down, but savvy investors may also see potential in a fix-and-flip project. The true value here lies in the land and unbeatable location, surrounded by ongoing redevelopment and rising property values. Whether you’re looking to build your dream home in the heart of the city or add a high-performing investment to your portfolio, this property offers a rare chance to be part of the area’s exciting transformation.
-
2000-09-29soldstatus
-
1997-11-26soldstatus
ⓘ Source: listings_history table (triggers on properties + properties_extension) + one-shot
backfill from property_details.listing_events for pre-trigger history.
Tax reassessment forecast TX · Resets to sale price
- Current annual tax
- $3,006 · $251/mo
- Projected year-2 tax
- $3,006 · $251/mo
- Expected delta
- $0/yr ($0/mo · 0.0%)
ⓘ Screening estimate from a state-policy table — verify with the county assessor before closing.
Climate risk First Street
- Flood 7/10 Severe FEMA zone X · 99% chance over 30 yrs
- Wildfire 3/10 Moderate
- Heat 7/10 Severe 7 d/yr ≥110°F today · 24 d/yr by 30 yrs out
- Wind 6/10 Major 27% chance of damaging wind over 30 yrs
- Air quality 2/10 Low 1 unhealthy d/yr today · 2 by 30 yrs out
Nearby sold comps map
Loading sold comps map…
Walkable amenities ~0.75 mi
Loading nearby amenities…
Taxation est. · year 1
- Rental income
- $22,279
- − Mortgage interest
- −$8,122
- − Property taxes
- −$3,006
- − Insurance
- −$1,522
- − Repairs & maintenance
- −$1,782
- − Management
- −$1,782
- − Depreciation
- −$4,218
- Taxable income
- $1,846
- Est. tax owed @ 24.0%
- −$443
- After-tax cash flow
- $3,504/yr
For passive investors: Depreciation is non-cash, so a rental often shows a tax loss while cash-flowing — sheltering income. Rental losses are passive: they offset passive income freely, and up to $25,000/yr can offset ordinary (W-2) income if you actively participate and your MAGI is under $100k (phasing out to $0 by $150k); unused losses carry forward. On sale, claimed depreciation is recaptured at up to 25%, and gains may owe capital-gains tax (a 1031 exchange can defer both). Figures are a year-1 estimate at your 24.0% rate — not tax advice; consult a CPA.
Schools (NCES district)
- District
- Dallas ISD
- NCES district ID
- 4816230
- Math proficiency
- 31% ▼ -16.00%
- Reading proficiency
- 36% ▼ -4.00%
- Median HH income
- $42,881
- Composite
- 28.41/100
- National rank
- #6763
- State rank
- #559 of 826 in TX
Livability — Dallas
- Score
- 81/100
- State rank
- #24
- US rank
- #1380
Category grades
Schools grade is shown separately in the Schools card above.
Census & demographics
- Census place
- Dallas, TX
- County
- Dallas County · 2,612,404 people
- City population
- 1,168,437
- Metro
- Dallas-Fort Worth-Arlington, TX
- Population (ZIP)
- 18,895
- Household income
- $45,557
- Rent vs Own
- Severe rent burden
- 1464.0
Population outlook (Dallas County) Hauer SSP2
- Today (2025)
- 2,979,839 people
- By 2030
- 3,191,823 · +7.1%
- By 2040
- 3,619,611 · +21.5%
- By 2050
- 4,026,915 · +35.1%
- By 2075
- 4,957,073 · +66.4%
- By 2100
- 5,508,725 · +84.9%
Race, ethnicity, and origin ACS 2023
- Neighborhood character
- Diverse neighborhood (Simpson 0.58)
- Race & ethnicity
- Black 59% Hispanic / Latino 25% White 11% Two or more races 10%
- Hispanic origin (detail)
- Mexican 21%
- Common ancestry
- Italian 1% Hispanic 1%
- Foreign-born
- 16% · Canada
- Languages at home
- 74% English-only · Spanish 26%
Political lean MEDSL · Dallas
- 2024 margin
- Strong D (+22.2) · D 60.2% · R 38.0% · Other 1.8%
- 2008→2024 swing
- +6.9pp toward D · 2008: 15.3pp · 2024: 22.2pp
- All cycles
- 2024: D+22.2 2020: D+31.6 2016: D+26.2 2012: D+15.4 2008: D+15.3
Not yet ingested
- Civics
- —
Market trends
- HPI YoY
- ▲ 0.79%
- Current HPI
- 224.2955
- Rent YoY
- ▲ 7.19%
- Metro
- Dallas-Fort Worth-Arlington, TX
- State GDP YoY
- ▲ 3.95%
- F500 in state
- 110
Industry mix (Fortune 500 HQ in TX)
| Industry | F500 HQs | Revenue |
|---|---|---|
| Energy | 16 | $1,198B |
|
||
| Technology | 5 | $198B |
|
||
| Engineering / Construction | 4 | $72B |
|
||
| Energy Services | 3 | $60B |
|
||
| Utilities | 3 | $41B |
|
||
| Healthcare | 2 | $330B |
|
||
Price history
3 events — show timeline
- 2025-11-12 Listed $145,000 NTREIS
- 2000-09-29 Sold (Public Records) — Public Records
- 1997-11-26 Sold (Public Records) — Public Records
Property tax history
+9.5%/yrLatest (2025): $3,006 · +4.5% YoY. Source: county tax records.
Cash-flow waterfall
monthlySold comps — $/sqft
last 12 mo · ≤1 miLoading sold comps…