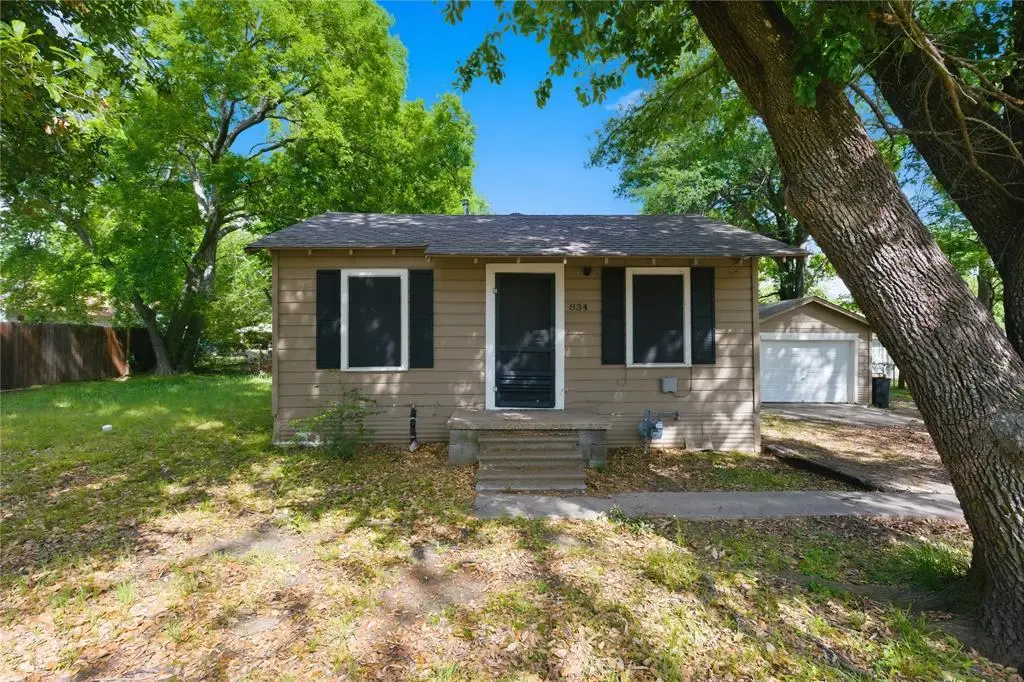
834 Brinker St · Sulphur Springs, TX
Flood risk 1/10 · Minimal
- FEMA flood zone
- X (unshaded)
- Chance of flooding over 30 yrs
- 0.0%
- Est. flood insurance / yr
- $507 – $1,088
Fire risk 4/10 · Minor
- Est. fire insurance / yr
- $1,222 – $2,270
Heat risk 6/10 · Moderate
- Hot days now (above 110°F)
- 6 days/yr
- Hot days in 30 yrs
- 19 days/yr
Wind risk 6/10 · Moderate
- Chance of severe wind over 30 yrs
- 27.0%
Air-quality risk 2/10 · Minimal
- Unhealthy air days now
- 0 days/yr
- Unhealthy air days in 30 yrs
- 1 days/yr
Risk factors via First Street. Map © Google.
Why this score? — see what drove the D grade
The composite is a weighted blend of 9 inputs, each scored 0–100. Each bar is that input's sub-score; the figure is the points it added to the 100-point composite (weight × sub-score).
- Cash flow +19.5/30.0
- DSCR +6.2/10.0
- 1% rule +5.0/10.0
- Schools +3.6/10.0
- Livability +3.5/5.0
- Rent growth +2.5/5.0
- Condition / age +2.5/5.0
- ARV discount +0.0/15.0
- Appreciation +0.0/10.0
$135,000
🖨 Deal sheet (PDF) 📄 Offer letter ✓ Due diligence
Listing remarks MLS
Charming and move-in ready, this updated 2-bedroom, 1-bath home offers a functional layout with modern finishes and a comfortable feel throughout. Featuring durable flooring, fresh neutral tones, and an abundance of natural light, the interior creates a bright and inviting atmosphere. The kitchen provides ample cabinet space and updated countertops, making it both practical and stylish. The bathroom has been refreshed with a clean, simple design for everyday convenience. Situated on a spacious lot with mature trees, the exterior offers plenty of room for outdoor enjoyment, gardening, or future improvements. With approximately 696 square feet of living space and a layout that maximizes functionality, this home is a great option for a variety of buyers. Conveniently located near local shopping, dining, and community amenities, this property offers small-town charm with easy access to everything Sulphur Springs has to offer.
Key facts
- Community amenities
- Outdoor enjoyment
- Updated countertops
Tags
Neighborhood map
What this means for you Summary
Snapshot
- This is a 2-bed/1.0-bath single-family listed at $135k.
Deal economics
- At list price, monthly cash flow is $154 ($2k/yr) — positive.
- The deal already cash-flows at list — no discount required.
- Meets the 1% rule at list price ($1k rent vs $135k).
- Recommended offer: $127k (6.0% below list) — sets the bar for market timing.
- Cap rate 7.7% vs local median 4.4% in Sulphur Springs — top-decile yield for the area; either an underpriced asset or a hidden risk that comps aren't pricing in. Stress-test before assuming the spread holds.
Location & tenants
- Location reads 70/100 on livability (#350 in TX) — a middle-class / working-renter tenant base. Strengths: cost of living A+, housing A+, crime A; Watch: employment D+, amenities F, commute F.
- Sulphur Springs ISD (town): math 46% / reading 40% proficiency, ranked #323 of 826 in TX (top 39%) — families likely to look elsewhere, expect single-tenant / working-renter base with shorter leases.
- Zoned schools: Sulphur Springs El (math 49% / reading 40%, grade F, #1,155 of 4,322 statewide, top 29%, 639 students, 70% FRL); Sulphur Springs Middle (math 50% / reading 38%, grade D, #512 of 1,662 statewide, top 32%, 974 students, 61% FRL); Sulphur Springs H S (math 53% / reading 50%, grade D+, #478 of 1,632 statewide, top 29%, 1,263 students, 53% FRL).
- Market conditions: 382 active listings in the ZIP; 2 comparable units currently listed for rent nearby; 66 units permitted in Hopkins County in 2024 (0 in 5+ unit buildings).
Forward outlook
- Local home prices are declining (-3.0%/yr); year-one equity from $933 of loan paydown is wiped out by about $4k of value loss. Plan a longer hold.
- Hopkins County population projected at +6% by 2050 — modest demand growth; plan on rents tracking national, not racing it.
Negotiation context
- It's been on market 66 days — a 6% lower offer ($127k) is reasonable based on typical stale-listing flexibility.
- 5 sale attempts since 6y ago with the ask held roughly flat each time — persistent listings suggest the price (not the market) is what's stuck; bring a comps-based counter.
Risks & watch-outs
- Watch-outs: built in 1950 — expect roof / HVAC / electrical / plumbing capex.
- Climate carrying-cost: major wind risk, 27% chance of damaging wind over 30y; extreme-heat days projected 6→19/yr by 2055 (HVAC capex compounding) — expect insurance premiums to compound above CPI over the hold.
Questions for the listing agent
- It's been on market 66 days. Have you received any prior offers? Is the seller open to a 6% concession, seller financing, or rate buy-down credit?
- Built in 1950 — when were the roof, HVAC, electrical panel, plumbing, and water heater last replaced?
- Why hasn't it sold? Are there any deal-killer items the seller is aware of (foundation, flood, title, zoning, code violations)?
- Is there a deadline driving the sale (1031 exchange, divorce, estate, relocation)? That informs how much negotiation room exists.
- Schools are D-rated, which usually means shorter tenancies and higher turnover. Who's the typical renter profile here, and what's been the actual vacancy rate?
- The area grade is low — what's the realistic commute time and amenity access for the typical tenant pool here? Any planned neighborhood developments (good or bad) we should know about?
- What's the average days-on-market for RENTAL listings here right now (not sales)? A rising rental-DOM trend means longer vacancies and softer asking-rent achievability than the comps imply.
- What's the recent tenant-quality profile in this submarket — average credit score on applications, eviction rate, late-payment / NSF rate, and stable-employment percentage? A property-management company in the area should have these aggregated.
- How much new for-sale + rental construction is in the pipeline within 1–3 miles? Heavy new supply typically softens prices + rents 12–24 months out; constrained supply supports both.
Investment metrics
- 1% rule
- 1.00% ✓
- Cap rate
- 7.66%
- Cash-on-cash
- 4.90%
- DSCR
- 1.22
- GRM
- 8.3
CMA / ARV
- ARV (median comp)
- $112,817
- List price
- $135,000
- Delta
- 19.66%
- Verdict
- OVERPRICED
- Comps
- 19 within 1.0 mi
Show comp detail 4 sales within ~0.75 mi
| Address | Dist | Beds/Ba | Sqft | Sold | Price | $/sf | Match |
|---|---|---|---|---|---|---|---|
| 213 Nicholson St | 0.41mi | 2/1.0 | 764 (+10%) | 8mo | $70,000 | $92 | 58 |
| 114 Nicholson St | 0.37mi | 2/1.0 | 784 (+13%) | 5mo | $65,900 | $84 | 57 |
| 609 Lamar St | 0.66mi | 2/1.0 | 712 (+2%) | 17mo | $114,900 | $161 | 51 |
| 611 Lamar St | 0.65mi | 2/1.0 | 725 (+4%) | 17mo | $109,000 | $150 | 48 |
Match score weights: distance 35% · size 25% · config 20% · recency 20%. Top-matched comps best support the ARV.
Projected returns pro-forma
-3.0% appreciation · 3.0% rent growth · sell at horizon
- IRR
- -8.7%
- Equity multiple
- 0.68×
- Total profit
- $-12,040
- Equity at exit
- $20,129
- IRR
- 0.8%
- Equity multiple
- 1.06×
- Total profit
- $2,205
- Equity at exit
- $11,672
Cash invested: $37,800 (down + closing). Projections, not guarantees.
Landlord ↔ Tenant lean methodology
- Overall (STATE)
- 87 Strongly Landlord-Friendly
- State Texas
- 87 Strongly Landlord-Friendly · R+5
- County
- — inherits STATE
- City
- — inherits STATE
ZIP-level market 75482
- Active inventory
- 382
- Price-to-rent
- 8.3×
Monthly cashflow live
- Estimated rent
- $1,352 medium interval (Pro) →
- Mortgage (P&I)
- −$708
- Tax from tax record
- −$150 /mo · $1,798/yr
- Insurance
- −$56
- HOA
- −$0
- Vacancy / Maint / Mgmt
- −$284
- Net cashflow
- $154
Break-even live
Sensitivity live
| Price | -10% $231 | -5% $193 | +0% $154 | +5% $116 | +10% $78 |
|---|---|---|---|---|---|
| Rent | -10% $47 | -5% $101 | +0% $154 | +5% $208 | +10% $261 |
| Rate | -1.0pp $222 | -0.5pp $189 | base $154 | +0.5pp $119 | +1.0pp $84 |
UW: 25.0% down · 7.5% · 30yr · 1.5% tax · 5.0% vac · 8.0% maint · 8.0% mgmt
Financing live
Cash to close
- Down payment
- $33,750
- Closing costs
- $4,050
- Reserves months
- —
- Total cash needed
- —
Loan-product check · same deal, 3 products live
Conventional
25% down · 7.5% · 30yr
- Down + closing
- —
- Monthly P&I
- —
- Monthly cashflow
- —
- DSCR
- —
- Eligible?
- —
Personal DTI + credit; lowest rate.
DSCR
20% down · 8.5% · 30yr
- Down + closing
- —
- Monthly P&I
- —
- Monthly cashflow
- —
- DSCR
- —
- Eligible?
- —
No personal income docs; deal must DSCR.
Hard money
10% down · 12.0% · 12mo
- Down + closing
- —
- Monthly P&I
- —
- Monthly cashflow
- —
- DSCR
- —
- Eligible?
- —
Short-term bridge; refi at stabilization.
Rent comps 2 comps
| Address | Beds | Baths | Sqft | Rent | $/sqft | DOM | Units | Dist |
|---|---|---|---|---|---|---|---|---|
| 210 Duckworth St Sulphur Springs, TX | 1.0–2.0 | 1.0 | 700 | $1,000 | $1.43 | 45d | 2 | 0.98mi |
| 1699 Arbala Rd Sulphur Springs, TX | 1.0–3.0 | 1.0–2.0 | 985 | $1,610 | $1.63 | 45d | 10 | 1.46mi |
Listing history 29 events
-
2026-06-21days on market $135,000 Active 66 DOM
-
2026-06-19days on market $135,000 Active 64 DOM
-
2026-06-18days on market $135,000 Active 63 DOM
-
2026-06-17days on market $135,000 Active 62 DOM
-
2026-06-16days on market $135,000 Active 61 DOM
-
2026-06-15days on market $135,000 Active 60 DOM
-
2026-06-14days on market $135,000 Active 58 DOM
-
2026-06-12days on market $135,000 Active 57 DOM
-
2026-06-09days on market $135,000 Active 54 DOM
-
2026-06-08days on market $135,000 Active 53 DOM
-
2026-06-07days on market $135,000 Active 52 DOM
-
2026-06-07days on market $135,000 Active 51 DOM
-
2026-06-03days on market $135,000 Active 48 DOM
-
2026-06-02days on market $135,000 Active 47 DOM
-
2026-06-01days on market $135,000 Active 46 DOM
-
2026-05-31days on market $135,000 Active 45 DOM
-
2026-05-30days on market $135,000 Active 44 DOM
-
2026-04-16$135,000 Active 941-char remark
Show marketing remark (941 chars)
Charming and move-in ready, this updated 2-bedroom, 1-bath home offers a functional layout with modern finishes and a comfortable feel throughout. Featuring durable flooring, fresh neutral tones, and an abundance of natural light, the interior creates a bright and inviting atmosphere. The kitchen provides ample cabinet space and updated countertops, making it both practical and stylish. The bathroom has been refreshed with a clean, simple design for everyday convenience. Situated on a spacious lot with mature trees, the exterior offers plenty of room for outdoor enjoyment, gardening, or future improvements. With approximately 696 square feet of living space and a layout that maximizes functionality, this home is a great option for a variety of buyers. Conveniently located near local shopping, dining, and community amenities, this property offers small-town charm with easy access to everything Sulphur Springs has to offer.
-
2026-03-09historical $1,000
-
2026-03-06$1,000
-
2026-03-06historical $1,000
-
2026-02-25$1,000
-
2020-04-06historical
-
2020-03-17status Active
-
2020-03-17$57,000 Active
-
2020-03-17historical
-
2018-01-17soldstatus
-
2013-03-04soldstatus
-
1995-05-05soldstatus
ⓘ Source: listings_history table (triggers on properties + properties_extension) + one-shot
backfill from property_details.listing_events for pre-trigger history.
Tax reassessment forecast TX · Resets to sale price
- Current annual tax
- $1,798 · $150/mo
- Projected year-2 tax
- $2,470 · $206/mo
- Expected delta
- +$672/yr (+$56/mo · 37.4%)
ⓘ Screening estimate from a state-policy table — verify with the county assessor before closing.
Climate risk First Street
- Flood 1/10 Low FEMA zone X (unshaded) · 0% chance over 30 yrs
- Wildfire 4/10 Moderate
- Heat 6/10 Major 6 d/yr ≥110°F today · 19 d/yr by 30 yrs out
- Wind 6/10 Major 27% chance of damaging wind over 30 yrs
- Air quality 2/10 Low 0 unhealthy d/yr today · 1 by 30 yrs out
Nearby sold comps map
Loading sold comps map…
Walkable amenities ~0.75 mi
Loading nearby amenities…
Taxation est. · year 1
- Rental income
- $16,228
- − Mortgage interest
- −$7,562
- − Property taxes
- −$1,798
- − Insurance
- −$675
- − Repairs & maintenance
- −$1,298
- − Management
- −$1,298
- − Depreciation
- −$3,927
- Taxable loss
- −$331
- Est. tax savings @ 24.0%
- +$79
- After-tax cash flow
- $1,931/yr
For passive investors: Depreciation is non-cash, so a rental often shows a tax loss while cash-flowing — sheltering income. Rental losses are passive: they offset passive income freely, and up to $25,000/yr can offset ordinary (W-2) income if you actively participate and your MAGI is under $100k (phasing out to $0 by $150k); unused losses carry forward. On sale, claimed depreciation is recaptured at up to 25%, and gains may owe capital-gains tax (a 1031 exchange can defer both). Figures are a year-1 estimate at your 24.0% rate — not tax advice; consult a CPA.
Schools (NCES district)
- District
- Sulphur Springs ISD
- NCES district ID
- 4841820
- Math proficiency
- 46% ▼ -7.00%
- Reading proficiency
- 40% ▼ -4.00%
- Median HH income
- $42,871
- Composite
- 36.33/100
- National rank
- #4692
- State rank
- #323 of 826 in TX
Livability — Sulphur Springs
- Score
- 70/100
- State rank
- #350
- US rank
- #7665
Category grades
Schools grade is shown separately in the Schools card above.
Census & demographics
- Census place
- Sulphur Springs, TX
- County
- Hopkins County · 26,483 people
- City population
- 26,483
- Metro
- Sulphur Springs, TX
- Population (ZIP)
- 26,483
- Household income
- $69,970
- Rent vs Own
- Severe rent burden
- 543.0
Population outlook (Hopkins County) Hauer SSP2
- Today (2025)
- 38,107 people
- By 2030
- 38,867 · +2.0%
- By 2040
- 40,009 · +5.0%
- By 2050
- 40,448 · +6.1%
- By 2075
- 40,669 · +6.7%
- By 2100
- 37,234 · -2.3%
Race, ethnicity, and origin ACS 2023
- Neighborhood character
- Predominantly White (70%)
- Race & ethnicity
- White 70% Hispanic / Latino 17% Black 9% Two or more races 7% Asian 1%
- Hispanic origin (detail)
- Mexican 15%
- Common ancestry
- Slovak 2% Lithuanian 2% Iranian 1%
- Foreign-born
- 9% · Canada, Vietnam
- Languages at home
- 84% English-only · Spanish 14% Vietnamese 1%
Political lean MEDSL · Hopkins
- 2024 margin
- Solid R (+64.6) · D 17.4% · R 82.0%
- 2008→2024 swing
- -20.0pp toward R · 2008: -44.7pp · 2024: -64.6pp
- All cycles
- 2024: R+64.6 2020: R+60.7 2016: R+60.8 2012: R+55.4 2008: R+44.7
Not yet ingested
- Civics
- —
Market trends
- HPI YoY
- ▼ -125.79%
- Current HPI
- 156.0526
- Rent YoY
- —
- Metro
- Sulphur Springs, TX
- State GDP YoY
- ▲ 3.95%
- F500 in state
- 110
Industry mix (Fortune 500 HQ in TX)
| Industry | F500 HQs | Revenue |
|---|---|---|
| Energy | 16 | $1,198B |
|
||
| Technology | 5 | $198B |
|
||
| Engineering / Construction | 4 | $72B |
|
||
| Energy Services | 3 | $60B |
|
||
| Utilities | 3 | $41B |
|
||
| Healthcare | 2 | $330B |
|
||
Price history
+136.8% since first listed12 events — show timeline
- 2026-04-16 Listed $135,000 NTREIS
- 2026-03-09 Rental Removed $1,000 RENTALBEAST
- 2026-03-06 Listed for Rent $1,000 RENTALBEAST
- 2026-03-06 Rental Removed $1,000 BUILDIUM
- 2026-02-25 Listed for Rent $1,000 BUILDIUM
- 2020-04-06 Listing Removed — NTREIS
- 2020-03-17 Relisted — NTREIS
- 2020-03-17 Listing Removed — NTREIS
- 2020-03-17 Listed $57,000 NTREIS
- 2018-01-17 Sold (Public Records) — Public Records
- 2013-03-04 Sold (Public Records) — Public Records
- 1995-05-05 Sold (Public Records) — Public Records
Property tax history
+11.0%/yrLatest (2025): $1,798 · +14.7% YoY. Source: county tax records.
Cash-flow waterfall
monthlySold comps — $/sqft
last 12 mo · ≤1 miLoading sold comps…