2284 Pumpkin Hollow Rd · Davenport Center, NY
Flood risk 1/10 · Minimal
- FEMA flood zone
- X (unshaded)
- Chance of flooding over 30 yrs
- 0.0%
- Est. flood insurance / yr
- $507 – $1,088
Fire risk 3/10 · Minor
- Est. fire insurance / yr
- $691 – $1,283
Heat risk 1/10 · Minimal
- Hot days now (above 88°F)
- 7 days/yr
- Hot days in 30 yrs
- 17 days/yr
Wind risk 2/10 · Minimal
- Chance of severe wind over 30 yrs
- 1.0%
Air-quality risk 1/10 · Minimal
- Unhealthy air days now
- 0 days/yr
- Unhealthy air days in 30 yrs
- 0 days/yr
Risk factors via First Street. Map © Google.
Why this score? — see what drove the C+ grade
The composite is a weighted blend of 9 inputs, each scored 0–100. Each bar is that input's sub-score; the figure is the points it added to the 100-point composite (weight × sub-score).
- Cash flow +26.2/30.0
- Appreciation +10.0/10.0
- DSCR +8.9/10.0
- 1% rule +6.5/10.0
- Schools +3.7/10.0
- Livability +2.9/5.0
- Rent growth +2.5/5.0
- Condition / age +2.5/5.0
- ARV discount +0.0/15.0
$115,000
🖨 Deal sheet 📄 Offer letter ✓ Due diligence
Listing remarks
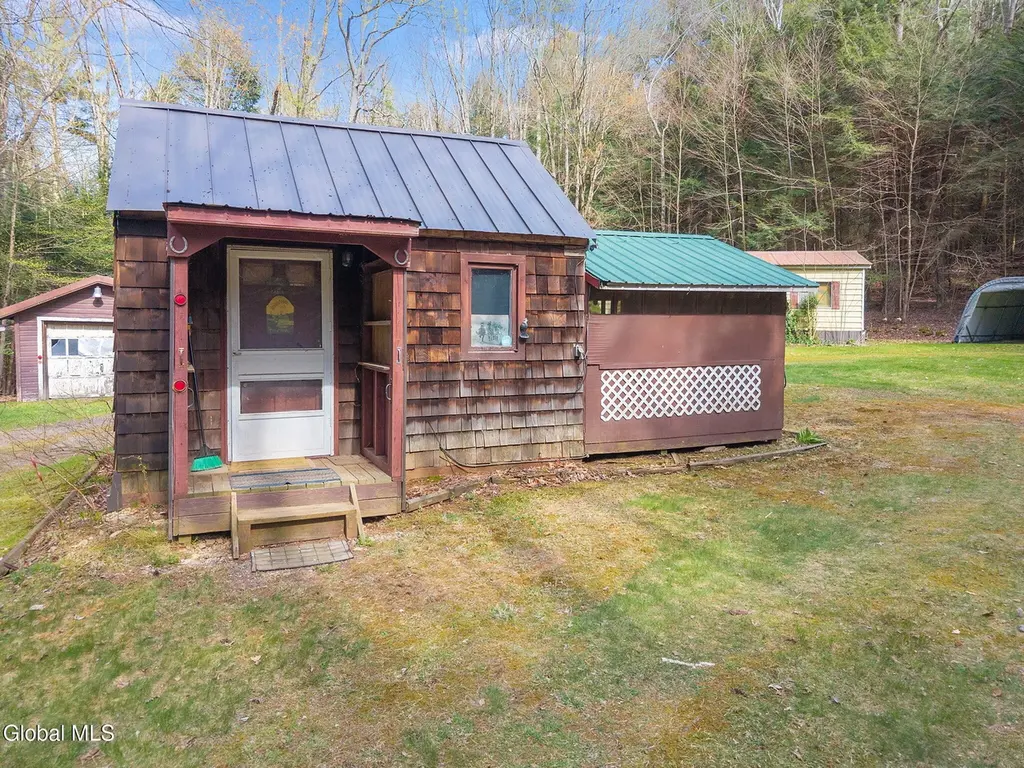
Surrounded by the quiet beauty of nature and abundant wildlife, this 6.08-acre property nestled among the trees offers a peaceful, private setting--truly a hunter's paradise. Spread across four separate lots, the land is home to a collection of structures including two singlewide homes, a small cabin with attached screen house, a Quonset hut, garage, and both a small and large pavilion, each contributing to the property's unique character. Structures are being sold as-is and may require substantial rehabilitation or removal. Set in a serene, secluded location yet just a short drive to Oneonta and its everyday amenities, this property invites a slower pace and a deeper connection to the outd
Key facts
- Four separate lots
- 6.08 acre property
- Small cabin
Tags
Property features AI
Exterior
- Parking: Detached garage (1 garage space); Driveway and additional off-street parking (total of 4 parking spaces)
- Utilities: Septic tank
- Home design: Single family residence; Entry on the first level
- Construction: Aluminum siding and other exterior materials
- Exterior features: Enclosed front porch; Metal roof; Shed(s) and detached garage on the property; Secluded, private wooded lot with cleared areas; Sloped to steep slope terrain
Interior
- Kitchen: First-floor kitchen
- Bedrooms: Two first-floor bedrooms
- Bathrooms: One full bathroom (first floor)
- Interior features: Enclosed front porch/entry; Total of 8 rooms
Neighborhood map
What this means for you Summary
Snapshot
- This is a 2-bed/1.0-bath manufactured listed at $115k.
Deal economics
- At list price, monthly cash flow is $295 ($4k/yr) — positive.
- The deal already cash-flows at list — no discount required.
- Meets the 1% rule at list price ($1k rent vs $115k).
- Recommended offer: $112k (3.0% below list) — sets the bar for market timing.
Location & tenants
- Location reads 58/100 on livability (#1,049 in NY) — a working-class tenant base; expect higher turnover. Strengths: cost of living A+, housing A; Watch: employment C-, health & safety C-, schools F.
- Charlotte Valley Central School District (rural): math 35% / reading 45% proficiency, ranked #640 of 755 in NY (top 85%) — families likely to look elsewhere, expect single-tenant / working-renter base with shorter leases.
- Market conditions: 118 active listings in the ZIP; 66 units permitted in Delaware County in 2024 (0 in 5+ unit buildings).
Forward outlook
- In year one you build about $12k of equity ($795 loan paydown + $12k appreciation (10.0% local appreciation)).
- Delaware County population projected at -27% by 2050 — secular population decline; favor cash flow + early exit over multi-decade hold.
- At projected returns (10.0% appreciation + 3.0% rent growth), your $32k cash investment doubles in ~2 years — after that, you're playing with house money.
- By year 3, paydown + projected appreciation supports a ~$31k cash-out refi (75% LTV) — recoverable capital for the next deal without selling this one.
Negotiation context
- It's been on market 48 days — a 3% lower offer ($112k) is reasonable based on typical stale-listing flexibility.
- 8 sale attempts since 15y ago with the ask held roughly flat each time — persistent listings suggest the price (not the market) is what's stuck; bring a comps-based counter.
Questions for the listing agent
- It's been on market 48 days. Have you received any prior offers? Is the seller open to a 3% concession, seller financing, or rate buy-down credit?
- Built in 1978 — when were the roof, HVAC, electrical panel, plumbing, and water heater last replaced?
- Is there a deadline driving the sale (1031 exchange, divorce, estate, relocation)? That informs how much negotiation room exists.
- Schools are F-rated, which usually means shorter tenancies and higher turnover. Who's the typical renter profile here, and what's been the actual vacancy rate?
- Crime grade is F in this area — have there been break-ins, vandalism, or insurance claims at this property in the last 3 years? What carrier currently insures it and at what premium?
- What's the average days-on-market for RENTAL listings here right now (not sales)? A rising rental-DOM trend means longer vacancies and softer asking-rent achievability than the comps imply.
- What's the recent tenant-quality profile in this submarket — average credit score on applications, eviction rate, late-payment / NSF rate, and stable-employment percentage? A property-management company in the area should have these aggregated.
- How much new for-sale + rental construction is in the pipeline within 1–3 miles? Heavy new supply typically softens prices + rents 12–24 months out; constrained supply supports both.
Investment metrics
- 1% rule
- 1.15% ✓
- Cap rate
- 9.37%
- Cash-on-cash
- 10.99%
- DSCR
- 1.49
- GRM
- 7.2
CMA / ARV
- ARV (median comp)
- $81,473
- List price
- $115,000
- Delta
- 41.15%
- Verdict
- OVERPRICED
- Comps
- 2 within 2.0 mi
Projected returns pro-forma
10.0% appreciation · 3.0% rent growth · sell at horizon
- IRR
- 32.3%
- Equity multiple
- 3.53×
- Total profit
- $81,411
- Equity at exit
- $103,601
- IRR
- 27.9%
- Equity multiple
- 7.99×
- Total profit
- $224,953
- Equity at exit
- $223,420
Cash invested: $32,200 (down + closing). Projections, not guarantees.
Landlord ↔ Tenant lean methodology
- Overall (STATE)
- 15 Strongly Tenant-Friendly
- State New York
- 15 Strongly Tenant-Friendly · D+10
- County
- — inherits STATE
- City
- — inherits STATE
ZIP-level market 13820
- Home prices YoY
- 22.7%
- Active inventory
- 118
- Price-to-rent
- 7.2×
Monthly cashflow live
- Estimated rent
- $1,322 medium interval (Pro) →
- Mortgage (P&I)
- −$603
- Tax from tax record
- −$99 /mo · $1,184/yr
- Insurance
- −$48
- HOA
- −$0
- Vacancy / Maint / Mgmt
- −$278
- Net cashflow
- $295
Break-even live
UW: 25.0% down · 7.5% · 30yr · 1.5% tax · 5.0% vac · 8.0% maint · 8.0% mgmt
Financing live
Cash to close
- Down payment
- $28,750
- Closing costs
- $3,450
- Reserves months
- —
- Total cash needed
- —
Loan-product check · same deal, 3 products live
Conventional
25% down · 7.5% · 30yr
- Down + closing
- —
- Monthly P&I
- —
- Monthly cashflow
- —
- DSCR
- —
- Eligible?
- —
Personal DTI + credit; lowest rate.
DSCR
20% down · 8.5% · 30yr
- Down + closing
- —
- Monthly P&I
- —
- Monthly cashflow
- —
- DSCR
- —
- Eligible?
- —
No personal income docs; deal must DSCR.
Hard money
10% down · 12.0% · 12mo
- Down + closing
- —
- Monthly P&I
- —
- Monthly cashflow
- —
- DSCR
- —
- Eligible?
- —
Short-term bridge; refi at stabilization.
Listing history 25 events
-
2026-06-19days on market $115,000 Active 48 DOM
-
2026-06-18days on market $115,000 Active 47 DOM
-
2026-06-17days on market $115,000 Active 46 DOM
-
2026-06-16days on market $115,000 Active 45 DOM
-
2026-06-15days on market $115,000 Active 44 DOM
-
2026-06-14days on market $115,000 Active 42 DOM
-
2026-06-12days on market $115,000 Active 41 DOM
-
2026-06-09days on market $115,000 Active 38 DOM
-
2026-06-08days on market $115,000 Active 37 DOM
-
2026-06-07days on market $115,000 Active 36 DOM
-
2026-06-07pricedays on market $115,000 Active 35 DOM
-
2026-06-03days on market $119,000 Active 32 DOM
-
2026-06-02days on market $119,000 Active 31 DOM
-
2026-06-01days on market $119,000 Active 30 DOM
-
2026-05-31days on market $119,000 Active 29 DOM
-
2026-05-31days on market $119,000 Active 28 DOM
-
2026-05-02$119,000 Active 942-char remark
-
2017-07-25$79,900
-
2016-04-08historical
-
2016-04-08$89,900
-
2016-04-01$89,900
-
2015-07-11$110,000
-
2014-07-10$134,000
-
2012-02-14$99,000
-
2011-07-06$99,000
ⓘ Source: listings_history table (triggers on properties + properties_extension) + one-shot
backfill from property_details.listing_events for pre-trigger history.
Tax reassessment forecast NY · Partial reset (capped growth)
- Current annual tax
- $1,184 · $99/mo
- Projected year-2 tax
- $1,564 · $130/mo
- Expected delta
- +$380/yr (+$32/mo · 32.1%)
ⓘ Screening estimate from a state-policy table — verify with the county assessor before closing.
Climate risk First Street
- Flood 1/10 Low FEMA zone X (unshaded) · 0% chance over 30 yrs
- Wildfire 3/10 Moderate
- Heat 1/10 Low 7 d/yr ≥88°F today · 17 d/yr by 30 yrs out
- Wind 2/10 Low 100% chance of damaging wind over 30 yrs
- Air quality 1/10 Low 0 unhealthy d/yr today · 0 by 30 yrs out
Nearby sold comps map
Loading sold comps map…
Walkable amenities ~0.75 mi
Loading nearby amenities…
Taxation est. · year 1
- Rental income
- $15,868
- − Mortgage interest
- −$6,442
- − Property taxes
- −$1,184
- − Insurance
- −$575
- − Repairs & maintenance
- −$1,269
- − Management
- −$1,269
- − Depreciation
- −$3,345
- Taxable income
- $1,783
- Est. tax owed @ 24.0%
- −$428
- After-tax cash flow
- $3,112/yr
For passive investors: Depreciation is non-cash, so a rental often shows a tax loss while cash-flowing — sheltering income. Rental losses are passive: they offset passive income freely, and up to $25,000/yr can offset ordinary (W-2) income if you actively participate and your MAGI is under $100k (phasing out to $0 by $150k); unused losses carry forward. On sale, claimed depreciation is recaptured at up to 25%, and gains may owe capital-gains tax (a 1031 exchange can defer both). Figures are a year-1 estimate at your 24.0% rate — not tax advice; consult a CPA.
Schools (NCES district)
- District
- Charlotte Valley Central School District
- NCES district ID
- 3607050
- Math proficiency
- 35% ▲ 5.00%
- Reading proficiency
- 45% ▲ 10.00%
- Median HH income
- $47,579
- Composite
- 36.67/100
- National rank
- #9236
- State rank
- #640 of 755 in NY
Livability — Davenport Center
- Score
- 58/100
- State rank
- #1049
- US rank
- #20806
Category grades
Schools grade is shown separately in the Schools card above.
Census & demographics
- Census place
- Davenport Center, NY
- County
- Otsego County · 23,056 people
- Metro
- Oneonta, NY
- Population (ZIP)
- 23,056
- Household income
- $65,953
- Rent vs Own
- Severe rent burden
- 662.0
Population outlook (Delaware County) Hauer SSP2
- Today (2025)
- 42,668 people
- By 2030
- 40,337 · -5.5%
- By 2040
- 35,514 · -16.8%
- By 2050
- 31,265 · -26.7%
- By 2075
- 24,455 · -42.7%
- By 2100
- 19,529 · -54.2%
Race, ethnicity, and origin ACS 2023
- Neighborhood character
- Predominantly White (84%)
- Race & ethnicity
- White 84% Hispanic / Latino 6% Black 5% Two or more races 5% Asian 2%
- Hispanic origin (detail)
- Puerto Rican 2%
- Common ancestry
- Romanian 4% Slovak 2% Lithuanian 2%
- Foreign-born
- 5% · Canada, China
- Languages at home
- 94% English-only · Spanish 3% Russian/Polish/Slavic 1% Other Indo-European 1%
Political lean MEDSL · Delaware
- 2024 margin
- R (+19.8) · D 40.1% · R 59.9%
- 2008→2024 swing
- -14.6pp toward R · 2008: -5.2pp · 2024: -19.8pp
- All cycles
- 2024: R+19.8 2020: R+18.4 2016: R+29.2 2012: R+9.6 2008: R+5.2
Not yet ingested
- Civics
- —
Market trends
- HPI YoY
- ▲ 67.86%
- Current HPI
- 366.3391
- Rent YoY
- —
- Metro
- Oneonta, NY
- State GDP YoY
- ▲ 2.60%
- F500 in state
- 92
Industry mix (Fortune 500 HQ in NY)
| Industry | F500 HQs | Revenue |
|---|---|---|
| Financial Services | 10 | $950B |
|
||
| Consumer Goods | 9 | $162B |
|
||
| Insurance | 4 | $225B |
|
||
| Telecommunications | 2 | $144B |
|
||
| Pharmaceuticals | 2 | $112B |
|
||
| Media / Entertainment | 2 | $69B |
|
||
Price history
+16.2% since first listed10 events — show timeline
- 2026-06-05 Price Changed $115,000 Global MLS
- 2026-05-02 Listed $119,000 Global MLS
- 2017-07-25 Listed $79,900 UNYREIS
- 2016-04-08 Listed $89,900 UNYREIS
- 2016-04-08 Listing Removed — UNYREIS
- 2016-04-01 Listed $89,900 UNYREIS
- 2015-07-11 Listed $110,000 UNYREIS
- 2014-07-10 Listed $134,000 UNYREIS
- 2012-02-14 Listed $99,000 UNYREIS
- 2011-07-06 Listed $99,000 UNYREIS
Property tax history
+8.6%/yrLatest (2025): $1,184 · +3.5% YoY. Source: county tax records.
Cash-flow waterfall
monthlySold comps — $/sqft
last 12 mo · ≤1 miLoading sold comps…