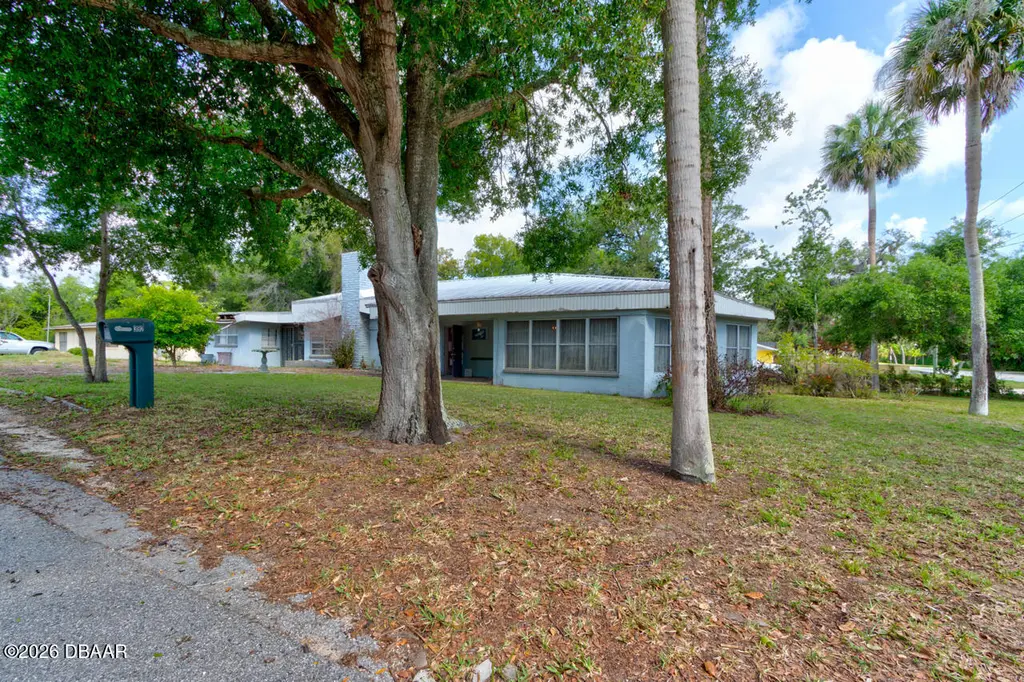
392 S Ridgewood Ave · Ormond Beach, FL
Flood risk 1/10 · Minimal
- FEMA flood zone
- X (unshaded)
- Chance of flooding over 30 yrs
- 0.0%
- Est. flood insurance / yr
- $507 – $1,088
Fire risk 2/10 · Minimal
- Est. fire insurance / yr
- $947 – $1,759
Heat risk 10/10 · Severe
- Hot days now (above 104°F)
- 7 days/yr
- Hot days in 30 yrs
- 20 days/yr
Wind risk 10/10 · Severe
- Chance of severe wind over 30 yrs
- 99.0%
Air-quality risk 3/10 · Minor
- Unhealthy air days now
- 3 days/yr
- Unhealthy air days in 30 yrs
- 3 days/yr
Risk factors via First Street. Map © Google.
Why this score? — see what drove the C+ grade
The composite is a weighted blend of 9 inputs, each scored 0–100. Each bar is that input's sub-score; the figure is the points it added to the 100-point composite (weight × sub-score).
- Cash flow +26.9/30.0
- DSCR +9.3/10.0
- ARV discount +7.5/15.0
- 1% rule +6.2/10.0
- Livability +4.2/5.0
- Schools +3.9/10.0
- Rent growth +2.9/5.0
- Condition / age +2.5/5.0
- Appreciation +0.0/10.0
$225,000
🖨 Deal sheet (PDF) 📄 Offer letter ✓ Due diligence
Listing remarks
Great Ormond Beach investment property. Located close to the river on a corner lot convenient to all of Ormond Beach's amenities. This will be a cash only transaction as the home currently needs your vision and your dedication. There are 3 bedrooms and three baths in the main home with the ability to section off one bedroom and bathroom for separate living quarters with its own entrance as well as another studio apartment across the home's breezeway, providing income potential. Plenty to work with here including a large eat-in kitchen, living room, family room with knotty pine ceiling and stone fireplace. Large 80 x155 lot. Bring all offers.
Key facts
- Knotty pine ceiling
- Large eat-in kitchen
- Income potential
Tags
Property features AI
Exterior
- Parking: Off-street parking
- Utilities: Public water; Public sewer; Electricity connected; Water connected; Sewer connected
- Home design: Single-family residence; One level; Faces south; Fixer condition
- Construction: Block and concrete construction; Metal roof; Slab foundation; Built in (year not provided)
- Exterior features: Front porch; Corner lot; Paved, public-maintained city street frontage
Interior
- Kitchen: Microwave; Gas range; Dishwasher
- Flooring: Hardwood; Tile; Wood
- Bathrooms: 4 full bathrooms
- Heating & cooling: Central heating (electric); Central air; Ceiling fans
- Interior features: Built-in features; Ceiling fans; Eat-in kitchen; In-law floorplan; Unfurnished; Fireplace (1)
Neighborhood map
What this means for you Summary
Snapshot
- This is a 3-bed/2.0-bath single-family listed at $225k.
Deal economics
- At list price, monthly cash flow is $620 ($7k/yr) — positive.
- The deal already cash-flows at list — no discount required.
- Meets the 1% rule at list price ($3k rent vs $225k).
- Cap rate 9.6% vs local median 3.8% in Ormond Beach — top-decile yield for the area; either an underpriced asset or a hidden risk that comps aren't pricing in. Stress-test before assuming the spread holds.
Location & tenants
- Location reads 83/100 on livability (#55 in FL, #965 nationally) — a professional / high-income tenant draw. Strengths: amenities A+, housing A+, health & safety A+; Watch: commute F.
- Volusia (suburban): math 44% / reading 49% proficiency, ranked #47 of 73 in FL (top 64%) — families likely to look elsewhere, expect single-tenant / working-renter base with shorter leases.
- Zoned schools: Ormond Beach Elementary School (math 67% / reading 67%, grade B+, #450 of 2,144 statewide, top 22%, 318 students, 60% FRL); Ormond Beach Middle School (math 57% / reading 55%, grade B-, #175 of 571 statewide, top 31%, 990 students, 48% FRL); Seabreeze High School (math 31% / reading 56%, grade F, #248 of 667 statewide, top 38%, 1,654 students, 41% FRL) — zoned schools at 50% FRL track the district average.
- Market conditions: Rents rising (+1.6%/yr); 989 active listings in the ZIP; 9 comparable units currently listed for rent nearby; rentals at typical pace (median 26d on market — plan ~3-4 weeks tenant-placement turnaround); 3,402 units permitted in Volusia County in 2024 (681 in 5+ unit buildings).
- This rent runs 42% of the median local income ($71k/yr) — at the standard rent-burdened threshold; future hikes will face affordability resistance.
Forward outlook
- Local home prices are declining (-3.0%/yr); year-one equity from $2k of loan paydown is wiped out by about $7k of value loss. Plan a longer hold.
- Volusia County population projected at +19% by 2050 — long-run rental-demand tailwind backs the buy-and-hold thesis.
Negotiation context
- Only 4 days on market — expect competitive offers; lowballing is unlikely to land.
- Current owner paid $57k; list at $225k implies a 293% gain — meaningful room to come down on a strong offer.
Risks & watch-outs
- Watch-outs: built in 1953 — expect roof / HVAC / electrical / plumbing capex.
- Climate carrying-cost: severe wind risk, 99% chance of damaging wind over 30y; extreme-heat days projected 7→20/yr by 2055 (HVAC capex compounding) — expect insurance premiums to compound above CPI over the hold.
Questions for the listing agent
- Built in 1953 — when were the roof, HVAC, electrical panel, plumbing, and water heater last replaced?
- Is there a deadline driving the sale (1031 exchange, divorce, estate, relocation)? That informs how much negotiation room exists.
- Schools are B-rated — typically a magnet for longer-tenancy family renters. What's the average tenant stay here, and is there a school-zone premium baked into asking?
- What's the average days-on-market for RENTAL listings here right now (not sales)? A rising rental-DOM trend means longer vacancies and softer asking-rent achievability than the comps imply.
- What's the recent tenant-quality profile in this submarket — average credit score on applications, eviction rate, late-payment / NSF rate, and stable-employment percentage? A property-management company in the area should have these aggregated.
- How much new for-sale + rental construction is in the pipeline within 1–3 miles? Heavy new supply typically softens prices + rents 12–24 months out; constrained supply supports both.
Investment metrics
- 1% rule
- 1.12% ✓
- Cap rate
- 9.60%
- Cash-on-cash
- 11.81%
- DSCR
- 1.53
- GRM
- 7.5
CMA / ARV
No comps found within radius.
Projected returns pro-forma
-3.0% appreciation · 1.64% rent growth · sell at horizon
- IRR
- -0.2%
- Equity multiple
- 0.99×
- Total profit
- $-445
- Equity at exit
- $33,548
- IRR
- 8.1%
- Equity multiple
- 1.58×
- Total profit
- $36,599
- Equity at exit
- $19,454
Cash invested: $63,000 (down + closing). Projections, not guarantees.
Landlord ↔ Tenant lean methodology
- Overall (STATE)
- 87 Strongly Landlord-Friendly
- State Florida
- 87 Strongly Landlord-Friendly · R+3
- County
- — inherits STATE
- City
- — inherits STATE
ZIP-level market 32174
- Rents YoY
- 1.6%
- Active inventory
- 989
- Price-to-rent
- 7.5×
Monthly cashflow live
- Estimated rent
- $2,510 high interval (Pro) →
- Mortgage (P&I)
- −$1,180
- Tax from tax record
- −$89 /mo · $1,071/yr
- Insurance
- −$94
- HOA
- −$0
- Lot rent
- −$0
- Vacancy / Maint / Mgmt
- −$527
- Net cashflow
- $620
Break-even live
Sensitivity live
| Price | -10% $747 | -5% $684 | +0% $620 | +5% $556 | +10% $493 |
|---|---|---|---|---|---|
| Rent | -10% $422 | -5% $521 | +0% $620 | +5% $719 | +10% $818 |
| Rate | -1.0pp $733 | -0.5pp $677 | base $620 | +0.5pp $562 | +1.0pp $502 |
UW: 25.0% down · 7.5% · 30yr · 1.5% tax · 5.0% vac · 8.0% maint · 8.0% mgmt
Financing live
Cash to close
- Down payment
- $56,250
- Closing costs
- $6,750
- Reserves months
- —
- Total cash needed
- —
Loan-product check · same deal, 3 products live
Conventional
25% down · 7.5% · 30yr
- Down + closing
- —
- Monthly P&I
- —
- Monthly cashflow
- —
- DSCR
- —
- Eligible?
- —
Personal DTI + credit; lowest rate.
DSCR
20% down · 8.5% · 30yr
- Down + closing
- —
- Monthly P&I
- —
- Monthly cashflow
- —
- DSCR
- —
- Eligible?
- —
No personal income docs; deal must DSCR.
Hard money
10% down · 12.0% · 12mo
- Down + closing
- —
- Monthly P&I
- —
- Monthly cashflow
- —
- DSCR
- —
- Eligible?
- —
Short-term bridge; refi at stabilization.
Rent comps 9 comps
| Address | Beds | Baths | Sqft | Rent | $/sqft | DOM | Units | Dist |
|---|---|---|---|---|---|---|---|---|
| 733 Buena Vista Ave Ormond Beach, FL | 3.0 | 2.0 | 1485 | $2,400 | $1.62 | 25d | 1 | 0.64mi |
| 402 Fleming Ave Ormond Beach, FL | 3.0 | 2.0 | 1495 | $2,560 | $1.71 | 23d | 1 | 0.64mi |
| 81 Tomoka Ave Ormond Beach, FL | 2.0 | 2.5 | 1500 | $1,950 | $1.30 | 25d | 1 | 0.68mi |
| 462 Magnolia St Ormond Beach, FL | 3.0 | 2.0 | 1502 | $2,100 | $1.40 | 16d | 1 | 0.83mi |
| 122 Magnolia Dr Ormond Beach, FL | 3.0 | 2.0 | 1484 | $2,275 | $1.53 | 25d | 1 | 1.02mi |
| 56 Chippingwood Ln Ormond Beach, FL | 2.0 | 2.5 | 1292 | $2,200 | $1.70 | 25d | 1 | 1.20mi |
| 497 Grandview Ave Ormond Beach, FL | 3.0 | 2.0 | 1590 | $2,800 | $1.76 | 25d | 1 | 1.23mi |
| 94 Ivanhoe Dr Ormond Beach, FL | 3.0 | 2.0 | 2074 | $4,500 | $2.17 | 25d | 1 | 1.31mi |
| 559 Cameo Dr Ormond Beach, FL | 3.0 | 2.5 | 1668 | $2,310 | $1.38 | 25d | 1 | 1.43mi |
Listing history 5 events
-
2026-06-01statusdays on market $225,000 Pending 4 DOM
-
2026-05-31days on market $225,000 Active 3 DOM
-
2026-05-31days on market $225,000 Active 2 DOM
-
2026-05-28$225,000 Active
-
1989-01-01soldstatus $57,200
ⓘ Source: listings_history table (triggers on properties + properties_extension) + one-shot
backfill from property_details.listing_events for pre-trigger history.
Tax reassessment forecast FL · Resets to sale price
- Current annual tax
- $1,071 · $89/mo
- Projected year-2 tax
- $1,868 · $156/mo
- Expected delta
- +$797/yr (+$66/mo · 74.4%)
ⓘ Screening estimate from a state-policy table — verify with the county assessor before closing.
Climate risk First Street
- Flood 1/10 Low FEMA zone X (unshaded) · 0% chance over 30 yrs
- Wildfire 2/10 Low
- Heat 10/10 Extreme 7 d/yr ≥104°F today · 20 d/yr by 30 yrs out
- Wind 10/10 Extreme 99% chance of damaging wind over 30 yrs
- Air quality 3/10 Moderate 3 unhealthy d/yr today · 3 by 30 yrs out
Nearby sold comps map
Loading sold comps map…
Walkable amenities ~0.75 mi
Loading nearby amenities…
Taxation est. · year 1
- Rental income
- $30,119
- − Mortgage interest
- −$12,603
- − Property taxes
- −$1,071
- − Insurance
- −$1,125
- − Repairs & maintenance
- −$2,410
- − Management
- −$2,410
- − Depreciation
- −$6,545
- Taxable income
- $3,955
- Est. tax owed @ 24.0%
- −$949
- After-tax cash flow
- $6,490/yr
For passive investors: Depreciation is non-cash, so a rental often shows a tax loss while cash-flowing — sheltering income. Rental losses are passive: they offset passive income freely, and up to $25,000/yr can offset ordinary (W-2) income if you actively participate and your MAGI is under $100k (phasing out to $0 by $150k); unused losses carry forward. On sale, claimed depreciation is recaptured at up to 25%, and gains may owe capital-gains tax (a 1031 exchange can defer both). Figures are a year-1 estimate at your 24.0% rate — not tax advice; consult a CPA.
Schools (NCES district)
- District
- Volusia
- NCES district ID
- 1201920
- Math proficiency
- 44% ▼ -9.00%
- Reading proficiency
- 49% ▼ -3.00%
- Median HH income
- $42,946
- Composite
- 39.2/100
- National rank
- #4019
- State rank
- #47 of 73 in FL
Livability — Ormond Beach
- Score
- 83/100
- State rank
- #55
- US rank
- #965
Category grades
Schools grade is shown separately in the Schools card above.
Census & demographics
- Census place
- Ormond Beach, FL
- County
- Volusia County · 556,871 people
- City population
- 69,624
- Metro
- Deltona-Daytona Beach-Ormond Beach, FL
- Population (ZIP)
- 54,783
- Household income
- $71,011
- Rent vs Own
- Severe rent burden
- 1158.0
Population outlook (Volusia County) Hauer SSP2
- Today (2025)
- 572,749 people
- By 2030
- 598,695 · +4.5%
- By 2040
- 644,880 · +12.6%
- By 2050
- 681,451 · +19.0%
- By 2075
- 759,957 · +32.7%
- By 2100
- 778,902 · +36.0%
Race, ethnicity, and origin ACS 2023
- Neighborhood character
- Predominantly White (82%)
- Race & ethnicity
- White 82% Black 6% Hispanic / Latino 5% Two or more races 5% Asian 3%
- Hispanic origin (detail)
- Puerto Rican 2%
- Common ancestry
- Romanian 4% Lithuanian 3% Slovak 3%
- Foreign-born
- 7% · Canada, China
- Languages at home
- 91% English-only · Spanish 3% Other Indo-European 1% German/W. Germanic 1%
Political lean MEDSL · Volusia
- 2024 margin
- Strong R (+21.8) · D 38.7% · R 60.5%
- 2008→2024 swing
- -27.4pp toward R · 2008: 5.7pp · 2024: -21.8pp
- All cycles
- 2024: R+21.8 2020: R+14.1 2016: R+13.1 2012: R+1.2 2008: D+5.7
Not yet ingested
- Civics
- —
Market trends
- HPI YoY
- ▼ -327.97%
- Current HPI
- 271.92
- Rent YoY
- ▲ 1.64%
- Metro
- Deltona-Daytona Beach-Ormond Beach, FL
- State GDP YoY
- ▲ 3.28%
- F500 in state
- 36
Industry mix (Fortune 500 HQ in FL)
| Industry | F500 HQs | Revenue |
|---|---|---|
| Industrial Technology | 2 | $29B |
|
||
| Insurance | 2 | $17B |
|
||
| Retail | 1 | $60B |
|
||
| Technology Distribution | 1 | $58B |
|
||
| Homebuilding | 1 | $35B |
|
||
| Technology Manufacturing | 1 | $35B |
|
||
Price history
+293.4% since first listed2 events — show timeline
- 2026-05-28 Listed $225,000 Daytona MLS
- 1989-01-01 Sold (Public Records) $57,200 Public Records
Property tax history
+1.4%/yrLatest (2025): $1,071 · +4.9% YoY. Source: county tax records.
Cash-flow waterfall
monthlySold comps — $/sqft
last 12 mo · ≤1 miLoading sold comps…