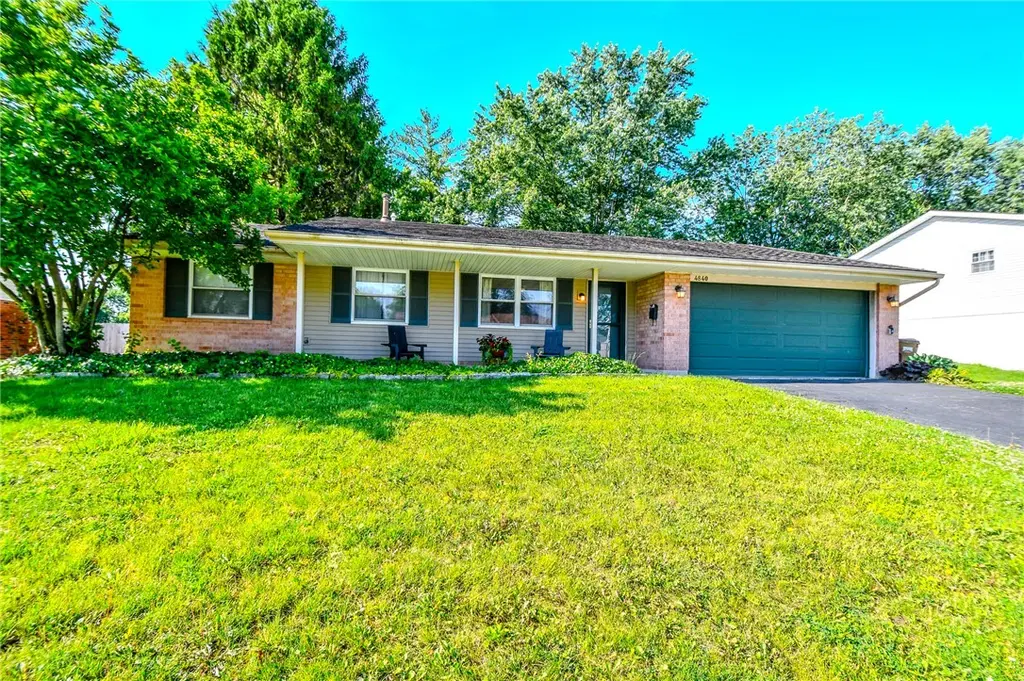
4840 Baldwin Hills Dr · Clayton, OH
Flood risk 1/10 · Minimal
- FEMA flood zone
- X (unshaded)
- Chance of flooding over 30 yrs
- 0.0%
- Est. flood insurance / yr
- $507 – $1,088
Fire risk 1/10 · Minimal
- Est. fire insurance / yr
- $713 – $1,323
Heat risk 3/10 · Minor
- Hot days now (above 101°F)
- 7 days/yr
- Hot days in 30 yrs
- 18 days/yr
Wind risk 2/10 · Minimal
- Chance of severe wind over 30 yrs
- —
Air-quality risk 3/10 · Minor
- Unhealthy air days now
- 3 days/yr
- Unhealthy air days in 30 yrs
- 4 days/yr
Risk factors via First Street. Map © Google.
Why this score? — see what drove the D- grade
The composite is a weighted blend of 9 inputs, each scored 0–100. Each bar is that input's sub-score; the figure is the points it added to the 100-point composite (weight × sub-score).
- Cash flow +12.4/30.0
- Schools +5.0/10.0
- DSCR +3.7/10.0
- ARV discount +3.6/15.0
- Livability +3.6/5.0
- 1% rule +3.4/10.0
- Condition / age +2.5/5.0
- Rent growth +2.4/5.0
- Appreciation +0.0/10.0
$225,000
🖨 Deal sheet 📄 Offer letter ✓ Due diligence
Listing remarks MLS
This is the home you have been waiting for! 3 bedroom ranch home with 1.5 bathrooms and 2 car garage that is completely fenced in with a nicely shaded yard and concrete patio. There have been many updates including: roof, siding, windows, garage door, storm door, lighting, toilets, furnace, and air conditioning. There is new flooring in both bathrooms and laundry room. The kitchen offers a spacious area for the entire family to dine in, an island with range, refrigerator, brand new dishwasher, and wood laminate flooring. Don't delay come see this home today!
Key facts
- Large utility room
- 9,627 sq ft lot
- 2 garage spots
Tags
Property features AI
Finance
- Financial info: Offered for sale
Exterior
- Parking: Attached two-car garage
- Utilities: Public water; Sewer available
- Home design: Single-story; Residential zoning
- Construction: Brick, frame, and vinyl siding exterior; Slab foundation
- Exterior features: Fenced yard; Patio
Interior
- Kitchen: Dishwasher; Disposal; Microwave; Range; Refrigerator
- Bedrooms: Bedroom on main level (12 x 10); Bedroom on main level (10 x 8)
- Bathrooms: 1 full bathroom; 1 half bathroom
- Heating & cooling: Forced air heating (natural gas); Central air conditioning
- Interior features: Ceiling fan(s)
- Laundry & utility: Utility room on main level (11 x 8); Gas water heater
Neighborhood map
What this means for you Summary
Snapshot
- This is a 3-bed/1.5-bath single-family listed at $225k.
Deal economics
- At list price, monthly cash flow is $-37 ($-449/yr) — negative.
- To cash-flow at today's rent, offer at most $218k (2.9% below list).
- To meet the 1% rule (rent ≥ 1% of price), the offer needs to be $188k (16.2% below list).
- Recommended offer: $188k (16.2% below list) — sets the bar for 1% rule.
- Cap rate 6.1% vs local median 4.4% in Clayton — top-decile yield for the area; either an underpriced asset or a hidden risk that comps aren't pricing in. Stress-test before assuming the spread holds.
Location & tenants
- Location reads 72/100 on livability (#363 in OH) — a middle-class / working-renter tenant base. Strengths: crime A+, cost of living A+, housing A+; Watch: amenities F, commute F, health & safety F.
- Northmont City (suburban): math 52% / reading 62% proficiency, ranked #318 of 656 in OH (top 48%) — acceptable for families but not a draw, mixed tenant base, ~2y average lease.
- Market conditions: Rents soft (-0.5%/yr); 88 active listings in the ZIP; 9 comparable units currently listed for rent nearby; rentals leasing fast (median 3d on market — plan ~1-2 weeks tenant-placement turnaround); solid renter incomes; 907 units permitted in Montgomery County in 2024 (416 in 5+ unit buildings).
- This rent runs 30% of the median local income ($75k/yr) — at the standard rent-burdened threshold; future hikes will face affordability resistance.
Forward outlook
- Local home prices are declining (-3.0%/yr); year-one equity from $2k of loan paydown is wiped out by about $7k of value loss. Plan a longer hold.
- Montgomery County population projected at -10% by 2050 — secular population decline; favor cash flow + early exit over multi-decade hold.
Negotiation context
- Only 6 days on market — expect competitive offers; lowballing is unlikely to land.
- 3 sale attempts since 10y ago with the ask held roughly flat each time — persistent listings suggest the price (not the market) is what's stuck; bring a comps-based counter.
- Current owner paid $97k; list at $225k implies a 131% gain — meaningful room to come down on a strong offer.
Questions for the listing agent
- What do current leases actually rent for vs. the listed asking? Can we see a recent rent roll and the last 12 months of T-12 income?
- Built in 1971 — when were the roof, HVAC, electrical panel, plumbing, and water heater last replaced?
- Is there a deadline driving the sale (1031 exchange, divorce, estate, relocation)? That informs how much negotiation room exists.
- Schools are B-rated — typically a magnet for longer-tenancy family renters. What's the average tenant stay here, and is there a school-zone premium baked into asking?
- The area grade is low — what's the realistic commute time and amenity access for the typical tenant pool here? Any planned neighborhood developments (good or bad) we should know about?
- What's the average days-on-market for RENTAL listings here right now (not sales)? A rising rental-DOM trend means longer vacancies and softer asking-rent achievability than the comps imply.
- What's the recent tenant-quality profile in this submarket — average credit score on applications, eviction rate, late-payment / NSF rate, and stable-employment percentage? A property-management company in the area should have these aggregated.
- How much new for-sale + rental construction is in the pipeline within 1–3 miles? Heavy new supply typically softens prices + rents 12–24 months out; constrained supply supports both.
Investment metrics
- 1% rule
- 0.84% ✗
- Cap rate
- 6.09%
- Cash-on-cash
- -0.71%
- DSCR
- 0.97
- GRM
- 9.9
CMA / ARV
- ARV (on-the-fly)
- $207,075
- Comps found
- 12
Show comp detail 12 sales within ~0.75 mi
| Address | Dist | Beds/Ba | Sqft | Sold | Price | $/sf | Match |
|---|---|---|---|---|---|---|---|
| 4900 Baldwin Hills Dr | 0.04mi | 3/1.5 | 1,255 (0%) | 1mo | $225,000 | $179 | 97 |
| 6042 Cinnamon Tree Ct | 0.25mi | 3/2.0 | 1,252 (-0%) | 2mo | $169,900 | $136 | 85 |
| 4941 Scothills Dr | 0.09mi | 3/1.5 | 1,255 (0%) | 14mo | $165,000 | $131 | 84 |
| 6055 Layne Hills Ct | 0.32mi | 3/1.5 | 1,255 (0%) | 4mo | $207,000 | $165 | 82 |
| 5071 Seville Dr | 0.19mi | 3/2.0 | 1,374 (+10%) | 2mo | $230,000 | $167 | 72 |
| 6800 Glenhills Dr | 0.14mi | 3/2.0 | 1,348 (+7%) | 10mo | $220,600 | $164 | 70 |
| 4329 Gorman Ave | 0.34mi | 3/2.0 | 1,400 (+12%) | 4mo | $199,000 | $142 | 60 |
| 1976 Swallowtail Ct | 0.67mi | 3/2.0 | 1,228 (-2%) | 6mo | $210,000 | $171 | 58 |
| 605 Rubythroat Ln | 0.62mi | 2/2.0 (-1) | 1,197 (-5%) | 2mo | $189,125 | $158 | 55 |
| 1029 Meadow Thrush Dr | 0.54mi | 3/2.0 | 1,400 (+12%) | 6mo | $248,000 | $177 | 48 |
| 228 Southerly Hills Dr | 0.64mi | 3/2.0 | 1,170 (-7%) | 17mo | $195,000 | $167 | 43 |
| 4655 Rathburn Dr | 0.51mi | 3/2.0 | 1,440 (+15%) | 14mo | $225,000 | $156 | 38 |
Match score weights: distance 35% · size 25% · config 20% · recency 20%. Top-matched comps best support the ARV.
Projected returns pro-forma
-3.0% appreciation · 0.0% rent growth · sell at horizon
- IRR
- -20.8%
- Equity multiple
- 0.30×
- Total profit
- $-44,355
- Equity at exit
- $33,548
- IRR
- -22.8%
- Equity multiple
- 0.00×
- Total profit
- $-62,993
- Equity at exit
- $19,454
Cash invested: $63,000 (down + closing). Projections, not guarantees.
Landlord ↔ Tenant lean methodology
- Overall (STATE)
- 73 Landlord-Friendly
- State Ohio
- 73 Landlord-Friendly · R+6
- County
- — inherits STATE
- City
- — inherits STATE
ZIP-level market 45322
- Rents YoY
- -0.5%
- Active inventory
- 88
- Price-to-rent
- 9.9×
Monthly cashflow live
- Estimated rent
- $1,885 high interval (Pro) →
- Mortgage (P&I)
- −$1,180
- Tax from tax record
- −$253 /mo · $3,032/yr
- Insurance
- −$94
- HOA
- −$0
- Vacancy / Maint / Mgmt
- −$396
- Net cashflow
- $-37
Break-even live
UW: 25.0% down · 7.5% · 30yr · 1.5% tax · 5.0% vac · 8.0% maint · 8.0% mgmt
Financing live
Cash to close
- Down payment
- $56,250
- Closing costs
- $6,750
- Reserves months
- —
- Total cash needed
- —
Loan-product check · same deal, 3 products live
Conventional
25% down · 7.5% · 30yr
- Down + closing
- —
- Monthly P&I
- —
- Monthly cashflow
- —
- DSCR
- —
- Eligible?
- —
Personal DTI + credit; lowest rate.
DSCR
20% down · 8.5% · 30yr
- Down + closing
- —
- Monthly P&I
- —
- Monthly cashflow
- —
- DSCR
- —
- Eligible?
- —
No personal income docs; deal must DSCR.
Hard money
10% down · 12.0% · 12mo
- Down + closing
- —
- Monthly P&I
- —
- Monthly cashflow
- —
- DSCR
- —
- Eligible?
- —
Short-term bridge; refi at stabilization.
Rent comps 9 comps
| Address | Beds | Baths | Sqft | Rent | $/sqft | DOM | Units | Dist |
|---|---|---|---|---|---|---|---|---|
| 5011 Scothills Dr Englewood, OH | 3.0 | 2.0 | 1060 | $1,595 | $1.50 | 3d | 1 | 0.19mi |
| 6844 Union Rd Englewood, OH | 3.0 | 2.0 | 1700 | $2,100 | $1.24 | 3d | 1 | 0.22mi |
| 421 Porter Dr Englewood, OH | 2.0 | 2.0 | 1371 | $1,650 | $1.20 | 14d | 1 | 0.81mi |
| 321 Lauren Circle Dr Englewood, OH | 3.0 | 2.0 | 1400 | $1,700 | $1.21 | 14d | 1 | 0.90mi |
| 4564 Linchmere Dr Dayton, OH | 3.0 | 3.0 | 1096 | $1,595 | $1.46 | 14d | 1 | 1.01mi |
| 5900 Macduff Dr Dayton, OH | 1.0–4.0 | 1.0–2.0 | 1104 | $1,467 | $1.33 | 3d | 17 | 1.10mi |
| 416 W Wenger Rd Englewood, OH | 3.0 | 1.5 | 1249 | $2,000 | $1.60 | 3d | 1 | 1.16mi |
| 778 Union Blvd Englewood, OH | 1.0–2.0 | 1.0–1.5 | 833 | $1,375 | $1.65 | 2d | 5 | 1.34mi |
| 603 Rolice Ct Englewood, OH | 3.0 | 2.0 | 1449 | $2,000 | $1.38 | 21d | 1 | 1.42mi |
Listing history 5 events
-
2026-06-05statusdays on market $225,000 Pending 6 DOM
-
2026-06-03days on market $225,000 Active 5 DOM
-
2026-06-02days on market $225,000 Active 4 DOM
-
2026-06-01days on market $225,000 Active 3 DOM
-
2026-05-31days on market $225,000 Active 2 DOM
ⓘ Source: listings_history table (triggers on properties + properties_extension) + one-shot
backfill from property_details.listing_events for pre-trigger history.
Tax reassessment forecast OH · Partial reset (capped growth)
- Current annual tax
- $3,032 · $253/mo
- Projected year-2 tax
- $3,271 · $273/mo
- Expected delta
- +$239/yr (+$20/mo · 7.9%)
ⓘ Screening estimate from a state-policy table — verify with the county assessor before closing.
Climate risk First Street
- Flood 1/10 Low FEMA zone X (unshaded) · 0% chance over 30 yrs
- Wildfire 1/10 Low
- Heat 3/10 Moderate 7 d/yr ≥101°F today · 18 d/yr by 30 yrs out
- Wind 2/10 Low
- Air quality 3/10 Moderate 3 unhealthy d/yr today · 4 by 30 yrs out
Nearby sold comps map
Loading sold comps map…
Walkable amenities ~0.75 mi
Loading nearby amenities…
Taxation est. · year 1
- Rental income
- $22,617
- − Mortgage interest
- −$12,603
- − Property taxes
- −$3,032
- − Insurance
- −$1,125
- − Repairs & maintenance
- −$1,809
- − Management
- −$1,809
- − Depreciation
- −$6,545
- Taxable loss
- −$4,308
- Est. tax savings @ 24.0%
- +$1,034
- After-tax cash flow
- $585/yr
For passive investors: Depreciation is non-cash, so a rental often shows a tax loss while cash-flowing — sheltering income. Rental losses are passive: they offset passive income freely, and up to $25,000/yr can offset ordinary (W-2) income if you actively participate and your MAGI is under $100k (phasing out to $0 by $150k); unused losses carry forward. On sale, claimed depreciation is recaptured at up to 25%, and gains may owe capital-gains tax (a 1031 exchange can defer both). Figures are a year-1 estimate at your 24.0% rate — not tax advice; consult a CPA.
Schools (NCES district)
- District
- Northmont City
- NCES district ID
- 3904872
- Math proficiency
- 52% ▼ -15.00%
- Reading proficiency
- 62% ▼ -8.00%
- Median HH income
- $60,230
- Composite
- 49.53/100
- National rank
- #1995
- State rank
- #318 of 656 in OH
Livability — Clayton
- Score
- 72/100
- State rank
- #363
- US rank
- #5877
Category grades
Schools grade is shown separately in the Schools card above.
Census & demographics
- Census place
- Clayton, OH
- County
- Montgomery County · 459,541 people
- City population
- 37,953
- Metro
- Dayton-Kettering, OH
- Population (ZIP)
- 20,884
- Household income
- $75,349
- Rent vs Own
- Severe rent burden
- 357.0
Population outlook (Montgomery County) Hauer SSP2
- Today (2025)
- 523,241 people
- By 2030
- 514,948 · -1.6%
- By 2040
- 493,378 · -5.7%
- By 2050
- 469,639 · -10.2%
- By 2075
- 418,360 · -20.0%
- By 2100
- 353,315 · -32.5%
Race, ethnicity, and origin ACS 2023
- Neighborhood character
- Predominantly White (80%)
- Race & ethnicity
- White 80% Black 11% Two or more races 6% Hispanic / Latino 3% Asian 1%
- Common ancestry
- Lithuanian 2% Slovak 2% Romanian 1%
- Foreign-born
- 3% · China, Canada
- Languages at home
- 96% English-only · Spanish 2%
Political lean MEDSL · Montgomery
- 2024 margin
- Toss-up / Even · D 49.8% · R 49.3%
- 2008→2024 swing
- -5.8pp toward R · 2008: 6.2pp · 2024: 0.5pp
- All cycles
- 2024: D+0.5 2020: D+2.2 2016: R+1.2 2012: D+3.1 2008: D+6.2
Not yet ingested
- Civics
- —
Market trends
- HPI YoY
- ▼ -176.42%
- Current HPI
- 218.5409
- Rent YoY
- ▼ -0.45%
- Metro
- Dayton-Kettering, OH
- State GDP YoY
- ▲ 1.98%
- F500 in state
- 48
Industry mix (Fortune 500 HQ in OH)
| Industry | F500 HQs | Revenue |
|---|---|---|
| Insurance | 3 | $145B |
|
||
| Industrial Machinery | 3 | $49B |
|
||
| Financial Services | 3 | $24B |
|
||
| Consumer Goods | 2 | $93B |
|
||
| Aerospace / Defense | 2 | $47B |
|
||
| Utilities | 2 | $33B |
|
||
Price history
+164.7% since first listed16 events — show timeline
- 2026-05-29 Listed $225,000 Dayton MLS
- 2017-04-13 Sold (Public Records) $97,300 Public Records
- 2017-03-31 Sold (MLS) $97,300 Dayton MLS
- 2017-03-31 Sold (MLS) $97,300 Dayton MLS
- 2017-03-16 Pending — Dayton MLS
- 2017-03-02 Contingent — Dayton MLS
- 2017-03-01 Listed $99,900 Dayton MLS
- 2017-01-20 Listing Removed — Dayton MLS
- 2016-07-27 Price Changed $104,900 Dayton MLS
- 2016-07-15 Price Changed $107,900 Dayton MLS
- 2016-06-15 Listed $109,900 Dayton MLS
- 2004-09-13 Sold (Public Records) $109,900 Public Records
- 2004-02-05 Sold (Public Records) $108,500 Public Records
- 2002-07-23 Sold (Public Records) $92,400 Public Records
- 1999-08-02 Sold (Public Records) $91,000 Public Records
- 1994-04-26 Sold (Public Records) $85,000 Public Records
Property tax history
+2.8%/yrLatest (2025): $3,032 · +5.6% YoY. Source: county tax records.
Cash-flow waterfall
monthlySold comps — $/sqft
last 12 mo · ≤1 miLoading sold comps…