 6-Plex
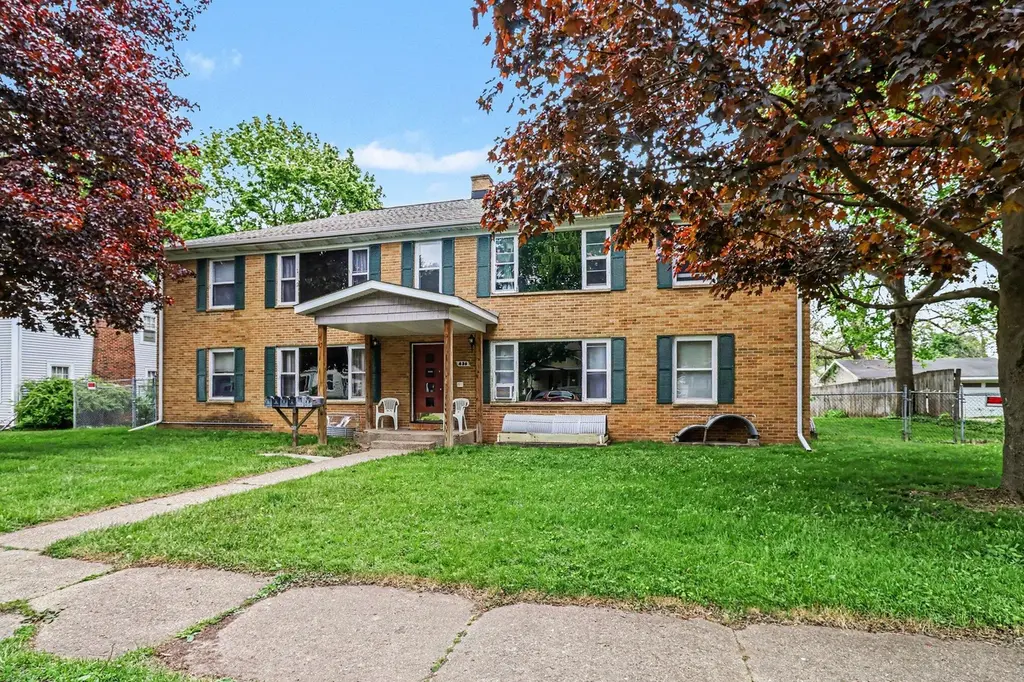
436 Campbell Ave · Westwood, MI
Flood risk 1/10 · Minimal
- FEMA flood zone
- X
- Chance of flooding over 30 yrs
- 0.0%
- Est. flood insurance / yr
- $435 – $905
Fire risk 1/10 · Minimal
- Est. fire insurance / yr
- $784 – $1,456
Heat risk 2/10 · Minimal
- Hot days now (above threshold)
- 7 days/yr
- Hot days in 30 yrs
- 16 days/yr
Wind risk No data
- Chance of severe wind over 30 yrs
- —
Air-quality risk 2/10 · Minimal
- Unhealthy air days now
- 1 days/yr
- Unhealthy air days in 30 yrs
- 2 days/yr
Risk factors via First Street. Map © Google.
Why this score? — see what drove the B grade
The composite is a weighted blend of 9 inputs, each scored 0–100. Each bar is that input's sub-score; the figure is the points it added to the 100-point composite (weight × sub-score).
- Cash flow +30.0/30.0
- 1% rule +10.0/10.0
- DSCR +10.0/10.0
- ARV discount +7.5/15.0
- Schools +4.7/10.0
- Livability +4.0/5.0
- Rent growth +3.3/5.0
- Condition / age +2.5/5.0
- Appreciation +0.0/10.0
$407,000
🖨 Deal sheet 📄 Offer letter ✓ Due diligence
Multi-family units
County records classify this as Multi-Family (5+ Unit). Listing-text estimate: 6 units. confirmed
5+ unit building — per-unit beds/baths from public records are typically unavailable; the breakdown below (if shown) is an estimate from the listing text.
Listing remarks MLS
Unique 6 unit apartment building off West Main Street. All brick two-story structure with large rear parking area. Carports offer covered parking 3 or 4 vehicles. Units are large and spacious with many recent updates. Units include five 2-bedroom units and one studio unit. Located in excellent residential neighborhood. See Broker for financial information and history.
Key facts
- Recent updates
- Covered parking
- 0.3 acre lot
Tags
Property features AI
Finance
- Financial info: Income property with multiple unit types and listed rents (examples shown: $830 per unit type)
Exterior
- Parking: Total of 10 parking spaces; Carport parking available
- Utilities: Public water; Public sewer; Electricity connected; Natural gas connected
- Home design: Residential income property (multi-family)
- Construction: Block and brick construction; Built on a lot approximately 0.3 acres (100 x 132)
- Exterior features: Paved road access; Publicly maintained road; Asphalt/paved parking areas; Property parking lot with best access from Campbell or West Main/Dartmouth/Commonwealth
Interior
- Bedrooms: Multiple 2-bedroom units; Some 1-bedroom (studio/1 BR) units
- Bathrooms: 1 bathroom per unit (units listed are 1-bath)
- Heating & cooling: Hot water heating; Radiant heating; Natural gas heating
- Interior features: Basement with walk-out access and daylight exposure; Common-area laundry in the basement; Sidewalks in the community
- Laundry & utility: Common-area laundry located in the basement
Neighborhood map
What this means for you Summary
Snapshot
- This is a 5×2bd/1ba + 1×1bd/1ba units multifamily listed at $407k.
Deal economics
- At list price, monthly cash flow is $2k ($27k/yr) — positive. Per door: $374/mo.
- The deal already cash-flows at list — no discount required.
- Meets the 1% rule at list price ($6k rent vs $407k).
- Cap rate 12.9% vs local median 3.3% in Westwood — top-decile yield for the area; either an underpriced asset or a hidden risk that comps aren't pricing in. Stress-test before assuming the spread holds.
Location & tenants
- Location reads 80/100 on livability (#75 in MI, #1,649 nationally) — a professional / high-income tenant draw. Strengths: schools A+, cost of living A+, housing A+; Watch: amenities F, commute F.
- Kalamazoo Public Schools (urban): math 43% / reading 72% proficiency, ranked #71 of 540 in MI (top 13%) — acceptable for families but not a draw, mixed tenant base, ~2y average lease; 66% free/reduced lunch — lower-income household profile, screen leases tightly.
- Market conditions: Rents rising (+3.4%/yr); 105 active listings in the ZIP; lower-income renter base — watch delinquency; 339 units permitted in Kalamazoo County in 2024 (22 in 5+ unit buildings).
- At $6,398/mo this rent would consume 176% of the median local household income ($44k/yr) (locally 2581% of renters already pay >50% of income on rent) — very limited rent-growth headroom before tenants either downsize or default.
Forward outlook
- Local home prices are declining (-3.0%/yr); year-one equity from $3k of loan paydown is wiped out by about $12k of value loss. Plan a longer hold.
- Kalamazoo County population projected at +18% by 2050 — long-run rental-demand tailwind backs the buy-and-hold thesis.
- At projected returns (-3.0% appreciation + 3.4% rent growth), your $114k cash investment doubles in ~6 years — after that, you're playing with house money.
Negotiation context
- Only 10 days on market — expect competitive offers; lowballing is unlikely to land.
- 13 sale attempts since 24y ago with the ask held roughly flat each time — persistent listings suggest the price (not the market) is what's stuck; bring a comps-based counter.
- Current owner paid $270k; list at $407k implies a 51% gain — meaningful room to come down on a strong offer.
Questions for the listing agent
- Can we see the unit-by-unit rent roll, current vacancy, and any below-market leases? What's the average tenancy length?
- What capital expenditures (roof, boiler, parking lot, exteriors) have been made in the last 5 years, and what's planned in the next 2?
- Built in 1960 — when were the roof, HVAC, electrical panel, plumbing, and water heater last replaced?
- Is there a deadline driving the sale (1031 exchange, divorce, estate, relocation)? That informs how much negotiation room exists.
- Schools are A-rated — typically a magnet for longer-tenancy family renters. What's the average tenant stay here, and is there a school-zone premium baked into asking?
- What's the average days-on-market for RENTAL listings here right now (not sales)? A rising rental-DOM trend means longer vacancies and softer asking-rent achievability than the comps imply.
- What's the recent tenant-quality profile in this submarket — average credit score on applications, eviction rate, late-payment / NSF rate, and stable-employment percentage? A property-management company in the area should have these aggregated.
- How much new apartment / multifamily construction is in the pipeline within 1–3 miles? Heavy new supply (>2% of stock underway) typically softens rents 12–24 months out; light construction supports rent growth.
Investment metrics
- 1% rule
- 1.57% ✓
- Cap rate
- 12.90%
- Cash-on-cash
- 23.61%
- DSCR
- 2.05
- GRM
- 5.3
CMA / ARV
No comps found within radius.
Projected returns pro-forma
-3.0% appreciation · 3.39% rent growth · sell at horizon
- IRR
- 17.2%
- Equity multiple
- 1.70×
- Total profit
- $79,443
- Equity at exit
- $60,685
- IRR
- 26.0%
- Equity multiple
- 3.32×
- Total profit
- $263,842
- Equity at exit
- $35,190
Cash invested: $113,960 (down + closing). Projections, not guarantees.
Landlord ↔ Tenant lean methodology
- Overall (STATE)
- 62 Landlord-Friendly
- State Michigan
- 62 Landlord-Friendly · EVEN
- County
- — inherits STATE
- City
- — inherits STATE
ZIP-level market 49006
- Rents YoY
- 3.4%
- Active inventory
- 105
- Price-to-rent
- 31.3×
Monthly cashflow live
- Estimated rent
- $6,398 high interval (Pro) →
- Mortgage (P&I)
- −$2,134
- Tax est. 1.5%
- −$509 /mo · $6,105/yr
- Insurance
- −$170
- HOA
- −$0
- Vacancy / Maint / Mgmt
- −$1,344
- Net cashflow
- $2,242
Break-even live
6-unit breakdown (identical units grouped — click to expand)
| Units | Beds | Baths | Est. rent |
|---|---|---|---|
| 5× units | 2 | 1 | $5,420 |
| #1 | 2 | 1 | $1,084 |
| #2 | 2 | 1 | $1,084 |
| #3 | 2 | 1 | $1,084 |
| #4 | 2 | 1 | $1,084 |
| #5 | 2 | 1 | $1,084 |
| 1× unit | 1 | 1 | $977 |
| Total (6 units) | $6,398 | ||
UW: 25.0% down · 7.5% · 30yr · 1.5% tax · 5.0% vac · 8.0% maint · 8.0% mgmt
Financing live
Cash to close
- Down payment
- $101,750
- Closing costs
- $12,210
- Reserves months
- —
- Total cash needed
- —
Loan-product check · same deal, 3 products live
Conventional
25% down · 7.5% · 30yr
- Down + closing
- —
- Monthly P&I
- —
- Monthly cashflow
- —
- DSCR
- —
- Eligible?
- —
Personal DTI + credit; lowest rate.
DSCR
20% down · 8.5% · 30yr
- Down + closing
- —
- Monthly P&I
- —
- Monthly cashflow
- —
- DSCR
- —
- Eligible?
- —
No personal income docs; deal must DSCR.
Hard money
10% down · 12.0% · 12mo
- Down + closing
- —
- Monthly P&I
- —
- Monthly cashflow
- —
- DSCR
- —
- Eligible?
- —
Short-term bridge; refi at stabilization.
Listing history 11 events
-
2026-06-13status $407,000 Pending 10 DOM
-
2026-06-10days on market $407,000 Active 10 DOM
-
2026-06-09days on market $407,000 Active 9 DOM
-
2026-06-08days on market $407,000 Active 8 DOM
-
2026-06-07days on market $407,000 Active 7 DOM
-
2026-06-05days on market $407,000 Active 4 DOM
-
2026-06-03days on market $407,000 Active 3 DOM
-
2026-06-02days on market $407,000 Active 2 DOM
-
2026-06-01remarks 572-char remark
-
2026-06-01remarks 371-char remark
-
2026-06-01$407,000 Active 1 DOM
ⓘ Source: listings_history table (triggers on properties + properties_extension) + one-shot
backfill from property_details.listing_events for pre-trigger history.
Climate risk First Street
- Flood 1/10 Low FEMA zone X · 0% chance over 30 yrs
- Wildfire 1/10 Low
- Heat 2/10 Low
- Air quality 2/10 Low 1 unhealthy d/yr today · 2 by 30 yrs out
Nearby sold comps map
Loading sold comps map…
Walkable amenities ~0.75 mi
Loading nearby amenities…
Taxation est. · year 1
- Rental income
- $76,776
- − Mortgage interest
- −$22,798
- − Property taxes
- −$6,105
- − Insurance
- −$2,035
- − Repairs & maintenance
- −$6,142
- − Management
- −$6,142
- − Depreciation
- −$11,840
- Taxable income
- $21,714
- Est. tax owed @ 24.0%
- −$5,211
- After-tax cash flow
- $21,690/yr
For passive investors: Depreciation is non-cash, so a rental often shows a tax loss while cash-flowing — sheltering income. Rental losses are passive: they offset passive income freely, and up to $25,000/yr can offset ordinary (W-2) income if you actively participate and your MAGI is under $100k (phasing out to $0 by $150k); unused losses carry forward. On sale, claimed depreciation is recaptured at up to 25%, and gains may owe capital-gains tax (a 1031 exchange can defer both). Figures are a year-1 estimate at your 24.0% rate — not tax advice; consult a CPA.
Schools (NCES district)
- District
- Kalamazoo Public Schools
- NCES district ID
- 2619950
- Math proficiency
- 43% ▲ 13.00%
- Reading proficiency
- 72% ▲ 33.00%
- Median HH income
- $35,291
- Composite
- 47.48/100
- National rank
- #2275
- State rank
- #71 of 540 in MI
Livability — Westwood
- Score
- 80/100
- State rank
- #75
- US rank
- #1649
Category grades
Schools grade is shown separately in the Schools card above.
Census & demographics
- Census place
- Westwood, MI
- County
- Kalamazoo County · 224,317 people
- City population
- 25,888
- Metro
- Kalamazoo-Portage, MI
- Population (ZIP)
- 26,507
- Household income
- $43,639
- Rent vs Own
- Severe rent burden
- 2581.0
Population outlook (Kalamazoo County) Hauer SSP2
- Today (2025)
- 280,982 people
- By 2030
- 292,068 · +3.9%
- By 2040
- 312,191 · +11.1%
- By 2050
- 331,196 · +17.9%
- By 2075
- 379,021 · +34.9%
- By 2100
- 396,579 · +41.1%
Race, ethnicity, and origin ACS 2023
- Neighborhood character
- Diverse neighborhood (Simpson 0.55)
- Race & ethnicity
- White 65% Black 14% Two or more races 10% Hispanic / Latino 9% Asian 4%
- Hispanic origin (detail)
- Mexican 6%
- Common ancestry
- Iranian 6% Romanian 4% Italian 3%
- Foreign-born
- 9% · Canada, South Korea, China
- Languages at home
- 89% English-only · Spanish 5% Other Indo-European 2% French/Haitian/Cajun 2%
Political lean MEDSL · Kalamazoo
- 2024 margin
- D (+17.7) · D 58.0% · R 40.3% · Other 1.7%
- 2008→2024 swing
- -1.8pp toward R · 2008: 19.5pp · 2024: 17.7pp
- All cycles
- 2024: D+17.7 2020: D+18.7 2016: D+12.8 2012: D+13.3 2008: D+19.5
Not yet ingested
- Civics
- —
Market trends
- HPI YoY
- ▼ -235.52%
- Current HPI
- 243.4367
- Rent YoY
- ▲ 3.39%
- Metro
- Kalamazoo-Portage, MI
- State GDP YoY
- ▲ 1.37%
- F500 in state
- 28
Industry mix (Fortune 500 HQ in MI)
| Industry | F500 HQs | Revenue |
|---|---|---|
| Automotive Parts | 3 | $48B |
|
||
| Automotive | 2 | $372B |
|
||
| Chemicals | 1 | $45B |
|
||
| Automotive Retail | 1 | $29B |
|
||
| Healthcare / Medical Devices | 1 | $23B |
|
||
| Automotive Technology | 1 | $20B |
|
||
Price history
+99.6% since first listed25 events — show timeline
- 2026-05-30 Listed $407,000 REALCOMP
- 2026-05-30 Listed $407,000 MiRealSource-MiMLS
- 2018-04-25 Sold (MLS) $270,000 SW Michigan MLS
- 2018-04-25 Sold (MLS) $270,000 REALCOMP
- 2018-03-15 Pending — SW Michigan MLS
- 2018-03-08 Relisted — SW Michigan MLS
- 2018-02-15 Pending — SW Michigan MLS
- 2017-12-23 Listed $274,000 SW Michigan MLS
- 2017-12-23 Listed $274,000 REALCOMP
- 2014-12-24 Listing Removed — SW Michigan MLS
- 2014-12-23 Listing Removed — SW Michigan MLS
- 2014-10-20 Listing Removed — SW Michigan MLS
- 2014-09-15 Listing Removed — SW Michigan MLS
- 2014-09-15 Listing Removed — SW Michigan MLS
- 2011-02-07 Listed $249,000 SW Michigan MLS
- 2010-02-02 Listed $275,000 SW Michigan MLS
- 2007-11-05 Listed $299,000 SW Michigan MLS
- 2007-01-24 Sold (MLS) $337,000 SW Michigan MLS
- 2006-08-16 Listed $349,000 SW Michigan MLS
- 2006-01-23 Listed $349,000 SW Michigan MLS
- 2006-01-23 Listed $349,000 SW Michigan MLS
- 2004-06-01 Sold (MLS) $275,000 SW Michigan MLS
- 2004-03-18 Listed $274,900 SW Michigan MLS
- 2003-01-31 Sold (MLS) $205,200 SW Michigan MLS
- 2002-12-06 Listed $203,900 SW Michigan MLS
Cash-flow waterfall
monthlySold comps — $/sqft
last 12 mo · ≤1 miLoading sold comps…