 5-Plex
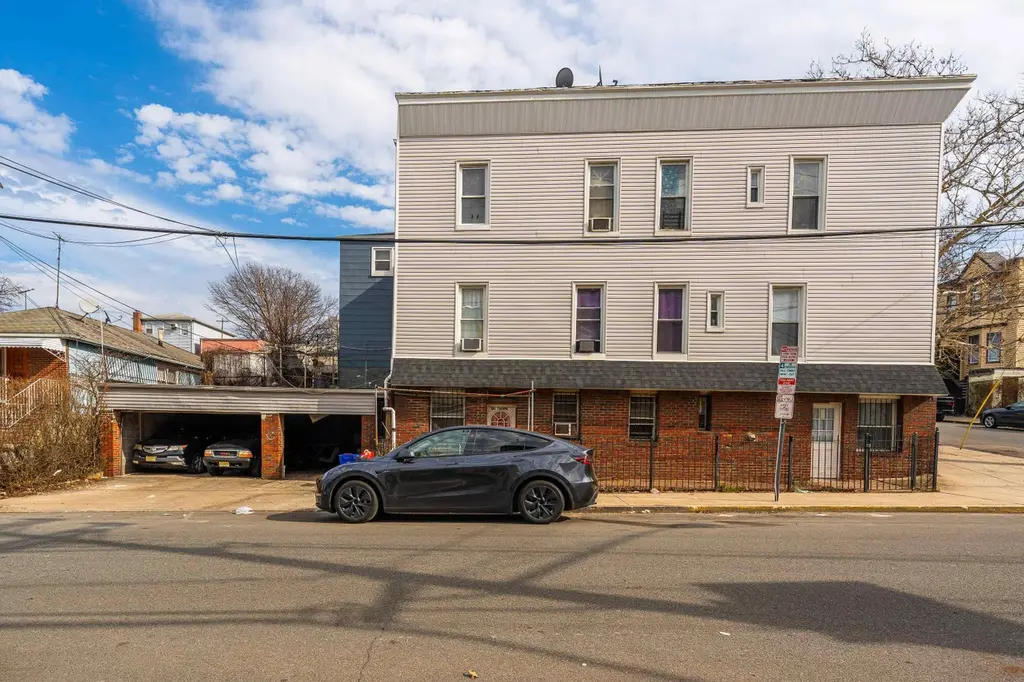
180 THORNE St · Jersey City, NJ
Flood risk 1/10 · Minimal
- FEMA flood zone
- X (unshaded)
- Chance of flooding over 30 yrs
- 0.0%
- Est. flood insurance / yr
- $473 – $860
Fire risk 1/10 · Minimal
- Est. fire insurance / yr
- $526 – $976
Heat risk 7/10 · Major
- Hot days now (above 98°F)
- 7 days/yr
- Hot days in 30 yrs
- 14 days/yr
Wind risk 6/10 · Moderate
- Chance of severe wind over 30 yrs
- 27.0%
Air-quality risk 3/10 · Minor
- Unhealthy air days now
- 3 days/yr
- Unhealthy air days in 30 yrs
- 4 days/yr
Risk factors via First Street. Map © Google.
Why this score? — see what drove the C- grade
The composite is a weighted blend of 9 inputs, each scored 0–100. Each bar is that input's sub-score; the figure is the points it added to the 100-point composite (weight × sub-score).
- Cash flow +19.5/30.0
- ARV discount +7.5/15.0
- DSCR +6.1/10.0
- 1% rule +4.9/10.0
- Livability +3.9/5.0
- Rent growth +3.3/5.0
- Condition / age +2.5/5.0
- Schools +2.4/10.0
- Appreciation +0.0/10.0
$1,299,000
🖨 Deal sheet 📄 Offer letter ✓ Due diligence
Multi-family units
County records classify this as Multi-Family (5+ Unit). Listing-text estimate: 5 units. confirmed
5+ unit building — per-unit beds/baths from public records are typically unavailable; the breakdown below (if shown) is an estimate from the listing text.
Listing remarks
Turn-key investment opportunity! Legal 5-family corner property with strong income-producing potential. The building consists of four (4) 1-bedroom, 1-bathroom units and one (1) spacious 3-bedroom, 1-bathroom unit, offering a desirable mix that appeals to a variety of tenants. All utilities are separately metered, helping reduce owner expenses and simplify property management. The property is equipped with gas baseboard heating in all units. Additional features include a garage and parking for up to 3 vehicles. Situated on a desirable corner lot with convenient access to transportation, shopping, and local amenities. Ideal for investors seeking consistent cash flow, low operating expenses,
Key facts
- Multi-family asset
- Local amenities
- Corner lot
Tags
Property features AI
Finance
- Other: Lot number 23
Exterior
- Parking: Detached garage with space for 3+ cars
- Home design: Multi-unit property (multiple kitchens and living rooms)
- Construction: Lead paint form: Yes
- Exterior features: Aluminum/Vinyl and stucco exterior
Interior
- Kitchen: Kitchens included in each unit
- Bedrooms: Three bedrooms in the basement unit; One bedroom on each of Levels 1, 2, 3 and 4
- Bathrooms: Five full bathrooms (one per unit)
- Heating & cooling: Window A/C units; Baseboard heating; Gas heating
- Interior features: Unfinished basement; Five kitchens (one per unit); Five living rooms (one per unit); Five other rooms (total)
Neighborhood map
What this means for you Summary
Snapshot
- This is a 4×1bd/1.0ba + 1×3bd/1.0ba units multifamily listed at $1.30M.
Deal economics
- At list price, monthly cash flow is $1k ($18k/yr) — positive. Per door: $292/mo.
- The deal already cash-flows at list — no discount required.
- To meet the 1% rule (rent ≥ 1% of price), the offer needs to be $1.28M (1.2% below list).
- Recommended offer: $1.18M (9.0% below list) — sets the bar for market timing.
- Cap rate 7.6% vs local median 1.8% in Jersey City — top-decile yield for the area; either an underpriced asset or a hidden risk that comps aren't pricing in. Stress-test before assuming the spread holds.
Location & tenants
- Location reads 77/100 on livability (#116 in NJ, #2,955 nationally) — a middle-class / working-renter tenant base. Strengths: amenities A+, commute A+, employment A+; Watch: crime F, cost of living F.
- Jersey City Public Schools (urban): math 16% / reading 38% proficiency, ranked #369 of 472 in NJ (top 78%) — low school quality limits family demand, transient renter base, plan for 1-2y turnover; 69% free/reduced lunch — lower-income household profile, screen leases tightly.
- Market conditions: Rents rising (+3.0%/yr); 287 active listings in the ZIP; solid renter incomes; 5,310 units permitted in Hudson County in 2024 (4,154 in 5+ unit buildings).
- At $12,829/mo this rent would consume 185% of the median local household income ($83k/yr) (locally 2550% of renters already pay >50% of income on rent) — very limited rent-growth headroom before tenants either downsize or default.
Forward outlook
- Local home prices are declining (-3.0%/yr); year-one equity from $9k of loan paydown is wiped out by about $39k of value loss. Plan a longer hold.
- Hudson County population projected at +29% by 2050 — long-run rental-demand tailwind backs the buy-and-hold thesis.
Negotiation context
- It's been on market 94 days — a 9% lower offer ($1.18M) is reasonable based on typical stale-listing flexibility.
- Current owner paid $180k; list at $1.30M implies a 623% gain — meaningful room to come down on a strong offer.
Risks & watch-outs
- Watch-outs: built in 1890 — expect roof / HVAC / electrical / plumbing capex.
- Climate carrying-cost: major wind risk, 27% chance of damaging wind over 30y; extreme-heat days projected 7→14/yr by 2055 (HVAC capex compounding) — expect insurance premiums to compound above CPI over the hold.
Questions for the listing agent
- It's been on market 94 days. Have you received any prior offers? Is the seller open to a 9% concession, seller financing, or rate buy-down credit?
- Can we see the unit-by-unit rent roll, current vacancy, and any below-market leases? What's the average tenancy length?
- What capital expenditures (roof, boiler, parking lot, exteriors) have been made in the last 5 years, and what's planned in the next 2?
- Built in 1890 — when were the roof, HVAC, electrical panel, plumbing, and water heater last replaced?
- Why hasn't it sold? Are there any deal-killer items the seller is aware of (foundation, flood, title, zoning, code violations)?
- Is there a deadline driving the sale (1031 exchange, divorce, estate, relocation)? That informs how much negotiation room exists.
- Schools are B-rated — typically a magnet for longer-tenancy family renters. What's the average tenant stay here, and is there a school-zone premium baked into asking?
- Crime grade is F in this area — have there been break-ins, vandalism, or insurance claims at this property in the last 3 years? What carrier currently insures it and at what premium?
- What's the average days-on-market for RENTAL listings here right now (not sales)? A rising rental-DOM trend means longer vacancies and softer asking-rent achievability than the comps imply.
- What's the recent tenant-quality profile in this submarket — average credit score on applications, eviction rate, late-payment / NSF rate, and stable-employment percentage? A property-management company in the area should have these aggregated.
- How much new apartment / multifamily construction is in the pipeline within 1–3 miles? Heavy new supply (>2% of stock underway) typically softens rents 12–24 months out; light construction supports rent growth.
Investment metrics
- 1% rule
- 0.99% ✗
- Cap rate
- 7.64%
- Cash-on-cash
- 4.82%
- DSCR
- 1.21
- GRM
- 8.4
CMA / ARV
No comps found within radius.
Projected returns pro-forma
-3.0% appreciation · 3.04% rent growth · sell at horizon
- IRR
- -8.7%
- Equity multiple
- 0.68×
- Total profit
- $-116,837
- Equity at exit
- $193,685
- IRR
- 0.8%
- Equity multiple
- 1.06×
- Total profit
- $20,333
- Equity at exit
- $112,314
Cash invested: $363,720 (down + closing). Projections, not guarantees.
Landlord ↔ Tenant lean methodology
- Overall (CITY)
- 6 Strongly Tenant-Friendly
- State New Jersey
- 21 Tenant-Leaning · D+6
- County
- — inherits STATE
- City Jersey City
- 6 Strongly Tenant-Friendly · D+34
ZIP-level market 07307
- Rents YoY
- 3.0%
- Active inventory
- 287
- Price-to-rent
- 44.2×
Monthly cashflow live
- Estimated rent
- $12,829 high interval (Pro) →
- Mortgage (P&I)
- −$6,812
- Tax from tax record
- −$1,319 /mo · $15,831/yr
- Insurance
- −$541
- HOA
- −$0
- Vacancy / Maint / Mgmt
- −$2,694
- Net cashflow
- $1,462
Break-even live
5-unit breakdown (identical units grouped — click to expand)
| Units | Beds | Baths | Est. rent |
|---|---|---|---|
| 4× units | 1 | 1 | $9,796 |
| #1 | 1 | 1 | $2,449 |
| #2 | 1 | 1 | $2,449 |
| #3 | 1 | 1 | $2,449 |
| #4 | 1 | 1 | $2,449 |
| 1× unit | 3 | 1 | $3,034 |
| Total (5 units) | $12,829 | ||
UW: 25.0% down · 7.5% · 30yr · 1.5% tax · 5.0% vac · 8.0% maint · 8.0% mgmt
Financing live
Cash to close
- Down payment
- $324,750
- Closing costs
- $38,970
- Reserves months
- —
- Total cash needed
- —
Loan-product check · same deal, 3 products live
Conventional
25% down · 7.5% · 30yr
- Down + closing
- —
- Monthly P&I
- —
- Monthly cashflow
- —
- DSCR
- —
- Eligible?
- —
Personal DTI + credit; lowest rate.
DSCR
20% down · 8.5% · 30yr
- Down + closing
- —
- Monthly P&I
- —
- Monthly cashflow
- —
- DSCR
- —
- Eligible?
- —
No personal income docs; deal must DSCR.
Hard money
10% down · 12.0% · 12mo
- Down + closing
- —
- Monthly P&I
- —
- Monthly cashflow
- —
- DSCR
- —
- Eligible?
- —
Short-term bridge; refi at stabilization.
Listing history 22 events
-
2026-06-18days on market $1,299,000 Active 94 DOM
-
2026-06-17days on market $1,299,000 Active 93 DOM
-
2026-06-16days on market $1,299,000 Active 92 DOM
-
2026-06-15days on market $1,299,000 Active 91 DOM
-
2026-06-13days on market $1,299,000 Active 89 DOM
-
2026-06-13days on market $1,299,000 Active 88 DOM
-
2026-06-09days on market $1,299,000 Active 85 DOM
-
2026-06-08days on market $1,299,000 Active 84 DOM
-
2026-06-07days on market $1,299,000 Active 83 DOM
-
2026-06-04days on market $1,299,000 Active 80 DOM
-
2026-06-03days on market $1,299,000 Active 79 DOM
-
2026-06-02days on market $1,299,000 Active 78 DOM
-
2026-06-01days on market $1,299,000 Active 77 DOM
-
2026-05-31days on market $1,299,000 Active 76 DOM
-
2026-03-16$1,299,000 Active
-
2023-07-27soldstatus $179,747
-
1996-02-20soldstatus $130,000
-
1986-01-10soldstatus $50,000
-
1984-11-01soldstatus $50,000
-
1984-04-01soldstatus $33,000
-
1984-01-01soldstatus $30,000
-
1981-11-01soldstatus $25,000
ⓘ Source: listings_history table (triggers on properties + properties_extension) + one-shot
backfill from property_details.listing_events for pre-trigger history.
Tax reassessment forecast NJ · Partial reset (capped growth)
- Current annual tax
- $15,831 · $1,319/mo
- Projected year-2 tax
- $24,088 · $2,007/mo
- Expected delta
- +$8,257/yr (+$688/mo · 52.2%)
ⓘ Screening estimate from a state-policy table — verify with the county assessor before closing.
Climate risk First Street
- Flood 1/10 Low FEMA zone X (unshaded) · 0% chance over 30 yrs
- Wildfire 1/10 Low
- Heat 7/10 Severe 7 d/yr ≥98°F today · 14 d/yr by 30 yrs out
- Wind 6/10 Major 27% chance of damaging wind over 30 yrs
- Air quality 3/10 Moderate 3 unhealthy d/yr today · 4 by 30 yrs out
Nearby sold comps map
Loading sold comps map…
Walkable amenities ~0.75 mi
Loading nearby amenities…
Taxation est. · year 1
- Rental income
- $153,948
- − Mortgage interest
- −$72,764
- − Property taxes
- −$15,831
- − Insurance
- −$6,495
- − Repairs & maintenance
- −$12,316
- − Management
- −$12,316
- − Depreciation
- −$37,789
- Taxable loss
- −$3,563
- Est. tax savings @ 24.0%
- +$855
- After-tax cash flow
- $18,403/yr
For passive investors: Depreciation is non-cash, so a rental often shows a tax loss while cash-flowing — sheltering income. Rental losses are passive: they offset passive income freely, and up to $25,000/yr can offset ordinary (W-2) income if you actively participate and your MAGI is under $100k (phasing out to $0 by $150k); unused losses carry forward. On sale, claimed depreciation is recaptured at up to 25%, and gains may owe capital-gains tax (a 1031 exchange can defer both). Figures are a year-1 estimate at your 24.0% rate — not tax advice; consult a CPA.
Schools (NCES district)
- District
- Jersey City Public Schools
- NCES district ID
- 3407830
- Math proficiency
- 16% ▼ -17.00%
- Reading proficiency
- 38% ▼ -11.00%
- Median HH income
- $58,431
- Composite
- 24.43/100
- National rank
- #7678
- State rank
- #369 of 472 in NJ
Livability — Jersey City
- Score
- 77/100
- State rank
- #116
- US rank
- #2955
Category grades
Schools grade is shown separately in the Schools card above.
Census & demographics
- Census place
- Jersey City, NJ
- County
- Hudson County · 718,323 people
- City population
- 294,078
- Metro
- New York-Newark-Jersey City, NY-NJ-PA
- Population (ZIP)
- 42,645
- Household income
- $83,297
- Rent vs Own
- Severe rent burden
- 2550.0
Population outlook (Hudson County) Hauer SSP2
- Today (2025)
- 771,834 people
- By 2030
- 818,028 · +6.0%
- By 2040
- 907,866 · +17.6%
- By 2050
- 994,480 · +28.8%
- By 2075
- 1,163,301 · +50.7%
- By 2100
- 1,254,703 · +62.6%
Race, ethnicity, and origin ACS 2023
- Neighborhood character
- Diverse neighborhood (Simpson 0.69)
- Race & ethnicity
- Hispanic / Latino 42% White 27% Asian 24% Two or more races 18% Black 5%
- Hispanic origin (detail)
- Mexican 3% Puerto Rican 12% Cuban 2% Dominican 9% Salvadoran 1%
- Common ancestry
- Romanian 2% Scotch-Irish 1%
- Foreign-born
- 43% · Canada, Jamaica, China
- Languages at home
- 41% English-only · Spanish 32% Other Indo-European 16% Other Asian/Pacific 4%
Political lean MEDSL · Hudson
- 2024 margin
- Strong D (+28.1) · D 62.6% · R 34.6% · Other 2.8%
- 2008→2024 swing
- -18.7pp toward R · 2008: 46.7pp · 2024: 28.1pp
- All cycles
- 2024: D+28.1 2020: D+46.2 2016: D+51.8 2012: D+55.7 2008: D+46.7
Not yet ingested
- Civics
- —
Market trends
- HPI YoY
- ▼ -271.12%
- Current HPI
- 471.33
- Rent YoY
- ▲ 3.04%
- Metro
- New York-Newark-Jersey City, NY-NJ-PA
- State GDP YoY
- ▲ 2.05%
- F500 in state
- 34
Industry mix (Fortune 500 HQ in NJ)
| Industry | F500 HQs | Revenue |
|---|---|---|
| Consumer Goods | 3 | $31B |
|
||
| Pharmaceuticals | 2 | $153B |
|
||
| Technology | 2 | $21B |
|
||
| Insurance | 2 | $20B |
|
||
| Healthcare | 2 | $19B |
|
||
| Financial Services | 1 | $70B |
|
||
Price history
+5096.0% since first listed8 events — show timeline
- 2026-03-16 Listed $1,299,000 HCMLS
- 2023-07-27 Sold (Public Records) $179,747 Public Records
- 1996-02-20 Sold (Public Records) $130,000 Public Records
- 1986-01-10 Sold (Public Records) $50,000 Public Records
- 1984-11-01 Sold (Public Records) $50,000 Public Records
- 1984-04-01 Sold (Public Records) $33,000 Public Records
- 1984-01-01 Sold (Public Records) $30,000 Public Records
- 1981-11-01 Sold (Public Records) $25,000 Public Records
Property tax history
+4.5%/yrLatest (2025): $15,831 · +4.6% YoY. Source: county tax records.
Cash-flow waterfall
monthlySold comps — $/sqft
last 12 mo · ≤1 miLoading sold comps…