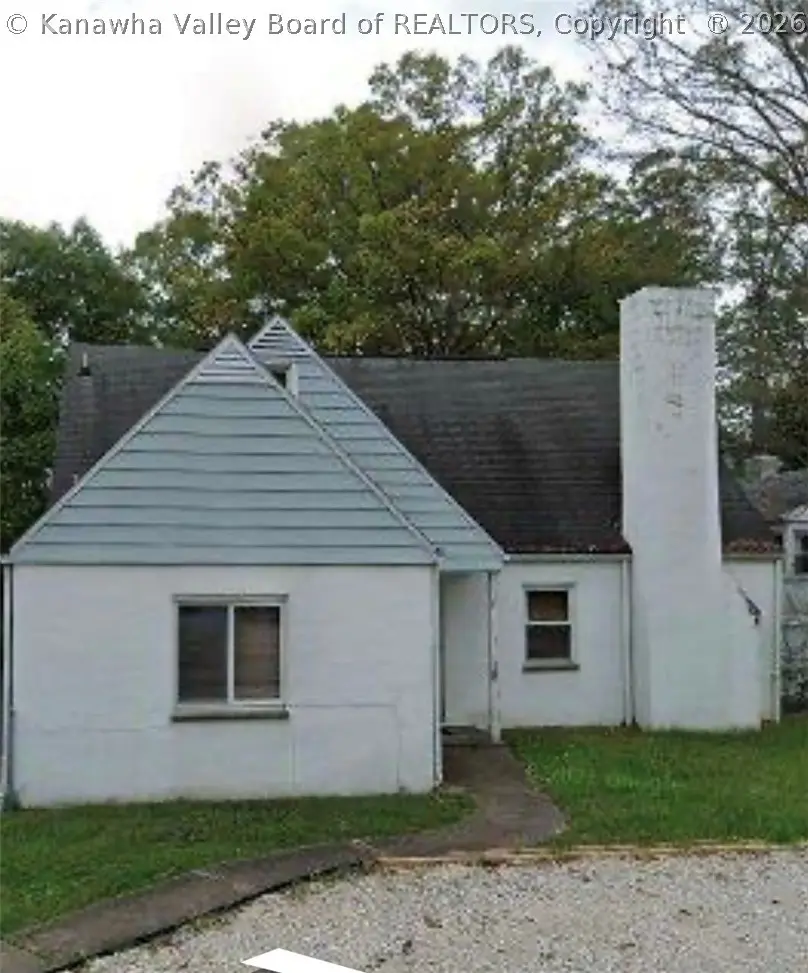
813 Churchill Dr · Charleston, WV
Flood risk 1/10 · Minimal
- FEMA flood zone
- X (unshaded)
- Chance of flooding over 30 yrs
- 0.0%
- Est. flood insurance / yr
- $473 – $860
Fire risk 1/10 · Minimal
- Est. fire insurance / yr
- $787 – $1,461
Heat risk 4/10 · Minor
- Hot days now (above 100°F)
- 6 days/yr
- Hot days in 30 yrs
- 16 days/yr
Wind risk 2/10 · Minimal
- Chance of severe wind over 30 yrs
- 1.0%
Air-quality risk 1/10 · Minimal
- Unhealthy air days now
- 0 days/yr
- Unhealthy air days in 30 yrs
- 0 days/yr
Risk factors via First Street. Map © Google.
Why this score? — see what drove the C+ grade
The composite is a weighted blend of 9 inputs, each scored 0–100. Each bar is that input's sub-score; the figure is the points it added to the 100-point composite (weight × sub-score).
- Cash flow +26.2/30.0
- DSCR +8.9/10.0
- ARV discount +7.5/15.0
- 1% rule +6.5/10.0
- Livability +4.2/5.0
- Schools +2.9/10.0
- Rent growth +2.5/5.0
- Condition / age +2.5/5.0
- Appreciation +0.0/10.0
$125,000
🖨 Deal sheet 📄 Offer letter ✓ Due diligence
Listing remarks MLS
23 Hour Listing.
Key facts
- 0.24 acre lot
- Built 1951
- Listed 22 days
Property features AI
Exterior
- Parking: Parking pad
- Security: Smoke detector(s)
- Utilities: Public water; Public sewer; Cable available
- Home design: Two-story single family residence; Residential property
- Construction: Block and stucco construction; Composition/shingle roof; Full basement
- Exterior features: Deck
Interior
- Kitchen: Dishwasher; Electric range; Refrigerator
- Flooring: Hardwood; Tile; Vinyl
- Bathrooms: 2 full bathrooms
- Heating & cooling: Forced air heating; Central air conditioning
- Interior features: Insulated windows; Fireplace
Neighborhood map
What this means for you Summary
Snapshot
- This is a 4-bed/2.0-bath single-family listed at $125k.
Deal economics
- At list price, monthly cash flow is $319 ($4k/yr) — positive.
- The deal already cash-flows at list — no discount required.
- Meets the 1% rule at list price ($1k rent vs $125k).
- Recommended offer: $123k (1.5% below list) — sets the bar for market timing.
- Cap rate 9.4% vs local median 3.8% in Charleston — top-decile yield for the area; either an underpriced asset or a hidden risk that comps aren't pricing in. Stress-test before assuming the spread holds.
Location & tenants
- Location reads 85/100 on livability (#3 in WV, #524 nationally) — a professional / high-income tenant draw. Strengths: amenities A+, commute A+, cost of living A+; Watch: crime F.
- Kanawha County Schools (suburban): math 29% / reading 40% proficiency, ranked #17 of 55 in WV (top 31%) — families likely to look elsewhere, expect single-tenant / working-renter base with shorter leases.
- Zoned schools: Overbrook Elementary School (math 57% / reading 57%, grade C+, #23 of 377 statewide, top 7%, 349 students, 0% FRL); John Adams Middle School (math 45% / reading 63%, grade B-, #2 of 109 statewide, top 1%, 705 students, 0% FRL) — zoned schools average 0% FRL vs 46% district-wide (46 pts lower); this property's tenant base skews higher-income than the district average.
- Zoned-school proficiency averages 56% at this address vs 34% district-wide (+21 pts) — the actual schools serving this property are materially stronger than the Kanawha County Schools average implies; a family-tenant draw the district grade alone would hide.
- Market conditions: 115 active listings in the ZIP; 103 units permitted in Kanawha County in 2024 (0 in 5+ unit buildings).
Forward outlook
- Local home prices are declining (-3.0%/yr); year-one equity from $864 of loan paydown is wiped out by about $4k of value loss. Plan a longer hold.
- Kanawha County population projected at -17% by 2050 — secular population decline; favor cash flow + early exit over multi-decade hold.
- At projected returns (-3.0% appreciation + 3.0% rent growth), your $35k cash investment doubles in ~10 years — after that, you're playing with house money.
Negotiation context
- It's been on market 23 days — a 2% lower offer ($123k) is reasonable based on typical stale-listing flexibility.
- 2 sale attempts since 2y ago; this cycle's ask has dropped $10k (7%) from the opening price — seller is motivated, your offer sets the floor, not the list.
Risks & watch-outs
- Watch-outs: built in 1951 — expect roof / HVAC / electrical / plumbing capex.
Questions for the listing agent
- Built in 1951 — when were the roof, HVAC, electrical panel, plumbing, and water heater last replaced?
- Is there a deadline driving the sale (1031 exchange, divorce, estate, relocation)? That informs how much negotiation room exists.
- Schools are A-rated — typically a magnet for longer-tenancy family renters. What's the average tenant stay here, and is there a school-zone premium baked into asking?
- Crime grade is F in this area — have there been break-ins, vandalism, or insurance claims at this property in the last 3 years? What carrier currently insures it and at what premium?
- What's the average days-on-market for RENTAL listings here right now (not sales)? A rising rental-DOM trend means longer vacancies and softer asking-rent achievability than the comps imply.
- What's the recent tenant-quality profile in this submarket — average credit score on applications, eviction rate, late-payment / NSF rate, and stable-employment percentage? A property-management company in the area should have these aggregated.
- How much new for-sale + rental construction is in the pipeline within 1–3 miles? Heavy new supply typically softens prices + rents 12–24 months out; constrained supply supports both.
Investment metrics
- 1% rule
- 1.15% ✓
- Cap rate
- 9.35%
- Cash-on-cash
- 10.93%
- DSCR
- 1.49
- GRM
- 7.3
CMA / ARV
- ARV (on-the-fly)
- $291,980
- Comps found
- 12
Show comp detail 12 sales within ~0.75 mi
| Address | Dist | Beds/Ba | Sqft | Sold | Price | $/sf | Match |
|---|---|---|---|---|---|---|---|
| 1440 Wilkie Dr | 0.14mi | 4/2.5 | 2,292 (+2%) | 11mo | $325,000 | $142 | 79 |
| 508 Spotswood Rd | 0.23mi | 3/3.0 (-1) | 2,300 (+2%) | 6mo | $300,000 | $130 | 71 |
| 820 Gordon Dr | 0.38mi | 3/3.5 (-1) | 2,356 (+5%) | 4mo | $275,000 | $117 | 59 |
| 619 Churchill Dr | 0.27mi | 3/3.0 (-1) | 2,000 (-11%) | 3mo | $203,000 | $102 | 58 |
| 323 Mckinley Ave | 0.60mi | 3/2.5 (-1) | 2,300 (+2%) | 9mo | $253,000 | $110 | 54 |
| 705 Churchill Dr | 0.24mi | 3/2.0 (-1) | 2,576 (+15%) | 11mo | $180,000 | $70 | 50 |
| 606 Fort Hill Dr | 0.71mi | 4/2.5 | 2,372 (+6%) | 7mo | $420,000 | $177 | 50 |
| 795 Echo Rd | 0.72mi | 4/3.0 | 2,064 (-8%) | 2mo | $235,000 | $114 | 47 |
| 409 Sheridan Cir | 0.53mi | 4/3.0 | 2,472 (+10%) | 11mo | $340,000 | $138 | 46 |
| 109 Hillview Dr | 0.65mi | 4/3.0 | 2,057 (-8%) | 10mo | $306,000 | $149 | 44 |
| 201 Sheridan Cir | 0.63mi | 3/2.0 (-1) | 2,000 (-11%) | 10mo | $315,500 | $158 | 39 |
| 947 Gordon Dr | 0.71mi | 3/2.0 (-1) | 1,933 (-14%) | 2mo | $242,900 | $126 | 37 |
Match score weights: distance 35% · size 25% · config 20% · recency 20%. Top-matched comps best support the ARV.
Projected returns pro-forma
-3.0% appreciation · 3.0% rent growth · sell at horizon
- IRR
- 0.0%
- Equity multiple
- 1.00×
- Total profit
- $44
- Equity at exit
- $18,638
- IRR
- 9.7%
- Equity multiple
- 1.75×
- Total profit
- $26,155
- Equity at exit
- $10,808
Cash invested: $35,000 (down + closing). Projections, not guarantees.
Landlord ↔ Tenant lean methodology
- Overall (STATE)
- 83 Strongly Landlord-Friendly
- State West Virginia
- 83 Strongly Landlord-Friendly · R+22
- County
- — inherits STATE
- City
- — inherits STATE
ZIP-level market 25314
- Home prices YoY
- -32.9%
- Active inventory
- 115
- Price-to-rent
- 7.3×
Monthly cashflow live
- Estimated rent
- $1,437 medium interval (Pro) →
- Mortgage (P&I)
- −$656
- Tax from tax record
- −$108 /mo · $1,301/yr
- Insurance
- −$52
- HOA
- −$0
- Vacancy / Maint / Mgmt
- −$302
- Net cashflow
- $319
Break-even live
UW: 25.0% down · 7.5% · 30yr · 1.5% tax · 5.0% vac · 8.0% maint · 8.0% mgmt
Financing live
Cash to close
- Down payment
- $31,250
- Closing costs
- $3,750
- Reserves months
- —
- Total cash needed
- —
Loan-product check · same deal, 3 products live
Conventional
25% down · 7.5% · 30yr
- Down + closing
- —
- Monthly P&I
- —
- Monthly cashflow
- —
- DSCR
- —
- Eligible?
- —
Personal DTI + credit; lowest rate.
DSCR
20% down · 8.5% · 30yr
- Down + closing
- —
- Monthly P&I
- —
- Monthly cashflow
- —
- DSCR
- —
- Eligible?
- —
No personal income docs; deal must DSCR.
Hard money
10% down · 12.0% · 12mo
- Down + closing
- —
- Monthly P&I
- —
- Monthly cashflow
- —
- DSCR
- —
- Eligible?
- —
Short-term bridge; refi at stabilization.
Listing history 20 events
-
2026-06-19days on market $125,000 Active 23 DOM
-
2026-06-18days on market $125,000 Active 22 DOM
-
2026-06-17days on market $125,000 Active 21 DOM
-
2026-06-16days on market $125,000 Active 20 DOM
-
2026-06-15days on market $125,000 Active 19 DOM
-
2026-06-14days on market $125,000 Active 17 DOM
-
2026-06-12days on market $125,000 Active 16 DOM
-
2026-06-09days on market $125,000 Active 13 DOM
-
2026-06-08days on market $125,000 Active 12 DOM
-
2026-06-07pricedays on market $125,000 Active 11 DOM
-
2026-06-05days on market $135,000 Active 8 DOM
-
2026-06-03days on market $135,000 Active 7 DOM
-
2026-06-02days on market $135,000 Active 6 DOM
-
2026-06-01days on market $135,000 Active 5 DOM
-
2026-05-31days on market $135,000 Active 4 DOM
-
2026-05-30days on market $135,000 Active 3 DOM
-
2026-05-27$135,000 Active
-
2024-12-19soldstatus $120,000 Closed 16-char remark
Show marketing remark (16 chars)
23 Hour Listing.
-
2024-12-05$149,000 Active 16-char remark
Show marketing remark (16 chars)
23 Hour Listing.
-
2006-04-25soldstatus $145,000
ⓘ Source: listings_history table (triggers on properties + properties_extension) + one-shot
backfill from property_details.listing_events for pre-trigger history.
Tax reassessment forecast WV · Resets to sale price
- Current annual tax
- $1,301 · $108/mo
- Projected year-2 tax
- $1,301 · $108/mo
- Expected delta
- $0/yr ($0/mo · 0.0%)
ⓘ Screening estimate from a state-policy table — verify with the county assessor before closing.
Climate risk First Street
- Flood 1/10 Low FEMA zone X (unshaded) · 0% chance over 30 yrs
- Wildfire 1/10 Low
- Heat 4/10 Moderate 6 d/yr ≥100°F today · 16 d/yr by 30 yrs out
- Wind 2/10 Low 100% chance of damaging wind over 30 yrs
- Air quality 1/10 Low 0 unhealthy d/yr today · 0 by 30 yrs out
Nearby sold comps map
Loading sold comps map…
Walkable amenities ~0.75 mi
Loading nearby amenities…
Taxation est. · year 1
- Rental income
- $17,238
- − Mortgage interest
- −$7,002
- − Property taxes
- −$1,301
- − Insurance
- −$625
- − Repairs & maintenance
- −$1,379
- − Management
- −$1,379
- − Depreciation
- −$3,636
- Taxable income
- $1,916
- Est. tax owed @ 24.0%
- −$460
- After-tax cash flow
- $3,366/yr
For passive investors: Depreciation is non-cash, so a rental often shows a tax loss while cash-flowing — sheltering income. Rental losses are passive: they offset passive income freely, and up to $25,000/yr can offset ordinary (W-2) income if you actively participate and your MAGI is under $100k (phasing out to $0 by $150k); unused losses carry forward. On sale, claimed depreciation is recaptured at up to 25%, and gains may owe capital-gains tax (a 1031 exchange can defer both). Figures are a year-1 estimate at your 24.0% rate — not tax advice; consult a CPA.
Schools (NCES district)
- District
- Kanawha County Schools
- NCES district ID
- 5400600
- Math proficiency
- 29% ▼ -13.00%
- Reading proficiency
- 40% ▼ -7.00%
- Median HH income
- $44,329
- Composite
- 29.35/100
- National rank
- #6540
- State rank
- #17 of 55 in WV
Livability — Charleston
- Score
- 85/100
- State rank
- #3
- US rank
- #524
Category grades
Schools grade is shown separately in the Schools card above.
Census & demographics
- Census place
- Charleston, WV
- City population
- 33,502
- Population (ZIP)
- 15,742
Population outlook (Kanawha County) Hauer SSP2
- Today (2025)
- 178,946 people
- By 2030
- 172,906 · -3.4%
- By 2040
- 159,874 · -10.7%
- By 2050
- 148,148 · -17.2%
- By 2075
- 123,257 · -31.1%
- By 2100
- 96,454 · -46.1%
Race, ethnicity, and origin ACS 2023
- Neighborhood character
- Predominantly White (85%)
- Race & ethnicity
- White 85% Two or more races 5% Asian 5% Black 4% Hispanic / Latino 2%
- Common ancestry
- Slovak 3% Serbian 3% Lithuanian 3%
- Foreign-born
- 5% · China, Canada
- Languages at home
- 93% English-only · Other Indo-European 3% Spanish 2% Other Asian/Pacific 1%
Political lean MEDSL · Kanawha
- 2024 margin
- R (+17.4) · D 40.2% · R 57.6% · Other 2.2%
- 2008→2024 swing
- -17.0pp toward R · 2008: -0.4pp · 2024: -17.4pp
- All cycles
- 2024: R+17.4 2020: R+14.7 2016: R+20.6 2012: R+11.9 2008: R+0.4
Not yet ingested
- Civics
- —
Market trends
- HPI YoY
- ▼ -80.67%
- Current HPI
- 164.9358
- Rent YoY
- —
- Metro
- —
- State GDP YoY
- —
- F500 in state
- 0
Price history
-6.9% since first listed4 events — show timeline
- 2026-05-27 Listed $135,000 KVBOR
- 2024-12-19 Sold (MLS) $120,000 KVBOR
- 2024-12-05 Listed $149,000 KVBOR
- 2006-04-25 Sold (Public Records) $145,000 Public Records
Property tax history
+0.5%/yrLatest (2025): $1,301 · +0.0% YoY. Source: county tax records.
Cash-flow waterfall
monthlySold comps — $/sqft
last 12 mo · ≤1 miLoading sold comps…