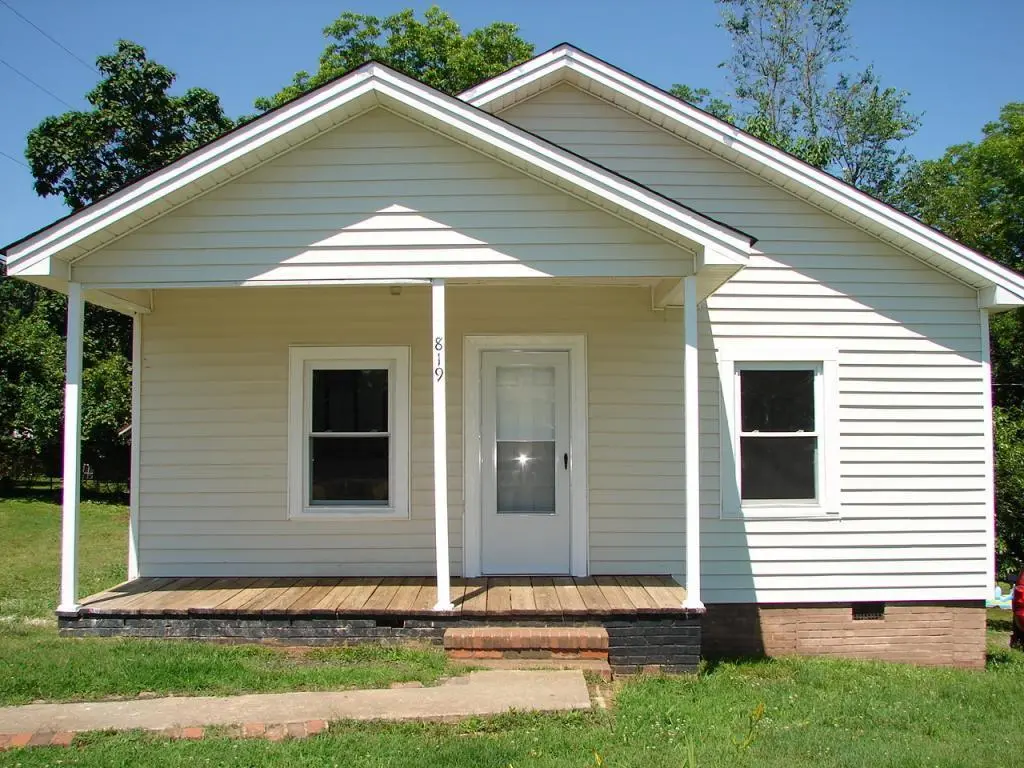
819 S Beaumont Ave · Burlington, NC
Flood risk 1/10 · Minimal
- FEMA flood zone
- X (unshaded)
- Chance of flooding over 30 yrs
- 0.0%
- Est. flood insurance / yr
- $507 – $1,088
Fire risk 1/10 · Minimal
- Est. fire insurance / yr
- $906 – $1,684
Heat risk 6/10 · Moderate
- Hot days now (above 105°F)
- 7 days/yr
- Hot days in 30 yrs
- 18 days/yr
Wind risk 5/10 · Moderate
- Chance of severe wind over 30 yrs
- 22.0%
Air-quality risk 2/10 · Minimal
- Unhealthy air days now
- 2 days/yr
- Unhealthy air days in 30 yrs
- 2 days/yr
Risk factors via First Street. Map © Google.
Why this score? — see what drove the C grade
The composite is a weighted blend of 9 inputs, each scored 0–100. Each bar is that input's sub-score; the figure is the points it added to the 100-point composite (weight × sub-score).
- Cash flow +20.0/30.0
- ARV discount +15.0/15.0
- DSCR +6.3/10.0
- 1% rule +4.5/10.0
- Livability +3.5/5.0
- Schools +3.0/10.0
- Rent growth +2.8/5.0
- Condition / age +2.5/5.0
- Appreciation +0.0/10.0
$119,900
🖨 Deal sheet 📄 Offer letter ✓ Due diligence
Listing remarks MLS
Freshly Painted, New Carpet, Vinyl Replacement Windows, Move In Ready, Newer Hvac.
Key facts
- Easy access
- Spacious backyard
- Storage shed
Tags
Property features AI
Finance
- Other: County: Alamance
- HOA & community: No association
Exterior
- Utilities: Public water; Public sewer
- Home design: One-story house
- Construction: Vinyl siding; Brick/mortar foundation; Shingle roof; Built as a house (948 sq ft living area)
- Exterior features: Public-maintained road access; Directions: Turn right on S Beaumont Ave and the home is on the right
Interior
- Bedrooms: 2 bedrooms (both on the main level)
- Flooring: Luxury vinyl
- Bathrooms: 1 full bathroom
- Heating & cooling: Central heating; Central air conditioning
- Interior features: Luxury vinyl flooring
Neighborhood map
What this means for you Summary
Snapshot
- This is a 2-bed/1.0-bath single-family listed at $120k.
Deal economics
- At list price, monthly cash flow is $147 ($2k/yr) — positive.
- The deal already cash-flows at list — no discount required.
- To meet the 1% rule (rent ≥ 1% of price), the offer needs to be $114k (4.7% below list).
- Recommended offer: $113k (6.0% below list) — sets the bar for market timing.
- Cap rate 7.8% vs local median 3.6% in Burlington — top-decile yield for the area; either an underpriced asset or a hidden risk that comps aren't pricing in. Stress-test before assuming the spread holds.
Location & tenants
- Location reads 70/100 on livability (#123 in NC) — a middle-class / working-renter tenant base. Strengths: cost of living A+, housing A+, health & safety A+; Watch: commute D+, schools F, crime F.
- Alamance-Burlington Schools (rural): math 30% / reading 40% proficiency, ranked #133 of 178 in NC (top 75%) — families likely to look elsewhere, expect single-tenant / working-renter base with shorter leases.
- Market conditions: Rents rising (+1.1%/yr); 273 active listings in the ZIP; 7 comparable units currently listed for rent nearby; rentals at typical pace (median 21d on market — plan ~3-4 weeks tenant-placement turnaround); 2,466 units permitted in Alamance County in 2024 (403 in 5+ unit buildings).
Forward outlook
- Local home prices are declining (-3.0%/yr); year-one equity from $829 of loan paydown is wiped out by about $4k of value loss. Plan a longer hold.
- Alamance County population projected at +19% by 2050 — long-run rental-demand tailwind backs the buy-and-hold thesis.
Negotiation context
- It's been on market 61 days — a 6% lower offer ($113k) is reasonable based on typical stale-listing flexibility.
- 3 sale attempts since 10y ago; this cycle's ask has dropped $10k (8%) from the opening price — seller is motivated, your offer sets the floor, not the list.
- Current owner paid $39k; list at $120k implies a 207% gain — meaningful room to come down on a strong offer.
Risks & watch-outs
- Watch-outs: built in 1910 — expect roof / HVAC / electrical / plumbing capex.
- Climate carrying-cost: moderate wind risk, 22% chance of damaging wind over 30y; extreme-heat days projected 7→18/yr by 2055 (HVAC capex compounding) — expect insurance premiums to compound above CPI over the hold.
Questions for the listing agent
- It's been on market 61 days. Have you received any prior offers? Is the seller open to a 6% concession, seller financing, or rate buy-down credit?
- Built in 1910 — when were the roof, HVAC, electrical panel, plumbing, and water heater last replaced?
- Why hasn't it sold? Are there any deal-killer items the seller is aware of (foundation, flood, title, zoning, code violations)?
- Is there a deadline driving the sale (1031 exchange, divorce, estate, relocation)? That informs how much negotiation room exists.
- Schools are F-rated, which usually means shorter tenancies and higher turnover. Who's the typical renter profile here, and what's been the actual vacancy rate?
- Crime grade is F in this area — have there been break-ins, vandalism, or insurance claims at this property in the last 3 years? What carrier currently insures it and at what premium?
- What's the average days-on-market for RENTAL listings here right now (not sales)? A rising rental-DOM trend means longer vacancies and softer asking-rent achievability than the comps imply.
- What's the recent tenant-quality profile in this submarket — average credit score on applications, eviction rate, late-payment / NSF rate, and stable-employment percentage? A property-management company in the area should have these aggregated.
- How much new for-sale + rental construction is in the pipeline within 1–3 miles? Heavy new supply typically softens prices + rents 12–24 months out; constrained supply supports both.
Investment metrics
- 1% rule
- 0.95% ✗
- Cap rate
- 7.77%
- Cash-on-cash
- 5.27%
- DSCR
- 1.23
- GRM
- 8.7
CMA / ARV
- ARV (on-the-fly)
- $145,926
- Comps found
- 12
Show comp detail 12 sales within ~0.75 mi
| Address | Dist | Beds/Ba | Sqft | Sold | Price | $/sf | Match |
|---|---|---|---|---|---|---|---|
| 1329 Parker St | 0.06mi | 2/1.0 | 779 (+7%) | 8mo | $155,000 | $199 | 79 |
| 1326 Stonewall St | 0.26mi | 2/1.0 | 768 (+6%) | 1mo | $154,000 | $201 | 78 |
| 516 Delaware Ave | 0.35mi | 2/1.0 | 767 (+6%) | 14mo | $194,900 | $254 | 63 |
| 828 Buckner St | 0.62mi | 2/1.0 | 772 (+6%) | 6mo | $210,000 | $272 | 56 |
| 504 Delaware Ave | 0.39mi | 2/1.0 | 808 (+11%) | 9mo | $126,500 | $157 | 55 |
| 834 Buckner St | 0.59mi | 2/1.0 | 780 (+7%) | 8mo | $159,000 | $204 | 53 |
| 924 E Market St | 0.63mi | 2/1.0 | 780 (+7%) | 7mo | $160,000 | $205 | 53 |
| 710 Dothan Ave | 0.48mi | 2/1.0 | 795 (+10%) | 12mo | $179,000 | $225 | 52 |
| 830 Stockard St | 0.64mi | 2/1.0 | 805 (+11%) | 0mo | $153,000 | $190 | 51 |
| 1302 Sidney | 0.57mi | 2/1.0 | 650 (-10%) | 6mo | $73,000 | $112 | 51 |
| 1021 Alden St | 0.51mi | 2/1.0 | 639 (-12%) | 9mo | $70,000 | $110 | 49 |
| 208 N Beaumont Ave | 0.71mi | 2/1.0 | 758 (+4%) | 13mo | $135,000 | $178 | 49 |
Match score weights: distance 35% · size 25% · config 20% · recency 20%. Top-matched comps best support the ARV.
Projected returns pro-forma
-3.0% appreciation · 1.06% rent growth · sell at horizon
- IRR
- -10.2%
- Equity multiple
- 0.63×
- Total profit
- $-12,258
- Equity at exit
- $17,877
- IRR
- -3.6%
- Equity multiple
- 0.78×
- Total profit
- $-7,333
- Equity at exit
- $10,367
Cash invested: $33,572 (down + closing). Projections, not guarantees.
Landlord ↔ Tenant lean methodology
- Overall (STATE)
- 85 Strongly Landlord-Friendly
- State North Carolina
- 85 Strongly Landlord-Friendly · R+3
- County
- — inherits STATE
- City
- — inherits STATE
ZIP-level market 27217
- Home prices YoY
- -22.3%
- Rents YoY
- 1.1%
- Active inventory
- 273
- Price-to-rent
- 8.7×
Monthly cashflow live
- Estimated rent
- $1,142 high interval (Pro) →
- Mortgage (P&I)
- −$629
- Tax from tax record
- −$76 /mo · $914/yr
- Insurance
- −$50
- HOA
- −$0
- Vacancy / Maint / Mgmt
- −$240
- Net cashflow
- $147
Break-even live
UW: 25.0% down · 7.5% · 30yr · 1.5% tax · 5.0% vac · 8.0% maint · 8.0% mgmt
Financing live
Cash to close
- Down payment
- $29,975
- Closing costs
- $3,597
- Reserves months
- —
- Total cash needed
- —
Loan-product check · same deal, 3 products live
Conventional
25% down · 7.5% · 30yr
- Down + closing
- —
- Monthly P&I
- —
- Monthly cashflow
- —
- DSCR
- —
- Eligible?
- —
Personal DTI + credit; lowest rate.
DSCR
20% down · 8.5% · 30yr
- Down + closing
- —
- Monthly P&I
- —
- Monthly cashflow
- —
- DSCR
- —
- Eligible?
- —
No personal income docs; deal must DSCR.
Hard money
10% down · 12.0% · 12mo
- Down + closing
- —
- Monthly P&I
- —
- Monthly cashflow
- —
- DSCR
- —
- Eligible?
- —
Short-term bridge; refi at stabilization.
Rent comps 7 comps
| Address | Beds | Baths | Sqft | Rent | $/sqft | DOM | Units | Dist |
|---|---|---|---|---|---|---|---|---|
| 411 S Saint John St Burlington, NC | 1.0 | 1.0 | 700 | $1,100 | $1.57 | 21d | 1 | 0.68mi |
| 916 Harris St Burlington, NC | 1.0 | 1.0 | 601 | $895 | $1.49 | 21d | 1 | 0.70mi |
| 1016 Washington St Unit A Burlington, NC | 1.0 | 1.0 | 650 | $775 | $1.19 | 21d | 1 | 0.76mi |
| 1055 Baldwin Ridge Rd Burlington, NC | 1.0–3.0 | 1.0–2.0 | 1025 | $1,512 | $1.48 | 13d | 19 | 1.05mi |
| 607 N Main St Unit 609 Burlington, NC | 1.0 | 1.0 | 568 | $850 | $1.50 | 21d | 1 | 1.05mi |
| 1900 Morningside Dr Burlington, NC | 1.0–3.0 | 1.0–2.0 | 1076 | $1,262 | $1.17 | 13d | 1 | 1.16mi |
| 400 Walker Ave Graham, NC | 2.0 | 1.0 | 552 | $1,100 | $1.99 | 21d | 1 | 1.44mi |
Listing history 9 events
-
2026-04-17price $119,900
-
2026-04-07price $124,900
-
2026-03-24$130,000 Active
-
2017-01-25soldstatus $39,000 82-char remark
Show marketing remark (82 chars)
Freshly Painted, New Carpet, Vinyl Replacement Windows, Move In Ready, Newer Hvac.
-
2017-01-25soldstatus $39,000 82-char remark
Show marketing remark (82 chars)
Freshly Painted, New Carpet, Vinyl Replacement Windows, Move In Ready, Newer Hvac.
-
2017-01-25soldstatus $39,000
Show marketing remark (82 chars)
Freshly Painted, New Carpet, Vinyl Replacement Windows, Move In Ready, Newer Hvac.
-
2016-06-06$45,500 82-char remark
Show marketing remark (82 chars)
Freshly Painted, New Carpet, Vinyl Replacement Windows, Move In Ready, Newer Hvac.
-
2016-06-06$45,500 82-char remark
Show marketing remark (82 chars)
Freshly Painted, New Carpet, Vinyl Replacement Windows, Move In Ready, Newer Hvac.
-
1987-09-15soldstatus $15,000
ⓘ Source: listings_history table (triggers on properties + properties_extension) + one-shot
backfill from property_details.listing_events for pre-trigger history.
Tax reassessment forecast NC · Resets to sale price
- Current annual tax
- $914 · $76/mo
- Projected year-2 tax
- $983 · $82/mo
- Expected delta
- +$70/yr (+$6/mo · 7.6%)
ⓘ Screening estimate from a state-policy table — verify with the county assessor before closing.
Climate risk First Street
- Flood 1/10 Low FEMA zone X (unshaded) · 0% chance over 30 yrs
- Wildfire 1/10 Low
- Heat 6/10 Major 7 d/yr ≥105°F today · 18 d/yr by 30 yrs out
- Wind 5/10 Major 22% chance of damaging wind over 30 yrs
- Air quality 2/10 Low 2 unhealthy d/yr today · 2 by 30 yrs out
Nearby sold comps map
Loading sold comps map…
Walkable amenities ~0.75 mi
Loading nearby amenities…
Taxation est. · year 1
- Rental income
- $13,705
- − Mortgage interest
- −$6,716
- − Property taxes
- −$914
- − Insurance
- −$600
- − Repairs & maintenance
- −$1,096
- − Management
- −$1,096
- − Depreciation
- −$3,488
- Taxable loss
- −$205
- Est. tax savings @ 24.0%
- +$49
- After-tax cash flow
- $1,818/yr
For passive investors: Depreciation is non-cash, so a rental often shows a tax loss while cash-flowing — sheltering income. Rental losses are passive: they offset passive income freely, and up to $25,000/yr can offset ordinary (W-2) income if you actively participate and your MAGI is under $100k (phasing out to $0 by $150k); unused losses carry forward. On sale, claimed depreciation is recaptured at up to 25%, and gains may owe capital-gains tax (a 1031 exchange can defer both). Figures are a year-1 estimate at your 24.0% rate — not tax advice; consult a CPA.
Schools (NCES district)
- District
- Alamance-Burlington Schools
- NCES district ID
- 3700030
- Math proficiency
- 30% ▼ -6.00%
- Reading proficiency
- 40% ▲ 2.00%
- Median HH income
- $43,359
- Composite
- 29.68/100
- National rank
- #6460
- State rank
- #133 of 178 in NC
Livability — Burlington
- Score
- 70/100
- State rank
- #123
- US rank
- #7396
Category grades
Schools grade is shown separately in the Schools card above.
Census & demographics
- Census place
- Burlington, NC
- County
- Alamance County · 173,369 people
- City population
- 88,508
- Metro
- Burlington, NC
- Population (ZIP)
- 41,406
- Household income
- $51,950
- Rent vs Own
- Severe rent burden
- 1040.0
Population outlook (Alamance County) Hauer SSP2
- Today (2025)
- 173,381 people
- By 2030
- 180,609 · +4.2%
- By 2040
- 194,327 · +12.1%
- By 2050
- 206,158 · +18.9%
- By 2075
- 235,665 · +35.9%
- By 2100
- 258,626 · +49.2%
Race, ethnicity, and origin ACS 2023
- Neighborhood character
- Diverse neighborhood (Simpson 0.69)
- Race & ethnicity
- White 38% Black 29% Hispanic / Latino 29% Two or more races 7% Native American 1%
- Hispanic origin (detail)
- Mexican 19% Puerto Rican 1%
- Common ancestry
- Serbian 2% Italian 1% Slovak 1%
- Foreign-born
- 13% · Canada
- Languages at home
- 75% English-only · Spanish 24%
Political lean MEDSL · Alamance
- 2024 margin
- Lean R (+8.2) · D 45.4% · R 53.5% · Other 1.1%
- 2008→2024 swing
- +1.1pp toward D · 2008: -9.2pp · 2024: -8.2pp
- All cycles
- 2024: R+8.2 2020: R+8.4 2016: R+12.9 2012: R+14.1 2008: R+9.2
Not yet ingested
- Civics
- —
Market trends
- HPI YoY
- ▼ -74.45%
- Current HPI
- 259.8107
- Rent YoY
- ▲ 1.06%
- Metro
- Burlington, NC
- State GDP YoY
- ▲ 3.28%
- F500 in state
- 26
Industry mix (Fortune 500 HQ in NC)
| Industry | F500 HQs | Revenue |
|---|---|---|
| Financial Services | 2 | $213B |
|
||
| Retail | 2 | $95B |
|
||
| Industrial Conglomerate | 1 | $38B |
|
||
| Metals / Steel | 1 | $35B |
|
||
| Utilities | 1 | $30B |
|
||
| Industrial Machinery | 1 | $19B |
|
||
Price history
+699.3% since first listed9 events — show timeline
- 2026-04-17 Price Changed $119,900 TMLS
- 2026-04-07 Price Changed $124,900 TMLS
- 2026-03-24 Listed $130,000 TMLS
- 2017-01-25 Sold (Public Records) $39,000 Public Records
- 2017-01-25 Sold (MLS) $39,000 AMLSNC
- 2017-01-25 Sold (MLS) $39,000 TMLS
- 2016-06-06 Listed $45,500 AMLSNC
- 2016-06-06 Listed $45,500 TMLS
- 1987-09-15 Sold (Public Records) $15,000 Public Records
Property tax history
+11.2%/yrLatest (2025): $914 · +2.6% YoY. Source: county tax records.
Cash-flow waterfall
monthlySold comps — $/sqft
last 12 mo · ≤1 miLoading sold comps…