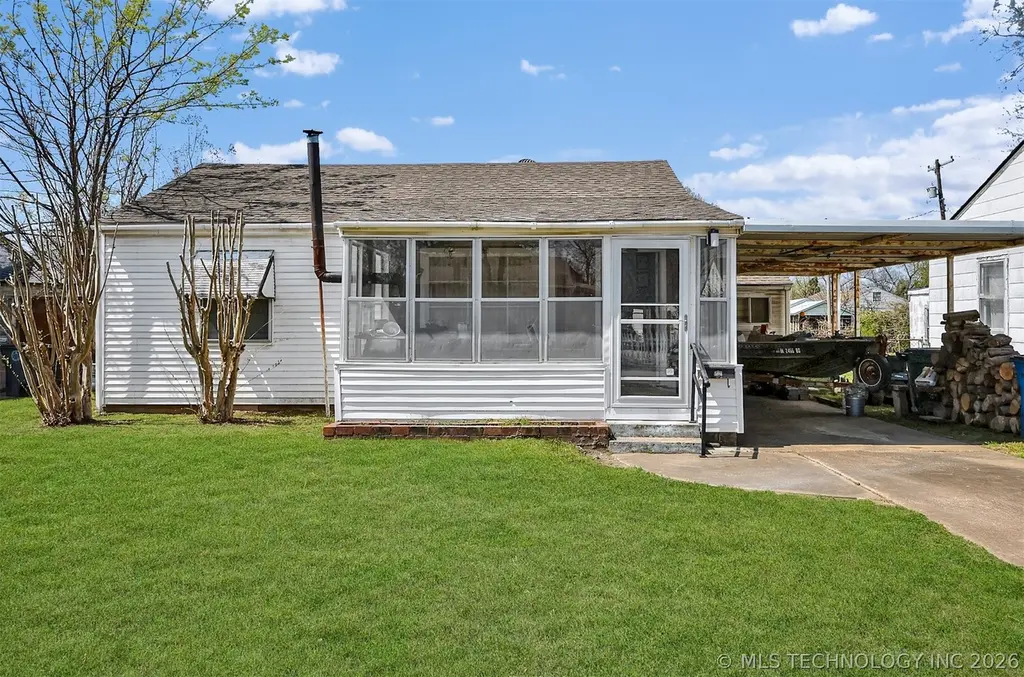
1328 N Vandalia Ave · Tulsa, OK
Flood risk 1/10 · Minimal
- FEMA flood zone
- X (unshaded)
- Chance of flooding over 30 yrs
- 0.0%
- Est. flood insurance / yr
- $507 – $1,088
Fire risk 1/10 · Minimal
- Est. fire insurance / yr
- $2,463 – $4,575
Heat risk 6/10 · Moderate
- Hot days now (above 110°F)
- 7 days/yr
- Hot days in 30 yrs
- 18 days/yr
Wind risk 2/10 · Minimal
- Chance of severe wind over 30 yrs
- 4.0%
Air-quality risk 3/10 · Minor
- Unhealthy air days now
- 2 days/yr
- Unhealthy air days in 30 yrs
- 3 days/yr
Risk factors via First Street. Map © Google.
Why this score? — see what drove the B grade
The composite is a weighted blend of 9 inputs, each scored 0–100. Each bar is that input's sub-score; the figure is the points it added to the 100-point composite (weight × sub-score).
- Cash flow +30.0/30.0
- ARV discount +15.0/15.0
- DSCR +10.0/10.0
- 1% rule +7.4/10.0
- Livability +3.8/5.0
- Rent growth +3.6/5.0
- Condition / age +2.5/5.0
- Schools +0.8/10.0
- Appreciation +0.0/10.0
$88,900
🖨 Deal sheet (PDF) 📄 Offer letter ✓ Due diligence
Listing remarks
Great investment opportunity or perfect starter home! This charming two-bedroom, one-bath property offers a practical and efficient layout w/ sunroom that offers great space to relax and enjoy the sunshine. Enjoy the flexibility of an extra space ideal for a workshop, home office, or additional storage. Nice size backyard also features a separate storage building for even more convenience. Located with easy access to I-244. Bring your vision to this property and capitalize on its potential!
Key facts
- Easy access to i-244
- Sunroom
- 6,850 sq ft lot
Tags
Neighborhood map
What this means for you Summary
Snapshot
- This is a 2-bed/1.0-bath single-family listed at $89k.
Deal economics
- At list price, monthly cash flow is $334 ($4k/yr) — positive.
- The deal already cash-flows at list — no discount required.
- Meets the 1% rule at list price ($1k rent vs $89k).
- Cap rate 10.8% vs local median 3.8% in Tulsa — top-decile yield for the area; either an underpriced asset or a hidden risk that comps aren't pricing in. Stress-test before assuming the spread holds.
Location & tenants
- Location reads 75/100 on livability (#13 in OK, #4,058 nationally) — a middle-class / working-renter tenant base. Strengths: amenities A+, commute A+, cost of living A+; Watch: crime F, employment D-.
- Tulsa (urban): math 7% / reading 12% proficiency, ranked #250 of 270 in OK (top 93%) — low school quality limits family demand, transient renter base, plan for 1-2y turnover; 76% free/reduced lunch — lower-income household profile, screen leases tightly.
- Zoned schools: Project Accept Traice Es (math 10% / reading 10%, grade F, #695 of 845 statewide, top 84%, 558 students, 0% FRL); Monroe Demonstration Ms (math 0% / reading 2%, grade F, #344 of 345 statewide, top 100%, 688 students, 0% FRL); Booker T. Washington Hs (math 41% / reading 61%, grade D+, #2 of 447 statewide, top 0%, 1,280 students, 0% FRL) — zoned schools average 0% FRL vs 76% district-wide (76 pts lower); this property's tenant base skews higher-income than the district average.
- Market conditions: Rents rising fast (+4.6%/yr); 89 active listings in the ZIP; 13 comparable units currently listed for rent nearby; rentals at typical pace (median 25d on market — plan ~3-4 weeks tenant-placement turnaround); lower-income renter base — watch delinquency; 2,818 units permitted in Tulsa County in 2024 (518 in 5+ unit buildings).
Forward outlook
- Local home prices are declining (-3.0%/yr); year-one equity from $615 of loan paydown is wiped out by about $3k of value loss. Plan a longer hold.
- Tulsa County population projected at +30% by 2050 — long-run rental-demand tailwind backs the buy-and-hold thesis.
- At projected returns (-3.0% appreciation + 4.6% rent growth), your $25k cash investment doubles in ~7 years — after that, you're playing with house money.
Negotiation context
- Only 9 days on market — expect competitive offers; lowballing is unlikely to land.
Risks & watch-outs
- Watch-outs: built in 1947 — expect roof / HVAC / electrical / plumbing capex.
- Climate carrying-cost: extreme-heat days projected 7→18/yr by 2055 (HVAC capex compounding) — expect insurance premiums to compound above CPI over the hold.
Questions for the listing agent
- Built in 1947 — when were the roof, HVAC, electrical panel, plumbing, and water heater last replaced?
- Is there a deadline driving the sale (1031 exchange, divorce, estate, relocation)? That informs how much negotiation room exists.
- Schools are F-rated, which usually means shorter tenancies and higher turnover. Who's the typical renter profile here, and what's been the actual vacancy rate?
- Crime grade is F in this area — have there been break-ins, vandalism, or insurance claims at this property in the last 3 years? What carrier currently insures it and at what premium?
- What's the average days-on-market for RENTAL listings here right now (not sales)? A rising rental-DOM trend means longer vacancies and softer asking-rent achievability than the comps imply.
- What's the recent tenant-quality profile in this submarket — average credit score on applications, eviction rate, late-payment / NSF rate, and stable-employment percentage? A property-management company in the area should have these aggregated.
- How much new for-sale + rental construction is in the pipeline within 1–3 miles? Heavy new supply typically softens prices + rents 12–24 months out; constrained supply supports both.
Investment metrics
- 1% rule
- 1.24% ✓
- Cap rate
- 10.80%
- Cash-on-cash
- 16.08%
- DSCR
- 1.72
- GRM
- 6.7
CMA / ARV
- ARV (on-the-fly)
- $125,280
- Comps found
- 12
Show comp detail 12 sales within ~0.75 mi
| Address | Dist | Beds/Ba | Sqft | Sold | Price | $/sf | Match |
|---|---|---|---|---|---|---|---|
| 1348 N Toledo Ave | 0.13mi | 2/1.0 | 940 (+1%) | 3mo | $145,000 | $154 | 89 |
| 1215 N Yale Ave | 0.21mi | 2/1.0 | 984 (+6%) | 3mo | $117,000 | $119 | 78 |
| 1327 N Winston Ave | 0.09mi | 2/1.0 | 824 (-11%) | 5mo | $110,900 | $135 | 73 |
| 1336 N Vandalia Ave | 0.02mi | 2/1.0 | 816 (-12%) | 8mo | $110,000 | $135 | 73 |
| 1333 N Pittsburg Ave | 0.35mi | 2/1.0 | 1,008 (+9%) | 4mo | $70,000 | $69 | 66 |
| 1032 N Canton Ave | 0.49mi | 3/1.0 (+1) | 888 (-4%) | 1mo | $112,000 | $126 | 64 |
| 4722 E Marshall St | 0.22mi | 2/1.0 | 792 (-15%) | 4mo | $120,000 | $152 | 62 |
| 1055 N New Haven Ave | 0.54mi | 3/1.0 (+1) | 884 (-5%) | 2mo | $75,000 | $85 | 61 |
| 1012 N Vandalia Ave | 0.39mi | 2/1.0 | 804 (-13%) | 2mo | $87,000 | $108 | 58 |
| 1124 N Allegheny Ave | 0.32mi | 3/2.0 (+1) | 1,024 (+10%) | 9mo | $200,000 | $195 | 51 |
| 1508 N Irvington Ave | 0.69mi | 3/2.0 (+1) | 974 (+5%) | 1mo | $192,500 | $198 | 50 |
| 1820 N Oswego Ave | 0.67mi | 3/1.0 (+1) | 864 (-7%) | 4mo | $138,000 | $160 | 48 |
Match score weights: distance 35% · size 25% · config 20% · recency 20%. Top-matched comps best support the ARV.
Projected returns pro-forma
-3.0% appreciation · 4.57% rent growth · sell at horizon
- IRR
- 8.6%
- Equity multiple
- 1.34×
- Total profit
- $8,577
- Equity at exit
- $13,255
- IRR
- 19.0%
- Equity multiple
- 2.69×
- Total profit
- $42,181
- Equity at exit
- $7,686
Cash invested: $24,892 (down + closing). Projections, not guarantees.
Landlord ↔ Tenant lean methodology
- Overall (STATE)
- 83 Strongly Landlord-Friendly
- State Oklahoma
- 83 Strongly Landlord-Friendly · R+20
- County
- — inherits STATE
- City
- — inherits STATE
ZIP-level market 74115
- Home prices YoY
- -9.7%
- Rents YoY
- 4.6%
- Active inventory
- 89
- Price-to-rent
- 6.7×
Monthly cashflow live
- Estimated rent
- $1,100 high interval (Pro) →
- Mortgage (P&I)
- −$466
- Tax from tax record
- −$32 /mo · $387/yr
- Insurance
- −$37
- HOA
- −$0
- Vacancy / Maint / Mgmt
- −$231
- Net cashflow
- $334
Break-even live
Sensitivity live
| Price | -10% $384 | -5% $359 | +0% $334 | +5% $308 | +10% $283 |
|---|---|---|---|---|---|
| Rent | -10% $247 | -5% $290 | +0% $334 | +5% $377 | +10% $421 |
| Rate | -1.0pp $378 | -0.5pp $356 | base $334 | +0.5pp $311 | +1.0pp $287 |
UW: 25.0% down · 7.5% · 30yr · 1.5% tax · 5.0% vac · 8.0% maint · 8.0% mgmt
Financing live
Cash to close
- Down payment
- $22,225
- Closing costs
- $2,667
- Reserves months
- —
- Total cash needed
- —
Loan-product check · same deal, 3 products live
Conventional
25% down · 7.5% · 30yr
- Down + closing
- —
- Monthly P&I
- —
- Monthly cashflow
- —
- DSCR
- —
- Eligible?
- —
Personal DTI + credit; lowest rate.
DSCR
20% down · 8.5% · 30yr
- Down + closing
- —
- Monthly P&I
- —
- Monthly cashflow
- —
- DSCR
- —
- Eligible?
- —
No personal income docs; deal must DSCR.
Hard money
10% down · 12.0% · 12mo
- Down + closing
- —
- Monthly P&I
- —
- Monthly cashflow
- —
- DSCR
- —
- Eligible?
- —
Short-term bridge; refi at stabilization.
Rent comps 13 comps
| Address | Beds | Baths | Sqft | Rent | $/sqft | DOM | Units | Dist |
|---|---|---|---|---|---|---|---|---|
| 4703 E Latimer Pl Tulsa, OK | 2.0 | 1.0 | 1103 | $1,290 | $1.17 | 4d | 1 | 0.21mi |
| 917 N Yale Ave Tulsa, OK | 1.0–2.0 | 1.0 | 725 | $725 | $1.00 | 25d | 1 | 0.44mi |
| 1830 N New Haven Ave Tulsa, OK | 2.0 | 1.0 | 840 | $1,295 | $1.54 | 25d | 1 | 0.75mi |
| 3336 E Marshall St Unit 06 Tulsa, OK | 1.0 | 1.0 | 700 | $895 | $1.28 | 25d | 1 | 0.78mi |
| 3336 E Marshall St Unit 10 Tulsa, OK | 1.0 | 1.0 | 575 | $799 | $1.39 | 25d | 1 | 0.78mi |
| 4008 E Virgin St Tulsa, OK | 3.0 | 1.0 | 1125 | $1,400 | $1.24 | 4d | 1 | 0.78mi |
| 3326 E Marshall St Unit 1 Tulsa, OK | 2.0 | 1.0 | 700 | $825 | $1.18 | 25d | 1 | 0.80mi |
| 3326 E Marshall St Apt 4 Tulsa, OK | 2.0 | 1.0 | 750 | $925 | $1.23 | 25d | 1 | 0.80mi |
| 1507 N Florence Ave Tulsa, OK | 3.0 | 1.0 | 1000 | $1,100 | $1.10 | 25d | 1 | 1.09mi |
| 43 S Toledo Ave Tulsa, OK | 3.0 | 2.0 | 884 | $1,650 | $1.87 | 17d | 1 | 1.09mi |
| 3238 E Easton St Tulsa, OK | 2.0 | 1.0 | 800 | $1,150 | $1.44 | 4d | 1 | 1.16mi |
| 1825 N College Ave Unit 13 Tulsa, OK | 1.0 | 1.0 | 675 | $745 | $1.10 | 25d | 1 | 1.24mi |
| 1816 N Delaware Pl Tulsa, OK | 3.0 | 1.0 | 990 | $950 | $0.96 | 4d | 1 | 1.43mi |
Listing history 2 events
-
2026-04-09status Pending
-
2026-03-31$88,900 Active
ⓘ Source: listings_history table (triggers on properties + properties_extension) + one-shot
backfill from property_details.listing_events for pre-trigger history.
Tax reassessment forecast OK · Resets to sale price
- Current annual tax
- $387 · $32/mo
- Projected year-2 tax
- $800 · $67/mo
- Expected delta
- +$413/yr (+$34/mo · 106.7%)
ⓘ Screening estimate from a state-policy table — verify with the county assessor before closing.
Climate risk First Street
- Flood 1/10 Low FEMA zone X (unshaded) · 0% chance over 30 yrs
- Wildfire 1/10 Low
- Heat 6/10 Major 7 d/yr ≥110°F today · 18 d/yr by 30 yrs out
- Wind 2/10 Low 4% chance of damaging wind over 30 yrs
- Air quality 3/10 Moderate 2 unhealthy d/yr today · 3 by 30 yrs out
Nearby sold comps map
Loading sold comps map…
Walkable amenities ~0.75 mi
Loading nearby amenities…
Taxation est. · year 1
- Rental income
- $13,202
- − Mortgage interest
- −$4,980
- − Property taxes
- −$387
- − Insurance
- −$444
- − Repairs & maintenance
- −$1,056
- − Management
- −$1,056
- − Depreciation
- −$2,586
- Taxable income
- $2,692
- Est. tax owed @ 24.0%
- −$646
- After-tax cash flow
- $3,358/yr
For passive investors: Depreciation is non-cash, so a rental often shows a tax loss while cash-flowing — sheltering income. Rental losses are passive: they offset passive income freely, and up to $25,000/yr can offset ordinary (W-2) income if you actively participate and your MAGI is under $100k (phasing out to $0 by $150k); unused losses carry forward. On sale, claimed depreciation is recaptured at up to 25%, and gains may owe capital-gains tax (a 1031 exchange can defer both). Figures are a year-1 estimate at your 24.0% rate — not tax advice; consult a CPA.
Schools (NCES district)
- District
- Tulsa
- NCES district ID
- 4030240
- Math proficiency
- 7% ▼ -9.00%
- Reading proficiency
- 12% ▼ -7.00%
- Median HH income
- $37,895
- Composite
- 8.04/100
- National rank
- #9919
- State rank
- #250 of 270 in OK
Livability — Tulsa
- Score
- 75/100
- State rank
- #13
- US rank
- #4058
Category grades
Schools grade is shown separately in the Schools card above.
Census & demographics
- Census place
- Tulsa, OK
- County
- Tulsa County · 640,811 people
- City population
- 389,418
- Metro
- Tulsa, OK
- Population (ZIP)
- 24,297
- Household income
- $44,608
- Rent vs Own
- Severe rent burden
- 805.0
Population outlook (Tulsa County) Hauer SSP2
- Today (2025)
- 723,846 people
- By 2030
- 766,033 · +5.8%
- By 2040
- 851,386 · +17.6%
- By 2050
- 938,389 · +29.6%
- By 2075
- 1,166,011 · +61.1%
- By 2100
- 1,350,277 · +86.5%
Race, ethnicity, and origin ACS 2023
- Neighborhood character
- Diverse neighborhood (Simpson 0.68)
- Race & ethnicity
- Hispanic / Latino 44% White 33% Two or more races 19% Black 13% Native American 5%
- Hispanic origin (detail)
- Mexican 39%
- Common ancestry
- Italian 1% Slovak 1% Lithuanian 1%
- Foreign-born
- 19% · Canada
- Languages at home
- 57% English-only · Spanish 42%
Political lean MEDSL · Tulsa
- 2024 margin
- R (+15.2) · D 41.3% · R 56.5% · Other 2.2%
- 2008→2024 swing
- +9.2pp toward D · 2008: -24.5pp · 2024: -15.2pp
- All cycles
- 2024: R+15.2 2020: R+15.6 2016: R+22.9 2012: R+27.4 2008: R+24.5
Not yet ingested
- Civics
- —
Market trends
- HPI YoY
- ▼ -26.82%
- Current HPI
- 251.0869
- Rent YoY
- ▲ 4.57%
- Metro
- Tulsa, OK
- State GDP YoY
- ▲ 1.55%
- F500 in state
- 6
Industry mix (Fortune 500 HQ in OK)
| Industry | F500 HQs | Revenue |
|---|---|---|
| Energy | 3 | $48B |
|
||
Price history
2 events — show timeline
- 2026-04-09 Pending — MLS Technology, Inc.
- 2026-03-31 Listed $88,900 MLS Technology, Inc.
Property tax history
+0.4%/yrLatest (2025): $387 · +3.5% YoY. Source: county tax records.
Cash-flow waterfall
monthlySold comps — $/sqft
last 12 mo · ≤1 miLoading sold comps…