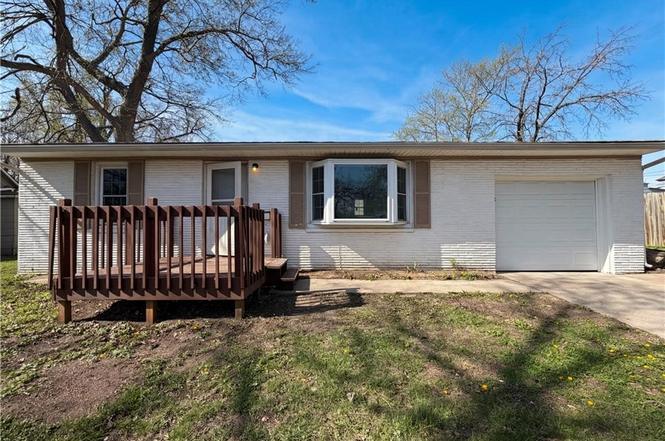
410 B St · Belton, MO
Flood risk No data
- FEMA flood zone
- —
- Chance of flooding over 30 yrs
- %
- Est. flood insurance / yr
- —
Fire risk No data
- Est. fire insurance / yr
- —
Heat risk No data
- Hot days now (above °F)
- days/yr
- Hot days in 30 yrs
- days/yr
Wind risk No data
- Chance of severe wind over 30 yrs
- %
Air-quality risk No data
- Unhealthy air days now
- days/yr
- Unhealthy air days in 30 yrs
- days/yr
Risk factors via First Street. Map © Google.
Why this score? — see what drove the D+ grade
The composite is a weighted blend of 9 inputs, each scored 0–100. Each bar is that input's sub-score; the figure is the points it added to the 100-point composite (weight × sub-score).
- Cash flow +14.3/30.0
- ARV discount +10.4/15.0
- DSCR +4.3/10.0
- 1% rule +4.0/10.0
- Rent growth +3.8/5.0
- Livability +3.8/5.0
- Schools +3.0/10.0
- Condition / age +2.5/5.0
- Appreciation +0.0/10.0
$230,000
🖨 Deal sheet (PDF) 📄 Offer letter ✓ Due diligence
Listing remarks
Step into 410 B St, where new flooring throughout the home and fresh interior paint create an updated and appealing atmosphere. The kitchen is thoughtfully appointed with an accent backsplash and all stainless steel appliances, ready for everyday use. A functional patio provides an accessible outdoor area. This home is a perfect blend of style and functionality. Don't miss out on this gem! Included 100-Day Home Warranty with buyer activation
Key facts
- New flooring
- Functional patio
- Fresh interior paint
Tags
Neighborhood map
What this means for you Summary
Snapshot
- This is a 4-bed/2.0-bath single-family listed at $230k.
Deal economics
- At list price, monthly cash flow is $42 ($505/yr) — positive.
- The deal already cash-flows at list — no discount required.
- To meet the 1% rule (rent ≥ 1% of price), the offer needs to be $207k (10.2% below list).
- Recommended offer: $207k (10.2% below list) — sets the bar for 1% rule.
- Cap rate 6.5% vs local median 4.7% in Belton — top-decile yield for the area; either an underpriced asset or a hidden risk that comps aren't pricing in. Stress-test before assuming the spread holds.
Location & tenants
- Location reads 76/100 on livability (#52 in MO, #3,782 nationally) — a middle-class / working-renter tenant base. Strengths: cost of living A+, housing A+, health & safety A+; Watch: crime C-, schools D+, commute F.
- Belton 124 (suburban): math 28% / reading 39% proficiency, ranked #216 of 324 in MO (top 67%) — families likely to look elsewhere, expect single-tenant / working-renter base with shorter leases.
- Market conditions: Rents rising fast (+5.2%/yr); 205 active listings in the ZIP; 17 comparable units currently listed for rent nearby; rentals leasing fast (median 10d on market — plan ~1-2 weeks tenant-placement turnaround); 588 units permitted in Cass County in 2024 (0 in 5+ unit buildings).
- This rent runs 35% of the median local income ($72k/yr) — at the standard rent-burdened threshold; future hikes will face affordability resistance.
Forward outlook
- Local home prices are declining (-3.0%/yr); year-one equity from $2k of loan paydown is wiped out by about $7k of value loss. Plan a longer hold.
- Cass County population projected to shrink 3% by 2050 — rents likely to lag national; underwrite the cash flow, not the appreciation.
Negotiation context
- It's been on market 18 days — a 2% lower offer ($227k) is reasonable based on typical stale-listing flexibility.
Questions for the listing agent
- Built in 1960 — when were the roof, HVAC, electrical panel, plumbing, and water heater last replaced?
- Is there a deadline driving the sale (1031 exchange, divorce, estate, relocation)? That informs how much negotiation room exists.
- Schools are D-rated, which usually means shorter tenancies and higher turnover. Who's the typical renter profile here, and what's been the actual vacancy rate?
- The area grade is low — what's the realistic commute time and amenity access for the typical tenant pool here? Any planned neighborhood developments (good or bad) we should know about?
- What's the average days-on-market for RENTAL listings here right now (not sales)? A rising rental-DOM trend means longer vacancies and softer asking-rent achievability than the comps imply.
- What's the recent tenant-quality profile in this submarket — average credit score on applications, eviction rate, late-payment / NSF rate, and stable-employment percentage? A property-management company in the area should have these aggregated.
- How much new for-sale + rental construction is in the pipeline within 1–3 miles? Heavy new supply typically softens prices + rents 12–24 months out; constrained supply supports both.
Investment metrics
- 1% rule
- 0.90% ✗
- Cap rate
- 6.51%
- Cash-on-cash
- 0.78%
- DSCR
- 1.03
- GRM
- 9.3
CMA / ARV
- ARV (on-the-fly)
- $245,686
- Comps found
- 12
Show comp detail 12 sales within ~0.75 mi
| Address | Dist | Beds/Ba | Sqft | Sold | Price | $/sf | Match |
|---|---|---|---|---|---|---|---|
| 515 2nd St | 0.20mi | 3/2.0 (-1) | 1,550 (+2%) | 7mo | $210,000 | $135 | 77 |
| 103 Manor Dr | 0.54mi | 3/2.0 (-1) | 1,546 (+1%) | 10mo | $304,900 | $197 | 60 |
| 118 Mill St | 0.36mi | 3/1.5 (-1) | 1,698 (+11%) | 3mo | $225,000 | $133 | 54 |
| 307 W South Ave | 0.67mi | 3/2.0 (-1) | 1,550 (+2%) | 8mo | $250,000 | $161 | 54 |
| 311 Hawthorne Dr | 0.62mi | 3/2.0 (-1) | 1,468 (-4%) | 7mo | $245,000 | $167 | 54 |
| 709 Mulberry St | 0.70mi | 3/1.0 (-1) | 1,496 (-2%) | 2mo | $160,000 | $107 | 54 |
| 101 Hawthorne Dr | 0.42mi | 3/2.0 (-1) | 1,350 (-12%) | 8mo | $127,000 | $94 | 50 |
| 703 York Dr | 0.71mi | 3/2.5 (-1) | 1,448 (-5%) | 3mo | $310,000 | $214 | 49 |
| 301 Hargis Ln | 0.67mi | 4/2.0 | 1,704 (+12%) | 1mo | $295,000 | $173 | 48 |
| 806 Winesap Cir | 0.58mi | 4/3.0 | 1,713 (+12%) | 3mo | $324,900 | $190 | 46 |
| 202 E South Ave | 0.42mi | 3/1.5 (-1) | 1,736 (+14%) | 9mo | $244,900 | $141 | 43 |
| 303 W Sunrise Dr | 0.68mi | 3/3.0 (-1) | 1,682 (+10%) | 7mo | $235,000 | $140 | 36 |
Match score weights: distance 35% · size 25% · config 20% · recency 20%. Top-matched comps best support the ARV.
Projected returns pro-forma
-3.0% appreciation · 5.17% rent growth · sell at horizon
- IRR
- -12.6%
- Equity multiple
- 0.53×
- Total profit
- $-29,950
- Equity at exit
- $34,294
- IRR
- -0.6%
- Equity multiple
- 0.96×
- Total profit
- $-2,737
- Equity at exit
- $19,886
Cash invested: $64,400 (down + closing). Projections, not guarantees.
Landlord ↔ Tenant lean methodology
- Overall (STATE)
- 81 Strongly Landlord-Friendly
- State Missouri
- 81 Strongly Landlord-Friendly · R+10
- County
- — inherits STATE
- City
- — inherits STATE
ZIP-level market 64012
- Rents YoY
- 5.2%
- Active inventory
- 205
- Price-to-rent
- 9.3×
Monthly cashflow live
- Estimated rent
- $2,065 high interval (Pro) →
- Mortgage (P&I)
- −$1,206
- Tax est. 1.5%
- −$288 /mo · $3,450/yr
- Insurance
- −$96
- HOA
- −$0
- Vacancy / Maint / Mgmt
- −$434
- Net cashflow
- $42
Break-even live
Sensitivity live
| Price | -10% $201 | -5% $122 | +0% $42 | +5% $-37 | +10% $-117 |
|---|---|---|---|---|---|
| Rent | -10% $-121 | -5% $-39 | +0% $42 | +5% $124 | +10% $205 |
| Rate | -1.0pp $158 | -0.5pp $101 | base $42 | +0.5pp $-17 | +1.0pp $-78 |
UW: 25.0% down · 7.5% · 30yr · 1.5% tax · 5.0% vac · 8.0% maint · 8.0% mgmt
Financing live
Cash to close
- Down payment
- $57,500
- Closing costs
- $6,900
- Reserves months
- —
- Total cash needed
- —
Loan-product check · same deal, 3 products live
Conventional
25% down · 7.5% · 30yr
- Down + closing
- —
- Monthly P&I
- —
- Monthly cashflow
- —
- DSCR
- —
- Eligible?
- —
Personal DTI + credit; lowest rate.
DSCR
20% down · 8.5% · 30yr
- Down + closing
- —
- Monthly P&I
- —
- Monthly cashflow
- —
- DSCR
- —
- Eligible?
- —
No personal income docs; deal must DSCR.
Hard money
10% down · 12.0% · 12mo
- Down + closing
- —
- Monthly P&I
- —
- Monthly cashflow
- —
- DSCR
- —
- Eligible?
- —
Short-term bridge; refi at stabilization.
Rent comps 17 comps
| Address | Beds | Baths | Sqft | Rent | $/sqft | DOM | Units | Dist |
|---|---|---|---|---|---|---|---|---|
| 401 Lacy Ln Belton, MO | 4.0 | 2.0 | 1225 | $1,750 | $1.43 | 9d | 1 | 0.65mi |
| 161 Rainbow Dr Belton, MO | 3.0 | 2.0 | 1624 | $1,478 | $0.91 | 25d | 1 | 0.69mi |
| 211 Apple Blossom Ln Belton, MO | 4.0 | 2.5 | 1414 | $2,066 | $1.46 | 4d | 1 | 0.70mi |
| 307 Dauphine St Belton, MO | 3.0 | 2.0 | 1225 | $1,495 | $1.22 | 25d | 1 | 0.79mi |
| 610 Winter Dr Belton, MO | 4.0 | 3.0 | 1959 | $2,673 | $1.36 | 25d | 1 | 0.83mi |
| 810 York Dr Belton, MO | 3.0 | 2.5 | 1148 | $1,781 | $1.55 | 22d | 1 | 0.84mi |
| 805 Emerson Dr Belton, MO | 4.0 | 3.0 | 1942 | $2,355 | $1.21 | 14d | 1 | 0.85mi |
| 611 W Sunrise Dr Belton, MO | 3.0 | 2.5 | 1496 | $1,990 | $1.33 | 9d | 1 | 1.01mi |
| 904 Ridge Dr Belton, MO | 5.0 | 2.0 | 1728 | $1,950 | $1.13 | 25d | 1 | 1.05mi |
| 909 Ridge Dr Belton, MO | 3.0 | 2.0 | 1539 | $1,756 | $1.14 | 22d | 1 | 1.06mi |
| 107 N Cleveland Ave Belton, MO | 3.0 | 2.0 | 1128 | $1,860 | $1.65 | 6d | 1 | 1.07mi |
| 117 Monroe Ave Belton, MO | 3.0 | 2.5 | 1972 | $1,950 | $0.99 | 9d | 1 | 1.14mi |
| 209 W 162nd Ter Belton, MO | 3.0 | 2.5 | 1325 | $1,565 | $1.18 | 5d | 1 | 1.24mi |
| 1513 Sycamore Dr Belton, MO | 2.0–3.0 | 2.5 | 1315 | $1,779 | $1.35 | 3d | 8 | 1.25mi |
| 834 Autumn Woods Dr VLG LOCH LOYD, MO | 3.0 | 2.5 | 1325 | $1,730 | $1.31 | 3d | 4 | 1.32mi |
| 1702 Pam Ct Belton, MO | 4.0 | 3.0 | 1443 | $2,099 | $1.45 | 45d | 1 | 1.36mi |
| 740 Connor St Belton, MO | 4.0 | 3.5 | 1816 | $2,550 | $1.40 | 3d | 1 | 1.43mi |
Listing history 4 events
-
2026-06-21days on market $230,000 Active 18 DOM
-
2026-06-18days on market $230,000 Active 15 DOM
-
2026-06-17remarks 445-char remark
-
2026-06-17$230,000 Active 14 DOM
ⓘ Source: listings_history table (triggers on properties + properties_extension) + one-shot
backfill from property_details.listing_events for pre-trigger history.
Nearby sold comps map
Loading sold comps map…
Walkable amenities ~0.75 mi
Loading nearby amenities…
Taxation est. · year 1
- Rental income
- $24,784
- − Mortgage interest
- −$12,884
- − Property taxes
- −$3,450
- − Insurance
- −$1,150
- − Repairs & maintenance
- −$1,983
- − Management
- −$1,983
- − Depreciation
- −$6,691
- Taxable loss
- −$3,356
- Est. tax savings @ 24.0%
- +$806
- After-tax cash flow
- $1,311/yr
For passive investors: Depreciation is non-cash, so a rental often shows a tax loss while cash-flowing — sheltering income. Rental losses are passive: they offset passive income freely, and up to $25,000/yr can offset ordinary (W-2) income if you actively participate and your MAGI is under $100k (phasing out to $0 by $150k); unused losses carry forward. On sale, claimed depreciation is recaptured at up to 25%, and gains may owe capital-gains tax (a 1031 exchange can defer both). Figures are a year-1 estimate at your 24.0% rate — not tax advice; consult a CPA.
Schools (NCES district)
- District
- Belton 124
- NCES district ID
- 2904620
- Math proficiency
- 28% ▼ -9.00%
- Reading proficiency
- 39% ▼ -9.00%
- Median HH income
- $56,946
- Composite
- 29.73/100
- National rank
- #6446
- State rank
- #216 of 324 in MO
Livability — Belton
- Score
- 76/100
- State rank
- #52
- US rank
- #3782
Category grades
Schools grade is shown separately in the Schools card above.
Census & demographics
- Census place
- Belton, MO
- County
- Cass County · 65,358 people
- City population
- 29,304
- Metro
- Kansas City, MO-KS
- Population (ZIP)
- 29,304
- Household income
- $71,814
- Rent vs Own
- Severe rent burden
- 1081.0
Population outlook (Cass County) Hauer SSP2
- Today (2025)
- 105,292 people
- By 2030
- 106,109 · +0.8%
- By 2040
- 105,786 · +0.5%
- By 2050
- 102,062 · -3.1%
- By 2075
- 88,569 · -15.9%
- By 2100
- 68,293 · -35.1%
Race, ethnicity, and origin ACS 2023
- Neighborhood character
- Predominantly White (80%)
- Race & ethnicity
- White 80% Two or more races 7% Hispanic / Latino 7% Black 6% Asian 1%
- Hispanic origin (detail)
- Mexican 5%
- Common ancestry
- Italian 2% Lithuanian 2% Portuguese 2%
- Foreign-born
- 2% · Canada
- Languages at home
- 96% English-only · Spanish 2% German/W. Germanic 1% Other Asian/Pacific 1%
Political lean MEDSL · Cass
- 2024 margin
- Solid R (+32.1) · D 33.3% · R 65.4% · Other 1.3%
- 2008→2024 swing
- -12.5pp toward R · 2008: -19.6pp · 2024: -32.1pp
- All cycles
- 2024: R+32.1 2020: R+31.6 2016: R+35.9 2012: R+28.4 2008: R+19.6
Not yet ingested
- Civics
- —
Market trends
- HPI YoY
- ▼ -244.76%
- Current HPI
- 214.6157
- Rent YoY
- ▲ 5.17%
- Metro
- Kansas City, MO-KS
- State GDP YoY
- ▲ 1.84%
- F500 in state
- 20
Industry mix (Fortune 500 HQ in MO)
| Industry | F500 HQs | Revenue |
|---|---|---|
| Healthcare | 1 | $163B |
|
||
| Insurance | 1 | $21B |
|
||
| Industrial Technology | 1 | $17B |
|
||
| Retail | 1 | $16B |
|
||
| Industrial Distribution | 1 | $10B |
|
||
| Utilities | 1 | $9B |
|
||
Cash-flow waterfall
monthlySold comps — $/sqft
last 12 mo · ≤1 miLoading sold comps…