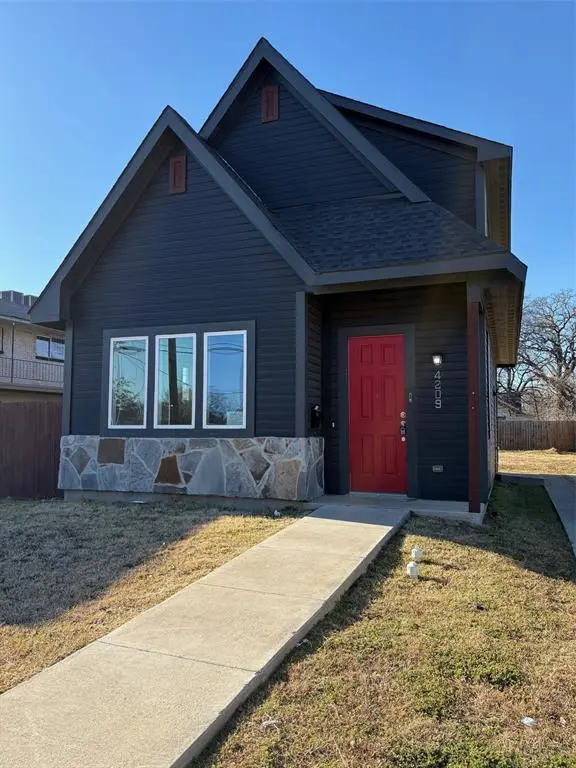
4209 Metropolitan Ave · Dallas, TX
Flood risk 1/10 · Minimal
- FEMA flood zone
- X (unshaded)
- Chance of flooding over 30 yrs
- 0.0%
- Est. flood insurance / yr
- $507 – $1,088
Fire risk 3/10 · Minor
- Est. fire insurance / yr
- $1,222 – $2,270
Heat risk 7/10 · Major
- Hot days now (above 109°F)
- 7 days/yr
- Hot days in 30 yrs
- 24 days/yr
Wind risk 6/10 · Moderate
- Chance of severe wind over 30 yrs
- 27.0%
Air-quality risk 2/10 · Minimal
- Unhealthy air days now
- 2 days/yr
- Unhealthy air days in 30 yrs
- 2 days/yr
Risk factors via First Street. Map © Google.
Why this score? — see what drove the D- grade
The composite is a weighted blend of 9 inputs, each scored 0–100. Each bar is that input's sub-score; the figure is the points it added to the 100-point composite (weight × sub-score).
- Cash flow +9.7/30.0
- Appreciation +5.5/10.0
- ARV discount +5.4/15.0
- 1% rule +4.2/10.0
- Livability +4.0/5.0
- Schools +2.8/10.0
- DSCR +2.7/10.0
- Rent growth +2.5/5.0
- Condition / age +2.5/5.0
$209,900
🖨 Deal sheet (PDF) 📄 Offer letter ✓ Due diligence
Listing remarks MLS
Price Adjustment! Two story home with open living room with ceiling fan, kitchen and dining area. Coat closet. Flex room with ceiling fan and sliding door open to patio and large backyard with wood fence. Two bedrooms with ceiling fans located on the 2nd floor with bathroom and laundry area for full size washer and dryer. Ceiling fans, smoke detector and lights in kitchen and both baths were replaced in 2026. Driveway in front.
Key facts
- Open living room
- Laundry area
- Large backyard
Tags
Neighborhood map
What this means for you Summary
Snapshot
- This is a 3-bed/2.0-bath single-family listed at $210k.
Deal economics
- At list price, monthly cash flow is $-140 ($-2k/yr) — negative.
- To cash-flow at today's rent, offer at most $185k (11.7% below list).
- To meet the 1% rule (rent ≥ 1% of price), the offer needs to be $192k (8.4% below list).
- Recommended offer: $185k (12.0% below list) — sets the bar for market timing.
- Cap rate 5.5% vs local median 2.3% in Dallas — top-decile yield for the area; either an underpriced asset or a hidden risk that comps aren't pricing in. Stress-test before assuming the spread holds.
Location & tenants
- Location reads 81/100 on livability (#24 in TX, #1,380 nationally) — a professional / high-income tenant draw. Strengths: amenities A+, commute A+, housing A+; Watch: crime F.
- Dallas ISD (urban): math 31% / reading 36% proficiency, ranked #559 of 826 in TX (top 68%) — families likely to look elsewhere, expect single-tenant / working-renter base with shorter leases; 83% free/reduced lunch — lower-income household profile, screen leases tightly.
- Zoned schools: Paul L Dunbar Learning Center (math 27% / reading 22%, grade F, #3,052 of 4,322 statewide, top 74%, 531 students, 95% FRL); Billy Earl Dade Middle (math 18% / reading 23%, grade F, #1,407 of 1,662 statewide, top 86%, 636 students, 100% FRL); James Madison H S (math 17% / reading 17%, grade F, #1,491 of 1,632 statewide, top 92%, 359 students, 96% FRL).
- Zoned-school proficiency averages 21% at this address vs 34% district-wide (-13 pts) — the specific schools serving this property underperform the Dallas ISD average; the district grade overstates school quality for this exact location.
- Market conditions: 81 active listings in the ZIP; 40 comparable units currently listed for rent nearby; rentals at typical pace (median 18d on market — plan ~3-4 weeks tenant-placement turnaround); 12,577 units permitted in Dallas County in 2024 (6,829 in 5+ unit buildings).
Forward outlook
- In year one you build about $4k of equity ($1k loan paydown + $2k appreciation (1.1% local appreciation)).
- Dallas County population projected at +35% by 2050 — long-run rental-demand tailwind backs the buy-and-hold thesis.
- By year 9, paydown + projected appreciation supports a ~$34k cash-out refi (75% LTV) — recoverable capital for the next deal without selling this one.
Negotiation context
- It's been on market 137 days — a 12% lower offer ($185k) is reasonable based on typical stale-listing flexibility.
- 7 sale attempts since 4y ago; this cycle's ask has dropped $45k (18%) from the opening price — seller is motivated, your offer sets the floor, not the list.
Risks & watch-outs
- Watch-outs: property tax is 2.7% of price.
- Climate carrying-cost: major wind risk, 27% chance of damaging wind over 30y; extreme-heat days projected 7→24/yr by 2055 (HVAC capex compounding) — expect insurance premiums to compound above CPI over the hold.
Questions for the listing agent
- What do current leases actually rent for vs. the listed asking? Can we see a recent rent roll and the last 12 months of T-12 income?
- It's been on market 137 days. Have you received any prior offers? Is the seller open to a 12% concession, seller financing, or rate buy-down credit?
- Property tax is high relative to price — has the assessment been appealed recently, and will the sale trigger a re-assessment?
- Why hasn't it sold? Are there any deal-killer items the seller is aware of (foundation, flood, title, zoning, code violations)?
- Is there a deadline driving the sale (1031 exchange, divorce, estate, relocation)? That informs how much negotiation room exists.
- Crime grade is F in this area — have there been break-ins, vandalism, or insurance claims at this property in the last 3 years? What carrier currently insures it and at what premium?
- The area grade is low — what's the realistic commute time and amenity access for the typical tenant pool here? Any planned neighborhood developments (good or bad) we should know about?
- What's the average days-on-market for RENTAL listings here right now (not sales)? A rising rental-DOM trend means longer vacancies and softer asking-rent achievability than the comps imply.
- What's the recent tenant-quality profile in this submarket — average credit score on applications, eviction rate, late-payment / NSF rate, and stable-employment percentage? A property-management company in the area should have these aggregated.
- How much new for-sale + rental construction is in the pipeline within 1–3 miles? Heavy new supply typically softens prices + rents 12–24 months out; constrained supply supports both.
Investment metrics
- 1% rule
- 0.92% ✗
- Cap rate
- 5.49%
- Cash-on-cash
- -2.85%
- DSCR
- 0.87
- GRM
- 9.1
CMA / ARV
- ARV (median comp)
- $200,339
- List price
- $209,900
- Delta
- 4.77%
- Verdict
- FAIR
- Comps
- 20 within 1.0 mi
Show comp detail 12 sales within ~0.75 mi
| Address | Dist | Beds/Ba | Sqft | Sold | Price | $/sf | Match |
|---|---|---|---|---|---|---|---|
| 4311 Metropolitan Ave | 0.10mi | 3/2.0 | 1,175 (-3%) | 2mo | $239,000 | $203 | 89 |
| 4219 Frank St | 0.16mi | 3/2.0 | 1,145 (-5%) | 2mo | $199,900 | $175 | 82 |
| 4222 Carl St | 0.09mi | 2/1.0 (-1) | 1,116 (-8%) | 4mo | $79,000 | $71 | 70 |
| 4418 Canal St | 0.32mi | 3/2.0 | 1,142 (-6%) | 10mo | $242,900 | $213 | 67 |
| 3610 Frank | 0.41mi | 3/2.0 | 1,320 (+9%) | 1mo | $234,900 | $178 | 64 |
| 4346 Hamilton Ave | 0.17mi | 3/2.0 | 1,381 (+14%) | 5mo | $225,000 | $163 | 64 |
| 4110 Carl | 0.11mi | 2/1.0 (-1) | 1,095 (-9%) | 8mo | $115,000 | $105 | 64 |
| 4827 Baldwin St | 0.52mi | 3/2.0 | 1,300 (+8%) | 1mo | $289,999 | $223 | 62 |
| 3814 Pine St | 0.46mi | 3/1.0 | 1,120 (-7%) | 0mo | $210,000 | $188 | 62 |
| 3719 Metropolitan Ave | 0.31mi | 3/1.0 | 1,088 (-10%) | 7mo | $225,000 | $207 | 59 |
| 1315 Caldwell Ave | 0.72mi | 3/2.0 | 1,266 (+5%) | 2mo | $189,950 | $150 | 57 |
| 4226 1st Ave | 0.64mi | 3/2.0 | 1,306 (+8%) | 11mo | $274,900 | $210 | 48 |
Match score weights: distance 35% · size 25% · config 20% · recency 20%. Top-matched comps best support the ARV.
Projected returns pro-forma
1.07% appreciation · 3.0% rent growth · sell at horizon
- IRR
- -1.4%
- Equity multiple
- 0.93×
- Total profit
- $-4,123
- Equity at exit
- $72,385
- IRR
- 3.6%
- Equity multiple
- 1.44×
- Total profit
- $25,863
- Equity at exit
- $96,759
Cash invested: $58,772 (down + closing). Projections, not guarantees.
Landlord ↔ Tenant lean methodology
- Overall (STATE)
- 87 Strongly Landlord-Friendly
- State Texas
- 87 Strongly Landlord-Friendly · R+5
- County
- — inherits STATE
- City
- — inherits STATE
ZIP-level market 75210
- Home prices YoY
- 0.6%
- Active inventory
- 81
- Price-to-rent
- 9.1×
Monthly cashflow live
- Estimated rent
- $1,923 high interval (Pro) →
- Mortgage (P&I)
- −$1,101
- Tax from tax record
- −$471 /mo · $5,647/yr
- Insurance
- −$87
- HOA
- −$0
- Lot rent
- −$0
- Vacancy / Maint / Mgmt
- −$404
- Net cashflow
- $-140
Break-even live
Sensitivity live
| Price | -10% $-21 | -5% $-80 | +0% $-140 | +5% $-199 | +10% $-258 |
|---|---|---|---|---|---|
| Rent | -10% $-291 | -5% $-216 | +0% $-140 | +5% $-64 | +10% $12 |
| Rate | -1.0pp $-34 | -0.5pp $-86 | base $-140 | +0.5pp $-194 | +1.0pp $-249 |
UW: 25.0% down · 7.5% · 30yr · 1.5% tax · 5.0% vac · 8.0% maint · 8.0% mgmt
Financing live
Cash to close
- Down payment
- $52,475
- Closing costs
- $6,297
- Reserves months
- —
- Total cash needed
- —
Loan-product check · same deal, 3 products live
Conventional
25% down · 7.5% · 30yr
- Down + closing
- —
- Monthly P&I
- —
- Monthly cashflow
- —
- DSCR
- —
- Eligible?
- —
Personal DTI + credit; lowest rate.
DSCR
20% down · 8.5% · 30yr
- Down + closing
- —
- Monthly P&I
- —
- Monthly cashflow
- —
- DSCR
- —
- Eligible?
- —
No personal income docs; deal must DSCR.
Hard money
10% down · 12.0% · 12mo
- Down + closing
- —
- Monthly P&I
- —
- Monthly cashflow
- —
- DSCR
- —
- Eligible?
- —
Short-term bridge; refi at stabilization.
Rent comps 40 comps
| Address | Beds | Baths | Sqft | Rent | $/sqft | DOM | Units | Dist |
|---|---|---|---|---|---|---|---|---|
| 4303 Jamaica St Dallas, TX | 3.0 | 2.0 | 1027 | $1,299 | $1.26 | 2d | 1 | 0.14mi |
| 2724 Swanson St Dallas, TX | 4.0 | 2.0 | 1368 | $2,350 | $1.72 | 46d | 1 | 0.29mi |
| 2720 Morning Ave Dallas, TX | 3.0 | 2.0 | 1332 | $2,350 | $1.76 | 46d | 1 | 0.29mi |
| 4525 Metropolitan Ave Dallas, TX | 3.0 | 2.0 | 1090 | $1,460 | $1.34 | 2d | 1 | 0.35mi |
| 2711 Cross St Dallas, TX | 2.0 | 1.0 | 700 | $1,249 | $1.78 | 2d | 1 | 0.41mi |
| 2714 Hector St Dallas, TX | 3.0 | 2.0 | 1233 | $2,100 | $1.70 | 27d | 1 | 0.43mi |
| 1514 Washington St Unit 105 Dallas, TX | 2.0 | 2.5 | 1404 | $2,950 | $2.10 | 10d | 1 | 0.43mi |
| 3639 Pine St Dallas, TX | 3.0 | 2.0 | 1090 | $1,490 | $1.37 | 16d | 1 | 0.49mi |
| 3726 Copeland St Dallas, TX | 3.0 | 2.0 | 1298 | $1,680 | $1.29 | 2d | 1 | 0.52mi |
| 4706 Spring Ave Dallas, TX | 3.0 | 2.0 | 1287 | $3,900 | $3.03 | 46d | 1 | 0.55mi |
| 3801 Carpenter Ave Dallas, TX | 4.0 | 2.0 | 1454 | $2,400 | $1.65 | 46d | 1 | 0.55mi |
| 3308 Birmingham Ave Unit 03 Dallas, TX | 2.0 | 2.5 | 1451 | $2,275 | $1.57 | 46d | 1 | 0.60mi |
| 3308 Birmingham Ave Unit 6 Dallas, TX | 2.0 | 2.5 | 1341 | $2,175 | $1.62 | 19d | 1 | 0.60mi |
| 3308 Birmingham Ave Unit 7 Dallas, TX | 2.0 | 2.5 | 1287 | $2,125 | $1.65 | 17d | 1 | 0.60mi |
| 3308 Birmingham Ave Unit 1 Dallas, TX | 2.0 | 2.5 | 1451 | $2,275 | $1.57 | 27d | 1 | 0.60mi |
| 3408 Spring Ave Dallas, TX | 3.0 | 2.0 | 780 | $1,314 | $1.68 | 2d | 1 | 0.62mi |
| 4717 Owenwood Ave Dallas, TX | 3.0 | 2.0 | 1090 | $1,490 | $1.37 | 16d | 1 | 0.64mi |
| 3915 Coolidge St Dallas, TX | 4.0 | 2.0 | 1416 | $2,100 | $1.48 | 46d | 1 | 0.68mi |
| 3907 Roberts Ave Dallas, TX | 3.0 | 1.0 | 908 | $1,395 | $1.54 | 17d | 1 | 0.72mi |
| 3619 York St Dallas, TX | 3.0 | 2.0 | 1298 | $1,714 | $1.32 | 2d | 1 | 0.75mi |
| 1315 S Barry Ave Dallas, TX | 1.0–2.0 | 1.0 | 670 | $1,040 | $1.55 | 13d | 5 | 0.86mi |
| 3627 Sidney St Dallas, TX | 3.0 | 2.0 | 1090 | $1,600 | $1.47 | 2d | 1 | 0.91mi |
| 3526 Elsie Faye Heggins St Dallas, TX | 3.0 | 2.0 | 1113 | $1,795 | $1.61 | 27d | 1 | 0.91mi |
| 3526 Elsie Faye Heggins St Dallas, TX | 3.0 | 2.0 | 1113 | $1,795 | $1.61 | 10d | 1 | 0.91mi |
| 4503 Bradshaw St Dallas, TX | 4.0 | 2.0 | 1263 | $1,600 | $1.27 | 10d | 1 | 0.91mi |
| 2847 Metropolitan Ave Dallas, TX | 3.0 | 1.0 | 1344 | $2,050 | $1.53 | 24d | 1 | 0.93mi |
| 4506 Roberts Ave Dallas, TX | 2.0 | 2.0 | 1000 | $1,499 | $1.50 | 0d | 1 | 0.94mi |
| 4611 Bradshaw St Dallas, TX | 3.0 | 2.0 | 1145 | $1,495 | $1.31 | 0d | 1 | 0.97mi |
| 3230 Elihu St #2 Dallas, TX | 2.0 | 3.5 | 1400 | $2,300 | $1.64 | 46d | 1 | 0.98mi |
| 3230 Elihu St #5 Dallas, TX | 2.0 | 3.5 | 1400 | $2,700 | $1.93 | 46d | 1 | 0.98mi |
| 2822 McDermott Ave Dallas, TX | 3.0 | 2.0 | 1200 | $1,795 | $1.50 | 27d | 1 | 1.00mi |
| 4722 Meadow St Dallas, TX | 2.0–3.0 | 2.0 | 1107 | $1,475 | $1.33 | 14d | 4 | 1.16mi |
| 3711 Guaranty St Dallas, TX | 3.0 | 1.0 | 984 | $1,800 | $1.83 | 17d | 1 | 1.17mi |
| 4024 Myrtle St Dallas, TX | 3.0 | 2.0 | 1106 | $1,595 | $1.44 | 7d | 1 | 1.18mi |
| 5221 Grovewood St Dallas, TX | 3.0 | 1.5 | 840 | $1,400 | $1.67 | 46d | 1 | 1.19mi |
| 2545 Metropolitan Ave Dallas, TX | 3.0 | 1.0 | 936 | $1,750 | $1.87 | 2d | 1 | 1.22mi |
| 5110 Lindsley Ave Dallas, TX | 2.0 | 2.0 | 1340 | $2,400 | $1.79 | 46d | 1 | 1.23mi |
| 4942 Garland Ave Dallas, TX | 3.0 | 1.0 | 1058 | $1,600 | $1.51 | 27d | 1 | 1.25mi |
| 4823 Ash Ln Dallas, TX | 4.0 | 2.0 | 1395 | $2,670 | $1.91 | 46d | 1 | 1.29mi |
| 5340 Dimple Jackson St Dallas, TX | 3.0 | 2.0 | 1298 | $1,814 | $1.40 | 2d | 1 | 1.31mi |
Listing history 38 events
-
2026-06-22days on market $209,900 Active 137 DOM
-
2026-06-21days on market $209,900 Active 136 DOM
-
2026-06-18days on market $209,900 Active 133 DOM
-
2026-06-17pricedays on market $209,900 Active 132 DOM
-
2026-06-16days on market $229,900 Active 131 DOM
-
2026-06-15days on market $229,900 Active 130 DOM
-
2026-06-13days on market $229,900 Active 128 DOM
-
2026-06-09days on market $229,900 Active 124 DOM
-
2026-06-08days on market $229,900 Active 123 DOM
-
2026-06-07days on market $229,900 Active 122 DOM
-
2026-06-04days on market $229,900 Active 119 DOM
-
2026-06-03days on market $229,900 Active 118 DOM
-
2026-06-02days on market $229,900 Active 117 DOM
-
2026-06-02days on market $229,900 Active 116 DOM
-
2026-05-31days on market $229,900 Active 115 DOM
-
2026-04-22price $234,900 431-char remark
Show marketing remark (431 chars)
Price Adjustment! Two story home with open living room with ceiling fan, kitchen and dining area. Coat closet. Flex room with ceiling fan and sliding door open to patio and large backyard with wood fence. Two bedrooms with ceiling fans located on the 2nd floor with bathroom and laundry area for full size washer and dryer. Ceiling fans, smoke detector and lights in kitchen and both baths were replaced in 2026. Driveway in front.
-
2026-03-23price $244,900 431-char remark
Show marketing remark (431 chars)
Price Adjustment! Two story home with open living room with ceiling fan, kitchen and dining area. Coat closet. Flex room with ceiling fan and sliding door open to patio and large backyard with wood fence. Two bedrooms with ceiling fans located on the 2nd floor with bathroom and laundry area for full size washer and dryer. Ceiling fans, smoke detector and lights in kitchen and both baths were replaced in 2026. Driveway in front.
-
2026-02-04$254,900 Active 431-char remark
Show marketing remark (431 chars)
Price Adjustment! Two story home with open living room with ceiling fan, kitchen and dining area. Coat closet. Flex room with ceiling fan and sliding door open to patio and large backyard with wood fence. Two bedrooms with ceiling fans located on the 2nd floor with bathroom and laundry area for full size washer and dryer. Ceiling fans, smoke detector and lights in kitchen and both baths were replaced in 2026. Driveway in front.
-
2025-07-01historical
-
2025-02-05$244,000 Active
-
2024-12-31historical
-
2024-10-01status Active
-
2024-09-30historical
-
2024-08-29price $249,000
-
2024-08-02price $259,000
-
2024-07-16$270,000 Active
-
2024-02-28historical $2,200
-
2024-01-27$2,200
-
2023-04-03soldstatus Closed
-
2023-03-18status Pending
-
2023-03-18status Active
-
2023-03-07status Pending
-
2023-02-14price $247,000
-
2023-01-10price $253,900
-
2022-12-12price $259,000
-
2022-12-12$269,000 Active
-
2022-07-29soldstatus
-
2019-11-25soldstatus
ⓘ Source: listings_history table (triggers on properties + properties_extension) + one-shot
backfill from property_details.listing_events for pre-trigger history.
Tax reassessment forecast TX · Resets to sale price
- Current annual tax
- $5,647 · $471/mo
- Projected year-2 tax
- $5,647 · $471/mo
- Expected delta
- $0/yr ($0/mo · 0.0%)
ⓘ Screening estimate from a state-policy table — verify with the county assessor before closing.
Climate risk First Street
- Flood 1/10 Low FEMA zone X (unshaded) · 0% chance over 30 yrs
- Wildfire 3/10 Moderate
- Heat 7/10 Severe 7 d/yr ≥109°F today · 24 d/yr by 30 yrs out
- Wind 6/10 Major 27% chance of damaging wind over 30 yrs
- Air quality 2/10 Low 2 unhealthy d/yr today · 2 by 30 yrs out
Nearby sold comps map
Loading sold comps map…
Walkable amenities ~0.75 mi
Loading nearby amenities…
Taxation est. · year 1
- Rental income
- $23,077
- − Mortgage interest
- −$11,758
- − Property taxes
- −$5,647
- − Insurance
- −$1,050
- − Repairs & maintenance
- −$1,846
- − Management
- −$1,846
- − Depreciation
- −$6,106
- Taxable loss
- −$5,176
- Est. tax savings @ 24.0%
- +$1,242
- After-tax cash flow
- $-433/yr
For passive investors: Depreciation is non-cash, so a rental often shows a tax loss while cash-flowing — sheltering income. Rental losses are passive: they offset passive income freely, and up to $25,000/yr can offset ordinary (W-2) income if you actively participate and your MAGI is under $100k (phasing out to $0 by $150k); unused losses carry forward. On sale, claimed depreciation is recaptured at up to 25%, and gains may owe capital-gains tax (a 1031 exchange can defer both). Figures are a year-1 estimate at your 24.0% rate — not tax advice; consult a CPA.
Schools (NCES district)
- District
- Dallas ISD
- NCES district ID
- 4816230
- Math proficiency
- 31% ▼ -16.00%
- Reading proficiency
- 36% ▼ -4.00%
- Median HH income
- $42,881
- Composite
- 28.41/100
- National rank
- #6763
- State rank
- #559 of 826 in TX
Livability — Dallas
- Score
- 81/100
- State rank
- #24
- US rank
- #1380
Category grades
Schools grade is shown separately in the Schools card above.
Census & demographics
- Census place
- Dallas, TX
- City population
- 1,168,437
- Population (ZIP)
- 7,458
Population outlook (Dallas County) Hauer SSP2
- Today (2025)
- 2,979,839 people
- By 2030
- 3,191,823 · +7.1%
- By 2040
- 3,619,611 · +21.5%
- By 2050
- 4,026,915 · +35.1%
- By 2075
- 4,957,073 · +66.4%
- By 2100
- 5,508,725 · +84.9%
Race, ethnicity, and origin ACS 2023
- Neighborhood character
- Majority Black (56%)
- Race & ethnicity
- Black 56% Hispanic / Latino 39% Two or more races 12% White 3% Asian 2%
- Hispanic origin (detail)
- Mexican 17%
- Foreign-born
- 23% · Canada, Vietnam
- Languages at home
- 66% English-only · Spanish 32% Vietnamese 2%
Political lean MEDSL · Dallas
- 2024 margin
- Strong D (+22.2) · D 60.2% · R 38.0% · Other 1.8%
- 2008→2024 swing
- +6.9pp toward D · 2008: 15.3pp · 2024: 22.2pp
- All cycles
- 2024: D+22.2 2020: D+31.6 2016: D+26.2 2012: D+15.4 2008: D+15.3
Not yet ingested
- Civics
- —
Market trends
- HPI YoY
- ▲ 1.07%
- Current HPI
- 177.2281
- Rent YoY
- —
- Metro
- —
- State GDP YoY
- ▲ 3.95%
- F500 in state
- 110
Industry mix (Fortune 500 HQ in TX)
| Industry | F500 HQs | Revenue |
|---|---|---|
| Energy | 16 | $1,198B |
|
||
| Technology | 5 | $198B |
|
||
| Engineering / Construction | 4 | $72B |
|
||
| Energy Services | 3 | $60B |
|
||
| Utilities | 3 | $41B |
|
||
| Healthcare | 2 | $330B |
|
||
Price history
-12.7% since first listed23 events — show timeline
- 2026-04-22 Price Changed $234,900 NTREIS
- 2026-03-23 Price Changed $244,900 NTREIS
- 2026-02-04 Listed $254,900 NTREIS
- 2025-07-01 Listing Removed — NTREIS
- 2025-02-05 Listed $244,000 NTREIS
- 2024-12-31 Listing Removed — NTREIS
- 2024-10-01 Relisted — NTREIS
- 2024-09-30 Listing Removed — NTREIS
- 2024-08-29 Price Changed $249,000 NTREIS
- 2024-08-02 Price Changed $259,000 NTREIS
- 2024-07-16 Listed $270,000 NTREIS
- 2024-02-28 Rental Removed $2,200 NTREIS
- 2024-01-27 Listed for Rent $2,200 NTREIS
- 2023-04-03 Sold (MLS) — NTREIS
- 2023-03-18 Pending — NTREIS
- 2023-03-18 Relisted — NTREIS
- 2023-03-07 Pending — NTREIS
- 2023-02-14 Price Changed $247,000 NTREIS
- 2023-01-10 Price Changed $253,900 NTREIS
- 2022-12-12 Price Changed $259,000 NTREIS
- 2022-12-12 Listed $269,000 NTREIS
- 2022-07-29 Sold (Public Records) — Public Records
- 2019-11-25 Sold (Public Records) — Public Records
Property tax history
+11.9%/yrLatest (2025): $5,647 · -0.4% YoY. Source: county tax records.
Cash-flow waterfall
monthlySold comps — $/sqft
last 12 mo · ≤1 miLoading sold comps…