2500 S 370th St #117 · Lakeland South, WA
Flood risk 1/10 · Minimal
- FEMA flood zone
- X (unshaded)
- Chance of flooding over 30 yrs
- 0.0%
- Est. flood insurance / yr
- $507 – $1,088
Fire risk 1/10 · Minimal
- Est. fire insurance / yr
- $604 – $1,122
Heat risk 3/10 · Minor
- Hot days now (above 88°F)
- 7 days/yr
- Hot days in 30 yrs
- 15 days/yr
Wind risk 1/10 · Minimal
- Chance of severe wind over 30 yrs
- —
Air-quality risk 7/10 · Major
- Unhealthy air days now
- 10 days/yr
- Unhealthy air days in 30 yrs
- 11 days/yr
Risk factors via First Street. Map © Google.
Why this score? — see what drove the B+ grade
The composite is a weighted blend of 9 inputs, each scored 0–100. Each bar is that input's sub-score; the figure is the points it added to the 100-point composite (weight × sub-score).
- Cash flow +30.0/30.0
- ARV discount +15.0/15.0
- 1% rule +10.0/10.0
- DSCR +10.0/10.0
- Livability +4.0/5.0
- Schools +3.9/10.0
- Condition / age +3.8/5.0
- Rent growth +3.1/5.0
- Appreciation +0.0/10.0
$79,500
🖨 Deal sheet (PDF) 📄 Offer letter ✓ Due diligence
Listing remarks
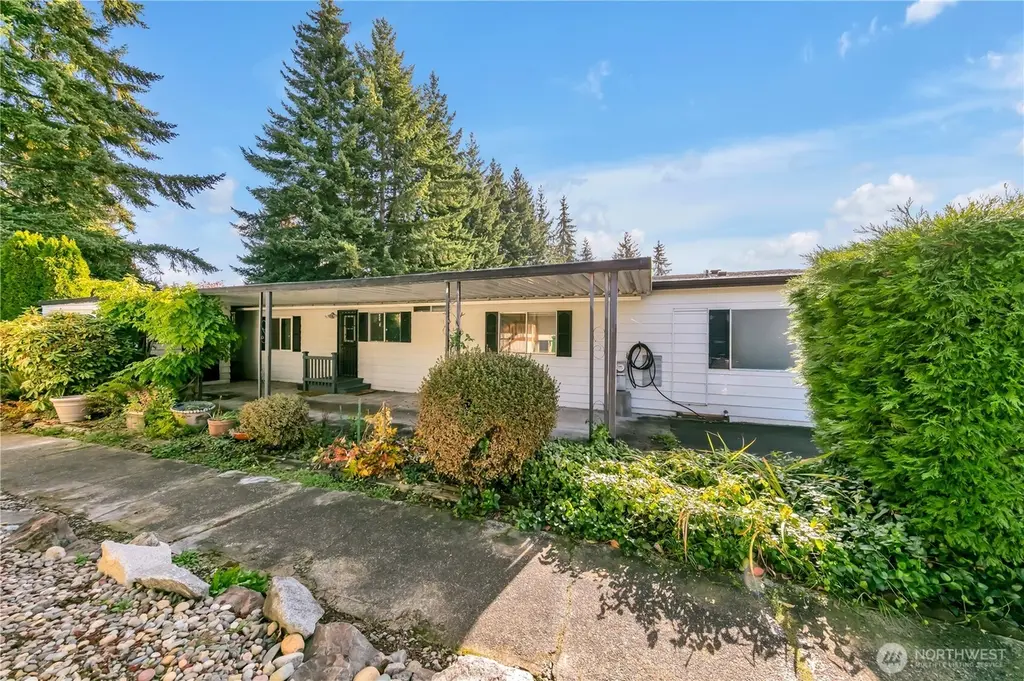
Extremely SPACIOUS 2304 square foot open floor plan in the wonderful 55+ Kloshe Illahee community! This TRIPLE WIDE has BEAUTIFUL VIEWS of the park. Massive primary suite has bathroom w/ soaking tub, double vanity, huge WIC & another ROOM, could be office or sitting room. Guest room is nicely sized w/ WIC & attached full bath. Great for entertaining w/ large kitchen, 2 separate living rooms, a dining room & BAR. NEW ROOF, newer water heater, crawl space w/ new insulation, new laminate floors & carpet. AC & Wood stove to keep you comfy. Relax & enjoy the big enclosed patio. Large shed for storage & carport. Clubhouse offers an exercise room, pool, ho
Key facts
- Double vanity
- Open floor plan
- Soaking tub
Tags
Neighborhood map
What this means for you Summary
Snapshot
- This is a 2-bed/2.0-bath manufactured listed at $80k. Condition is rated good.
Deal economics
- At list price, monthly cash flow is $1k ($17k/yr) — positive.
- The deal already cash-flows at list — no discount required.
- Meets the 1% rule at list price ($2k rent vs $80k).
- Recommended offer: $70k (12.0% below list) — sets the bar for market timing.
- Cap rate 27.5% vs local median 2.9% in Lakeland South — top-decile yield for the area; either an underpriced asset or a hidden risk that comps aren't pricing in. Stress-test before assuming the spread holds.
Location & tenants
- Location reads 79/100 on livability (#113 in WA, #2,299 nationally) — a middle-class / working-renter tenant base. Strengths: commute A+, employment A+, housing A+; Watch: amenities F, cost of living F.
- Federal Way School District (suburban): math 35% / reading 47% proficiency, ranked #207 of 291 in WA (top 71%) — families likely to look elsewhere, expect single-tenant / working-renter base with shorter leases.
- Market conditions: Rents rising (+2.3%/yr); 233 active listings in the ZIP; 1 comparable units currently listed for rent nearby; solid renter incomes; 10,555 units permitted in King County in 2024 (7,119 in 5+ unit buildings).
- This rent runs 39% of the median local income ($75k/yr) — at the standard rent-burdened threshold; future hikes will face affordability resistance.
Forward outlook
- Local home prices are declining (-3.0%/yr); year-one equity from $550 of loan paydown is wiped out by about $2k of value loss. Plan a longer hold.
- King County population projected at +44% by 2050 — long-run rental-demand tailwind backs the buy-and-hold thesis.
- At projected returns (-3.0% appreciation + 2.3% rent growth), your $22k cash investment doubles in ~2 years — after that, you're playing with house money.
Negotiation context
- It's been on market 215 days — a 12% lower offer ($70k) is reasonable based on typical stale-listing flexibility.
- 3 sale attempts; this cycle's ask has dropped $30k (28%) from the opening price — seller is motivated, your offer sets the floor, not the list.
Questions for the listing agent
- It's been on market 215 days. Have you received any prior offers? Is the seller open to a 12% concession, seller financing, or rate buy-down credit?
- Built in 1978 — when were the roof, HVAC, electrical panel, plumbing, and water heater last replaced?
- Why hasn't it sold? Are there any deal-killer items the seller is aware of (foundation, flood, title, zoning, code violations)?
- Is there a deadline driving the sale (1031 exchange, divorce, estate, relocation)? That informs how much negotiation room exists.
- What's the average days-on-market for RENTAL listings here right now (not sales)? A rising rental-DOM trend means longer vacancies and softer asking-rent achievability than the comps imply.
- What's the recent tenant-quality profile in this submarket — average credit score on applications, eviction rate, late-payment / NSF rate, and stable-employment percentage? A property-management company in the area should have these aggregated.
- How much new for-sale + rental construction is in the pipeline within 1–3 miles? Heavy new supply typically softens prices + rents 12–24 months out; constrained supply supports both.
Investment metrics
- 1% rule
- 3.11% ✓
- Cap rate
- 27.47%
- Cash-on-cash
- 75.65%
- DSCR
- 4.37
- GRM
- 2.7
CMA / ARV
- ARV (median comp)
- $122,968
- List price
- $79,500
- Delta
- -35.35%
- Verdict
- UNDERPRICED
- Comps
- 18 within 1.0 mi
Show comp detail 4 sales within ~0.75 mi
| Address | Dist | Beds/Ba | Sqft | Sold | Price | $/sf | Match |
|---|---|---|---|---|---|---|---|
| 2500 S 370th St #94 | 0.08mi | 2/2.0 | 2,304 (0%) | 16mo | $120,000 | $52 | 83 |
| 2500 S 370th St #126 | 0.08mi | 3/2.0 (+1) | 1,960 (-15%) | 7mo | $110,000 | $56 | 61 |
| 2500 Alder St #39 | 0.67mi | 2/2.0 | 2,312 (+0%) | 9mo | $112,000 | $48 | 60 |
| 2500 Alder St #208 | 0.71mi | 2/2.0 | 2,040 (-12%) | 19mo | $107,500 | $53 | 32 |
Match score weights: distance 35% · size 25% · config 20% · recency 20%. Top-matched comps best support the ARV.
Projected returns pro-forma
-3.0% appreciation · 2.33% rent growth · sell at horizon
- IRR
- 74.8%
- Equity multiple
- 4.36×
- Total profit
- $74,873
- Equity at exit
- $11,854
- IRR
- 78.4%
- Equity multiple
- 8.80×
- Total profit
- $173,732
- Equity at exit
- $6,874
Cash invested: $22,260 (down + closing). Projections, not guarantees.
Landlord ↔ Tenant lean methodology
- Overall (STATE)
- 28 Tenant-Leaning
- State Washington
- 28 Tenant-Leaning · D+8
- County
- — inherits STATE
- City
- — inherits STATE
ZIP-level market 98003
- Rents YoY
- 2.3%
- Active inventory
- 233
- Price-to-rent
- 2.7×
Monthly cashflow live
- Estimated rent
- $2,472 medium interval (Pro) →
- Mortgage (P&I)
- −$417
- Tax est. 1.5%
- −$99 /mo · $1,192/yr
- Insurance
- −$33
- HOA
- −$0
- Vacancy / Maint / Mgmt
- −$519
- Net cashflow
- $1,403
Break-even live
Sensitivity live
| Price | -10% $1,458 | -5% $1,431 | +0% $1,403 | +5% $1,376 | +10% $1,348 |
|---|---|---|---|---|---|
| Rent | -10% $1,208 | -5% $1,306 | +0% $1,403 | +5% $1,501 | +10% $1,599 |
| Rate | -1.0pp $1,443 | -0.5pp $1,423 | base $1,403 | +0.5pp $1,383 | +1.0pp $1,362 |
UW: 25.0% down · 7.5% · 30yr · 1.5% tax · 5.0% vac · 8.0% maint · 8.0% mgmt
Financing live
Cash to close
- Down payment
- $19,875
- Closing costs
- $2,385
- Reserves months
- —
- Total cash needed
- —
Loan-product check · same deal, 3 products live
Conventional
25% down · 7.5% · 30yr
- Down + closing
- —
- Monthly P&I
- —
- Monthly cashflow
- —
- DSCR
- —
- Eligible?
- —
Personal DTI + credit; lowest rate.
DSCR
20% down · 8.5% · 30yr
- Down + closing
- —
- Monthly P&I
- —
- Monthly cashflow
- —
- DSCR
- —
- Eligible?
- —
No personal income docs; deal must DSCR.
Hard money
10% down · 12.0% · 12mo
- Down + closing
- —
- Monthly P&I
- —
- Monthly cashflow
- —
- DSCR
- —
- Eligible?
- —
Short-term bridge; refi at stabilization.
Rent comps 1 comps
| Address | Beds | Baths | Sqft | Rent | $/sqft | DOM | Units | Dist |
|---|---|---|---|---|---|---|---|---|
| 2816 Laurel Loop Milton, WA | 3.0 | 2.5 | 2272 | $3,595 | $1.58 | 17d | 1 | 1.49mi |
Listing history 28 events
-
2026-06-21days on market $79,500 Active 215 DOM
-
2026-06-18days on market $79,500 Active 212 DOM
-
2026-06-17days on market $79,500 Active 211 DOM
-
2026-06-16days on market $79,500 Active 210 DOM
-
2026-06-15days on market $79,500 Active 209 DOM
-
2026-06-13pricedays on market $79,500 Active 207 DOM
-
2026-06-09days on market $89,500 Active 203 DOM
-
2026-06-08days on market $89,500 Active 202 DOM
-
2026-06-07days on market $89,500 Active 201 DOM
-
2026-06-04days on market $89,500 Active 198 DOM
-
2026-06-03days on market $89,500 Active 197 DOM
-
2026-06-02days on market $89,500 Active 196 DOM
-
2026-06-01days on market $89,500 Active 195 DOM
-
2026-05-31days on market $89,500 Active 194 DOM
-
2026-05-08price $91,500
-
2026-05-08price $91,500
-
2026-04-30price $93,500
-
2026-04-30price $93,500
-
2026-03-17price $95,000
-
2026-03-17price $95,000
-
2026-02-25price $99,950
-
2026-02-25price $99,950
-
2026-01-13price $110,000
-
2026-01-02price $125,000
-
2025-11-21status Active
-
2025-11-01status Pending
-
2025-10-30$130,000 Active
-
2025-10-30$110,000 Active
ⓘ Source: listings_history table (triggers on properties + properties_extension) + one-shot
backfill from property_details.listing_events for pre-trigger history.
Climate risk First Street
- Flood 1/10 Low FEMA zone X (unshaded) · 0% chance over 30 yrs
- Wildfire 1/10 Low
- Heat 3/10 Moderate 7 d/yr ≥88°F today · 15 d/yr by 30 yrs out
- Wind 1/10 Low
- Air quality 7/10 Severe 10 unhealthy d/yr today · 11 by 30 yrs out
Nearby sold comps map
Loading sold comps map…
Walkable amenities ~0.75 mi
Loading nearby amenities…
Taxation est. · year 1
- Rental income
- $29,661
- − Mortgage interest
- −$4,453
- − Property taxes
- −$1,192
- − Insurance
- −$398
- − Repairs & maintenance
- −$2,373
- − Management
- −$2,373
- − Depreciation
- −$2,313
- Taxable income
- $16,559
- Est. tax owed @ 24.0%
- −$3,974
- After-tax cash flow
- $12,865/yr
For passive investors: Depreciation is non-cash, so a rental often shows a tax loss while cash-flowing — sheltering income. Rental losses are passive: they offset passive income freely, and up to $25,000/yr can offset ordinary (W-2) income if you actively participate and your MAGI is under $100k (phasing out to $0 by $150k); unused losses carry forward. On sale, claimed depreciation is recaptured at up to 25%, and gains may owe capital-gains tax (a 1031 exchange can defer both). Figures are a year-1 estimate at your 24.0% rate — not tax advice; consult a CPA.
Condition & rehab AI · 5 photos
This triple-wide manufactured home in the Kloshe Illahee community is in good condition with a good condition score of 75. It has a good roof, exterior, and interior, and is well-maintained with a good landscaping and curb appeal. The home is ready for a new owner and would benefit from a fresh coat of paint and some trimming of the bushes to enhance its curb appeal and resale value.
Value-add opportunities
- Both Paint exterior — Enhances curb appeal and resale value
- Both Trim bushes — Improves landscaping and enhances curb appeal
Renovation cost estimate screening
Value-add ROI direction
- Both Paint exterior — Enhances curb appeal and resale value ↑
- Both Trim bushes — Improves landscaping and enhances curb appeal ↑
ⓘ Cost ranges are severity-bucket heuristics (US national rule-of-thumb). Get contractor quotes + a written scope before underwriting a rehab budget.
Schools (NCES district)
- District
- Federal Way School District
- NCES district ID
- 5302820
- Math proficiency
- 35% ▬ 0.00%
- Reading proficiency
- 47% ▬ 0.00%
- Median HH income
- $61,594
- Composite
- 38.79/100
- National rank
- #8361
- State rank
- #207 of 291 in WA
Livability — Lakeland South
- Score
- 79/100
- State rank
- #113
- US rank
- #2299
Category grades
Schools grade is shown separately in the Schools card above.
Census & demographics
- Census place
- Lakeland South, WA
- County
- King County · 2,251,916 people
- Metro
- Seattle-Tacoma-Bellevue, WA
- Population (ZIP)
- 51,619
- Household income
- $75,319
- Rent vs Own
- Severe rent burden
- 2895.0
Population outlook (King County) Hauer SSP2
- Today (2025)
- 2,576,485 people
- By 2030
- 2,803,316 · +8.8%
- By 2040
- 3,255,921 · +26.4%
- By 2050
- 3,706,444 · +43.9%
- By 2075
- 4,746,063 · +84.2%
- By 2100
- 5,407,730 · +109.9%
Race, ethnicity, and origin ACS 2023
- Neighborhood character
- Highly diverse neighborhood (Simpson 0.79)
- Race & ethnicity
- White 32% Hispanic / Latino 23% Black 19% Two or more races 16% Asian 13% Pacific Islander 2%
- Hispanic origin (detail)
- Mexican 18%
- Common ancestry
- Portuguese 3% Lithuanian 2% Swedish 2%
- Foreign-born
- 32% · Canada, South Korea, Vietnam
- Languages at home
- 57% English-only · Spanish 18% Other Indo-European 3% Russian/Polish/Slavic 3%
Political lean MEDSL · King
- 2024 margin
- Solid D (+51.7) · D 74.2% · R 22.5% · Other 3.4%
- 2008→2024 swing
- +9.6pp toward D · 2008: 42.1pp · 2024: 51.7pp
- All cycles
- 2024: D+51.7 2020: D+52.7 2016: D+50.4 2012: D+39.9 2008: D+42.1
Not yet ingested
- Civics
- —
Market trends
- HPI YoY
- ▼ -623.87%
- Current HPI
- 327.5371
- Rent YoY
- ▲ 2.33%
- Metro
- Seattle-Tacoma-Bellevue, WA
- State GDP YoY
- ▲ 4.65%
- F500 in state
- 22
Industry mix (Fortune 500 HQ in WA)
| Industry | F500 HQs | Revenue |
|---|---|---|
| Retail | 2 | $269B |
|
||
| Technology / Retail | 1 | $638B |
|
||
| Technology | 1 | $245B |
|
||
| Telecommunications | 1 | $38B |
|
||
| Food / Beverage | 1 | $36B |
|
||
| Automotive / Trucks | 1 | $34B |
|
||
Price history
-29.6% since first listed14 events — show timeline
- 2026-05-08 Price Changed $91,500 NWMLS as Distributed by MLS Grid
- 2026-05-08 Price Changed $91,500 NWMLS as Distributed by MLS Grid
- 2026-04-30 Price Changed $93,500 NWMLS as Distributed by MLS Grid
- 2026-04-30 Price Changed $93,500 NWMLS as Distributed by MLS Grid
- 2026-03-17 Price Changed $95,000 NWMLS as Distributed by MLS Grid
- 2026-03-17 Price Changed $95,000 NWMLS as Distributed by MLS Grid
- 2026-02-25 Price Changed $99,950 NWMLS as Distributed by MLS Grid
- 2026-02-25 Price Changed $99,950 NWMLS as Distributed by MLS Grid
- 2026-01-13 Price Changed $110,000 NWMLS as Distributed by MLS Grid
- 2026-01-02 Price Changed $125,000 NWMLS as Distributed by MLS Grid
- 2025-11-21 Relisted — NWMLS as Distributed by MLS Grid
- 2025-11-01 Pending — NWMLS as Distributed by MLS Grid
- 2025-10-30 Listed $110,000 NWMLS as Distributed by MLS Grid
- 2025-10-30 Listed $130,000 NWMLS as Distributed by MLS Grid
Cash-flow waterfall
monthlySold comps — $/sqft
last 12 mo · ≤1 miLoading sold comps…