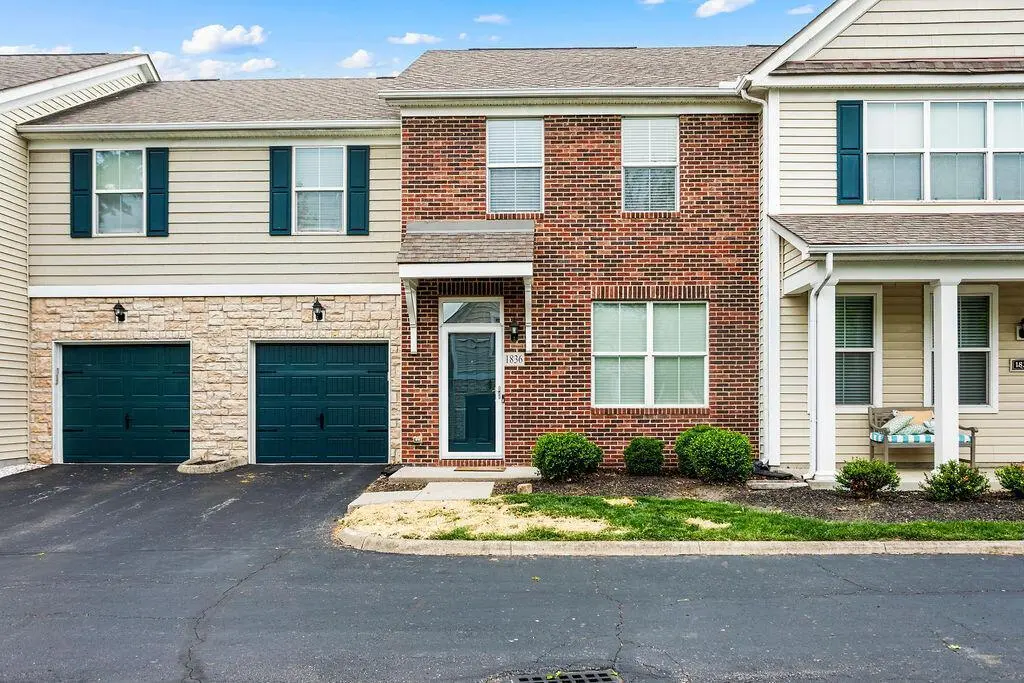
1836 Epic Way #38 · Grove City, OH
Flood risk 1/10 · Minimal
- FEMA flood zone
- X (unshaded)
- Chance of flooding over 30 yrs
- 0.0%
- Est. flood insurance / yr
- $507 – $1,088
Fire risk 1/10 · Minimal
- Est. fire insurance / yr
- $713 – $1,323
Heat risk 4/10 · Minor
- Hot days now (above 100°F)
- 7 days/yr
- Hot days in 30 yrs
- 18 days/yr
Wind risk 2/10 · Minimal
- Chance of severe wind over 30 yrs
- 1.0%
Air-quality risk 2/10 · Minimal
- Unhealthy air days now
- 1 days/yr
- Unhealthy air days in 30 yrs
- 2 days/yr
Risk factors via First Street. Map © Google.
Why this score? — see what drove the D grade
The composite is a weighted blend of 9 inputs, each scored 0–100. Each bar is that input's sub-score; the figure is the points it added to the 100-point composite (weight × sub-score).
- ARV discount +15.0/15.0
- Cash flow +7.2/30.0
- Livability +3.9/5.0
- Schools +3.8/10.0
- 1% rule +3.5/10.0
- Rent growth +3.4/5.0
- Condition / age +2.5/5.0
- DSCR +1.4/10.0
- Appreciation +0.0/10.0
$270,000
🖨 Deal sheet (PDF) 📄 Offer letter ✓ Due diligence
Listing remarks MLS
Beautiful Parkway Crossing Condo. 3 bedrooms plus a 2nd story family area would be a perfect den or office space. Nice kitchen with stainless steel appliances. Multi color glass back splash and spice color upgraded cabinets. Master bedroom suite has cathedral ceilings, ceiling an and walk in closet. This unit is right around the corner from the clubhouse and pool. No work needed here, move right in.
Key facts
- $320 HOA
- Garage
- Community pool
Property features AI
Finance
- Other: Home warranty included
- HOA & community: Homeowners association with monthly fee of $320; HOA amenities include gated community, clubhouse, fitness facility, and pool; HOA fees cover lawn care, insurance, and snow removal
Exterior
- Parking: Attached garage with garage door opener; 1-car garage
- Security: Security system
- Utilities: Public water; Public sewer
- Home design: Condominium; Two levels; Two or more shared walls; Built in 2006
- Construction: Slab foundation
- Exterior features: Patio; Inground pool
Interior
- Flooring: Wood flooring; Carpeted areas
- Bathrooms: Two full bathrooms; One half bathroom
- Heating & cooling: Central air conditioning
- Interior features: Insulated windows throughout; Patio access
Neighborhood map
What this means for you Summary
Snapshot
- This is a 3-bed/2.5-bath condo listed at $270k.
Deal economics
- At list price, monthly cash flow is $-369 ($-4k/yr) — negative.
- To cash-flow at today's rent, offer at most $205k (24.2% below list).
- To meet the 1% rule (rent ≥ 1% of price), the offer needs to be $228k (15.5% below list).
- Recommended offer: $205k (24.2% below list) — sets the bar for cash-flow.
- Cap rate 4.7% vs local median 2.7% in Grove City — top-decile yield for the area; either an underpriced asset or a hidden risk that comps aren't pricing in. Stress-test before assuming the spread holds.
Location & tenants
- Location reads 77/100 on livability (#190 in OH, #2,911 nationally) — a middle-class / working-renter tenant base. Strengths: employment A+, cost of living A+, housing A+; Watch: commute D, amenities F, health & safety F.
- South-Western City (suburban): math 40% / reading 48% proficiency, ranked #500 of 656 in OH (top 76%) — families likely to look elsewhere, expect single-tenant / working-renter base with shorter leases.
- Zoned schools: Monterey Elementary School (math 52% / reading 52%, grade C-, #851 of 1,584 statewide, top 56%, 426 students, 43% FRL); Park Street Intermediate School (math 41% / reading 55%, grade C-, #441 of 654 statewide, top 68%, 700 students, 51% FRL); Grove City High School (math 45% / reading 74%, grade C+, #243 of 781 statewide, top 33%, 1,881 students, 24% FRL).
- Market conditions: Rents rising (+3.7%/yr); 329 active listings in the ZIP; 4 comparable units currently listed for rent nearby; rentals lingering (median 46d on market — plan ~5-8 weeks vacancy on turnover, expect pricing pressure); 50% of comp listings sitting > 30 days — soft ceiling on asking rent; solid renter incomes; 8,139 units permitted in Franklin County in 2024 (5,940 in 5+ unit buildings).
- This rent runs 30% of the median local income ($91k/yr) — at the standard rent-burdened threshold; future hikes will face affordability resistance.
Forward outlook
- Local home prices are declining (-3.0%/yr); year-one equity from $2k of loan paydown is wiped out by about $8k of value loss. Plan a longer hold.
- Franklin County population projected at +34% by 2050 — long-run rental-demand tailwind backs the buy-and-hold thesis.
Negotiation context
- It's been on market 44 days — a 3% lower offer ($262k) is reasonable based on typical stale-listing flexibility.
- 3 sale attempts since 19y ago with the ask held roughly flat each time — persistent listings suggest the price (not the market) is what's stuck; bring a comps-based counter.
- Current owner paid $150k; list at $270k implies a 80% gain — meaningful room to come down on a strong offer.
Questions for the listing agent
- What do current leases actually rent for vs. the listed asking? Can we see a recent rent roll and the last 12 months of T-12 income?
- It's been on market 44 days. Have you received any prior offers? Is the seller open to a 24% concession, seller financing, or rate buy-down credit?
- What does the HOA fee cover, when was the last increase, and are there any pending special assessments or reserve-fund shortfalls?
- Any open or pending special assessments — roof, HVAC, plumbing, elevator, façade? What's the per-unit balance and payoff schedule, and is the seller paying it off at close or rolling it to the buyer?
- Is there a deadline driving the sale (1031 exchange, divorce, estate, relocation)? That informs how much negotiation room exists.
- Schools are A-rated — typically a magnet for longer-tenancy family renters. What's the average tenant stay here, and is there a school-zone premium baked into asking?
- The area grade is low — what's the realistic commute time and amenity access for the typical tenant pool here? Any planned neighborhood developments (good or bad) we should know about?
- What's the average days-on-market for RENTAL listings here right now (not sales)? A rising rental-DOM trend means longer vacancies and softer asking-rent achievability than the comps imply.
- What's the recent tenant-quality profile in this submarket — average credit score on applications, eviction rate, late-payment / NSF rate, and stable-employment percentage? A property-management company in the area should have these aggregated.
- How much new apartment / multifamily construction is in the pipeline within 1–3 miles? Heavy new supply (>2% of stock underway) typically softens rents 12–24 months out; light construction supports rent growth.
Investment metrics
- 1% rule
- 0.85% ✗
- Cap rate
- 4.65%
- Cash-on-cash
- -5.86%
- DSCR
- 0.74
- GRM
- 9.9
CMA / ARV
- ARV (median comp)
- $331,149
- List price
- $270,000
- Delta
- -18.47%
- Verdict
- UNDERPRICED
- Comps
- 20 within 1.0 mi
Projected returns pro-forma
-3.0% appreciation · 3.68% rent growth · sell at horizon
- IRR
- -25.3%
- Equity multiple
- 0.13×
- Total profit
- $-65,487
- Equity at exit
- $40,258
- IRR
- -19.0%
- Equity multiple
- -0.06×
- Total profit
- $-79,878
- Equity at exit
- $23,345
Cash invested: $75,600 (down + closing). Projections, not guarantees.
Landlord ↔ Tenant lean methodology
- Overall (STATE)
- 73 Landlord-Friendly
- State Ohio
- 73 Landlord-Friendly · R+6
- County
- — inherits STATE
- City
- — inherits STATE
ZIP-level market 43123
- Rents YoY
- 3.7%
- Active inventory
- 329
- Price-to-rent
- 9.9×
Monthly cashflow live
- Estimated rent
- $2,282 medium interval (Pro) →
- Mortgage (P&I)
- −$1,416
- Tax from tax record
- −$324 /mo · $3,890/yr
- Insurance
- −$112
- HOA
- −$320
- Vacancy / Maint / Mgmt
- −$479
- Net cashflow
- $-369
Break-even live
Sensitivity live
| Price | -10% $-217 | -5% $-293 | +0% $-369 | +5% $-446 | +10% $-522 |
|---|---|---|---|---|---|
| Rent | -10% $-550 | -5% $-460 | +0% $-369 | +5% $-279 | +10% $-189 |
| Rate | -1.0pp $-233 | -0.5pp $-301 | base $-369 | +0.5pp $-439 | +1.0pp $-511 |
UW: 25.0% down · 7.5% · 30yr · 1.5% tax · 5.0% vac · 8.0% maint · 8.0% mgmt
Financing live
Cash to close
- Down payment
- $67,500
- Closing costs
- $8,100
- Reserves months
- —
- Total cash needed
- —
Loan-product check · same deal, 3 products live
Conventional
25% down · 7.5% · 30yr
- Down + closing
- —
- Monthly P&I
- —
- Monthly cashflow
- —
- DSCR
- —
- Eligible?
- —
Personal DTI + credit; lowest rate.
DSCR
20% down · 8.5% · 30yr
- Down + closing
- —
- Monthly P&I
- —
- Monthly cashflow
- —
- DSCR
- —
- Eligible?
- —
No personal income docs; deal must DSCR.
Hard money
10% down · 12.0% · 12mo
- Down + closing
- —
- Monthly P&I
- —
- Monthly cashflow
- —
- DSCR
- —
- Eligible?
- —
Short-term bridge; refi at stabilization.
Rent comps 4 comps
| Address | Beds | Baths | Sqft | Rent | $/sqft | DOM | Units | Dist |
|---|---|---|---|---|---|---|---|---|
| 1656 Nature Dr Grove City, OH | 3.0 | 2.5 | 1504 | $2,450 | $1.63 | 45d | 1 | 0.13mi |
| 4493 Marilyn Ct Grove City, OH | 2.0 | 2.0 | 1504 | $2,549 | $1.69 | 45d | 1 | 0.45mi |
| 4243 Farr Ct Grove City, OH | 2.0–3.0 | 1.0 | 935 | $1,599 | $1.71 | 14d | 13 | 0.74mi |
| 3986 Parkmead Dr Grove City, OH | 1.0–3.0 | 1.0–2.0 | 954 | $2,150 | $2.25 | 13d | 9 | 0.94mi |
HOA detail condo
- Monthly dues
- $320 · $3,840/yr
- Likely covers
- pool
- Assessments
- None detected in remarks — confirm with the listing agent.
Listing history 22 events
-
2026-06-21days on market $270,000 Active 44 DOM
-
2026-06-18days on market $270,000 Active 41 DOM
-
2026-06-17days on market $270,000 Active 40 DOM
-
2026-06-16days on market $270,000 Active 39 DOM
-
2026-06-15days on market $270,000 Active 38 DOM
-
2026-06-13days on market $270,000 Active 36 DOM
-
2026-06-09days on market $270,000 Active 32 DOM
-
2026-06-08days on market $270,000 Active 31 DOM
-
2026-06-07days on market $270,000 Active 30 DOM
-
2026-06-03days on market $270,000 Active 26 DOM
-
2026-06-02days on market $270,000 Active 25 DOM
-
2026-06-01days on market $270,000 Active 24 DOM
-
2026-05-31days on market $270,000 Active 23 DOM
-
2026-05-08$280,000 Active 1151-char remark
-
2026-05-07historical $280,000 1151-char remark
-
2016-06-01soldstatus $149,900
-
2016-05-26historical 402-char remark
Show marketing remark (402 chars)
Beautiful Parkway Crossing Condo. 3 bedrooms plus a 2nd story family area would be a perfect den or office space. Nice kitchen with stainless steel appliances. Multi color glass back splash and spice color upgraded cabinets. Master bedroom suite has cathedral ceilings, ceiling an and walk in closet. This unit is right around the corner from the clubhouse and pool. No work needed here, move right in.
-
2016-05-25soldstatus $149,900 Closed 402-char remark
Show marketing remark (402 chars)
Beautiful Parkway Crossing Condo. 3 bedrooms plus a 2nd story family area would be a perfect den or office space. Nice kitchen with stainless steel appliances. Multi color glass back splash and spice color upgraded cabinets. Master bedroom suite has cathedral ceilings, ceiling an and walk in closet. This unit is right around the corner from the clubhouse and pool. No work needed here, move right in.
-
2016-04-08historical Contingent Finance and Inspection 402-char remark
Show marketing remark (402 chars)
Beautiful Parkway Crossing Condo. 3 bedrooms plus a 2nd story family area would be a perfect den or office space. Nice kitchen with stainless steel appliances. Multi color glass back splash and spice color upgraded cabinets. Master bedroom suite has cathedral ceilings, ceiling an and walk in closet. This unit is right around the corner from the clubhouse and pool. No work needed here, move right in.
-
2016-04-05$149,900 Active 402-char remark
Show marketing remark (402 chars)
Beautiful Parkway Crossing Condo. 3 bedrooms plus a 2nd story family area would be a perfect den or office space. Nice kitchen with stainless steel appliances. Multi color glass back splash and spice color upgraded cabinets. Master bedroom suite has cathedral ceilings, ceiling an and walk in closet. This unit is right around the corner from the clubhouse and pool. No work needed here, move right in.
-
2007-12-29historical
-
2007-03-29$133,900
ⓘ Source: listings_history table (triggers on properties + properties_extension) + one-shot
backfill from property_details.listing_events for pre-trigger history.
Tax reassessment forecast OH · Partial reset (capped growth)
- Current annual tax
- $3,890 · $324/mo
- Projected year-2 tax
- $4,051 · $338/mo
- Expected delta
- +$161/yr (+$13/mo · 4.1%)
ⓘ Screening estimate from a state-policy table — verify with the county assessor before closing.
Climate risk First Street
- Flood 1/10 Low FEMA zone X (unshaded) · 0% chance over 30 yrs
- Wildfire 1/10 Low
- Heat 4/10 Moderate 7 d/yr ≥100°F today · 18 d/yr by 30 yrs out
- Wind 2/10 Low 100% chance of damaging wind over 30 yrs
- Air quality 2/10 Low 1 unhealthy d/yr today · 2 by 30 yrs out
Nearby sold comps map
Loading sold comps map…
Walkable amenities ~0.75 mi
Loading nearby amenities…
Taxation est. · year 1
- Rental income
- $27,389
- − Mortgage interest
- −$15,124
- − Property taxes
- −$3,890
- − Insurance
- −$1,350
- − Repairs & maintenance
- −$2,191
- − Management
- −$2,191
- − HOA
- −$3,840
- − Depreciation
- −$7,855
- Taxable loss
- −$9,052
- Est. tax savings @ 24.0%
- +$2,172
- After-tax cash flow
- $-2,261/yr
For passive investors: Depreciation is non-cash, so a rental often shows a tax loss while cash-flowing — sheltering income. Rental losses are passive: they offset passive income freely, and up to $25,000/yr can offset ordinary (W-2) income if you actively participate and your MAGI is under $100k (phasing out to $0 by $150k); unused losses carry forward. On sale, claimed depreciation is recaptured at up to 25%, and gains may owe capital-gains tax (a 1031 exchange can defer both). Figures are a year-1 estimate at your 24.0% rate — not tax advice; consult a CPA.
Schools (NCES district)
- District
- South-Western City
- NCES district ID
- 3904480
- Math proficiency
- 40% ▼ -18.00%
- Reading proficiency
- 48% ▼ -10.00%
- Median HH income
- $51,689
- Composite
- 37.95/100
- National rank
- #4305
- State rank
- #500 of 656 in OH
Livability — Grove City
- Score
- 77/100
- State rank
- #190
- US rank
- #2911
Category grades
Schools grade is shown separately in the Schools card above.
Census & demographics
- Census place
- Grove City, OH
- County
- Franklin County · 1,351,780 people
- City population
- 67,626
- Metro
- Columbus, OH
- Population (ZIP)
- 67,626
- Household income
- $91,008
- Rent vs Own
- Severe rent burden
- 1087.0
Population outlook (Franklin County) Hauer SSP2
- Today (2025)
- 1,456,139 people
- By 2030
- 1,556,890 · +6.9%
- By 2040
- 1,757,349 · +20.7%
- By 2050
- 1,950,539 · +34.0%
- By 2075
- 2,376,171 · +63.2%
- By 2100
- 2,636,796 · +81.1%
Race, ethnicity, and origin ACS 2023
- Neighborhood character
- Predominantly White (84%)
- Race & ethnicity
- White 84% Two or more races 6% Hispanic / Latino 5% Black 5% Asian 2%
- Common ancestry
- Romanian 2% Slovak 2% Italian 2%
- Foreign-born
- 4% · Canada, Vietnam, China
- Languages at home
- 93% English-only · Spanish 3% Russian/Polish/Slavic 1% Other Indo-European 1%
Political lean MEDSL · Franklin
- 2024 margin
- Strong D (+28.4) · D 63.7% · R 35.3% · Other 1.0%
- 2008→2024 swing
- +7.7pp toward D · 2008: 20.7pp · 2024: 28.4pp
- All cycles
- 2024: D+28.4 2020: D+31.4 2016: D+25.9 2012: D+21.7 2008: D+20.7
Not yet ingested
- Civics
- —
Market trends
- HPI YoY
- ▼ -241.42%
- Current HPI
- 238.709
- Rent YoY
- ▲ 3.68%
- Metro
- Columbus, OH
- State GDP YoY
- ▲ 1.98%
- F500 in state
- 48
Industry mix (Fortune 500 HQ in OH)
| Industry | F500 HQs | Revenue |
|---|---|---|
| Insurance | 3 | $145B |
|
||
| Industrial Machinery | 3 | $49B |
|
||
| Financial Services | 3 | $24B |
|
||
| Consumer Goods | 2 | $93B |
|
||
| Aerospace / Defense | 2 | $47B |
|
||
| Utilities | 2 | $33B |
|
||
Price history
+101.6% since first listed10 events — show timeline
- 2026-05-29 Price Changed $270,000 CBRMLS
- 2026-05-08 Listed $280,000 CBRMLS
- 2026-05-07 Coming Soon $280,000 CBRMLS
- 2016-06-01 Sold (Public Records) $149,900 Public Records
- 2016-05-26 Listing Removed — CBRMLS
- 2016-05-25 Sold (MLS) $149,900 CBRMLS
- 2016-04-08 Contingent — CBRMLS
- 2016-04-05 Listed $149,900 CBRMLS
- 2007-12-29 Listing Removed — CBRMLS
- 2007-03-29 Listed $133,900 CBRMLS
Property tax history
+2.0%/yrLatest (2024): $3,890 · +1.4% YoY. Source: county tax records.
Cash-flow waterfall
monthlySold comps — $/sqft
last 12 mo · ≤1 miLoading sold comps…