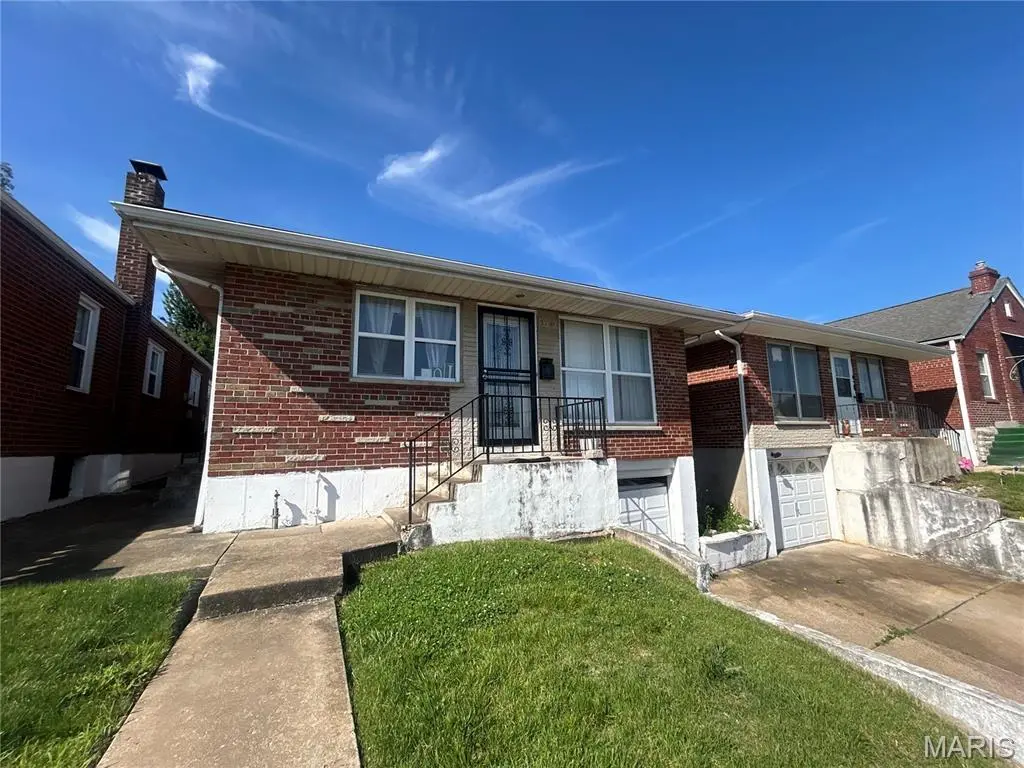
5740 Greer Ave · St. Louis, MO
Flood risk 1/10 · Minimal
- FEMA flood zone
- X (unshaded)
- Chance of flooding over 30 yrs
- 0.0%
- Est. flood insurance / yr
- $473 – $860
Fire risk 1/10 · Minimal
- Est. fire insurance / yr
- $1,054 – $1,958
Heat risk 5/10 · Moderate
- Hot days now (above 107°F)
- 7 days/yr
- Hot days in 30 yrs
- 21 days/yr
Wind risk 2/10 · Minimal
- Chance of severe wind over 30 yrs
- 1.0%
Air-quality risk 4/10 · Minor
- Unhealthy air days now
- 4 days/yr
- Unhealthy air days in 30 yrs
- 5 days/yr
Risk factors via First Street. Map © Google.
Why this score? — see what drove the B grade
The composite is a weighted blend of 9 inputs, each scored 0–100. Each bar is that input's sub-score; the figure is the points it added to the 100-point composite (weight × sub-score).
- Cash flow +30.0/30.0
- 1% rule +10.0/10.0
- DSCR +10.0/10.0
- ARV discount +7.5/15.0
- Appreciation +5.3/10.0
- Rent growth +2.5/5.0
- Livability +2.5/5.0
- Condition / age +2.5/5.0
- Schools +1.2/10.0
$70,000
🖨 Deal sheet (PDF) 📄 Offer letter ✓ Due diligence
Listing remarks
Great investment opportunity with a Section 8 tenant currently in place on a yearly lease, generating $1,400/month in rental income. The lease is expiring soon, and the tenant may vacate prior to closing, offering flexibility for investors or owner-occupants. This property features 3 bedrooms upstairs with a possible additional bedroom in the basement, 1 full bathroom on the main level, and a half bath downstairs. Recent updates include a new kitchen, updated bathroom, and newer AC unit. Additional features include a 1-car garage and extra living/storage space in the basement. Whether you’re looking to expand your rental portfolio or purchase a home with income potential, this propert
Key facts
- Newer ac unit
- New kitchen
- 1 car garage
Tags
Property features AI
Exterior
- Parking: Has garage
- Utilities: Public water; Public sewer; Electric service available; Natural gas available; Cable available
- Home design: Single-family residence; One story
- Construction: Brick construction
- Exterior features: Level lot
Interior
- Bedrooms: 3 bedrooms on the main level
- Bathrooms: 1 full bathroom; 1 half bathroom; Additional half bathroom on lower level
- Heating & cooling: Forced air heating; Central air conditioning
- Interior features: Full basement
Neighborhood map
What this means for you Summary
Snapshot
- This is a 3-bed/1.0-bath single-family listed at $70k.
Deal economics
- At list price, monthly cash flow is $495 ($6k/yr) — positive.
- The deal already cash-flows at list — no discount required.
- Meets the 1% rule at list price ($1k rent vs $70k).
- Recommended offer: $69k (1.5% below list) — sets the bar for market timing.
- Cap rate 14.8% vs local median 5.0% in St. Louis — top-decile yield for the area; either an underpriced asset or a hidden risk that comps aren't pricing in. Stress-test before assuming the spread holds.
Location & tenants
- Location reads: area grade B — affects rentability + tenant quality, not the cash-flow math above.
- St. Louis City (urban): math 10% / reading 18% proficiency, ranked #312 of 324 in MO (top 96%) — low school quality limits family demand, transient renter base, plan for 1-2y turnover; 80% free/reduced lunch — lower-income household profile, screen leases tightly.
- Zoned schools: Sigel Elem. Comm. Ed. Ctr. (math 2% / reading 2%, grade F, #1,099 of 1,115 statewide, top 100%, 219 students, 99% FRL); Gateway Middle (math 0% / reading 8%, grade F, #389 of 391 statewide, top 100%, 506 students, 99% FRL); Sumner High (math 2% / reading 2%, grade F, #520 of 521 statewide, top 100%, 264 students, 99% FRL) — zoned schools average 99% FRL vs 80% district-wide (18 pts higher); higher-poverty schools than district average — tighter screening recommended.
- Market conditions: 20 active listings in the ZIP; 14 comparable units currently listed for rent nearby; rentals at typical pace (median 26d on market — plan ~3-4 weeks tenant-placement turnaround); lower-income renter base — watch delinquency; 294 units permitted in St. Louis city in 2024 (227 in 5+ unit buildings).
- This rent runs 40% of the median local income ($35k/yr) — at the standard rent-burdened threshold; future hikes will face affordability resistance.
Forward outlook
- In year one you build about $862 of equity ($484 loan paydown + $378 appreciation (0.5% local appreciation)).
- St. Louis County population projected to shrink 6% by 2050 — rents likely to lag national; underwrite the cash flow, not the appreciation.
- At projected returns (0.5% appreciation + 3.0% rent growth), your $20k cash investment doubles in ~3 years — after that, you're playing with house money.
Negotiation context
- It's been on market 23 days — a 2% lower offer ($69k) is reasonable based on typical stale-listing flexibility.
- Current owner paid $50k; 40% above their basis — modest negotiation headroom, anchor on the comps not their cost.
Risks & watch-outs
- Climate carrying-cost: extreme-heat days projected 7→21/yr by 2055 (HVAC capex compounding) — expect insurance premiums to compound above CPI over the hold.
Questions for the listing agent
- Built in 1960 — when were the roof, HVAC, electrical panel, plumbing, and water heater last replaced?
- Is there a deadline driving the sale (1031 exchange, divorce, estate, relocation)? That informs how much negotiation room exists.
- What's the average days-on-market for RENTAL listings here right now (not sales)? A rising rental-DOM trend means longer vacancies and softer asking-rent achievability than the comps imply.
- What's the recent tenant-quality profile in this submarket — average credit score on applications, eviction rate, late-payment / NSF rate, and stable-employment percentage? A property-management company in the area should have these aggregated.
- How much new for-sale + rental construction is in the pipeline within 1–3 miles? Heavy new supply typically softens prices + rents 12–24 months out; constrained supply supports both.
Investment metrics
- 1% rule
- 1.67% ✓
- Cap rate
- 14.78%
- Cash-on-cash
- 30.30%
- DSCR
- 2.35
- GRM
- 5.0
CMA / ARV
- ARV (on-the-fly)
- $36,480
- Comps found
- 12
Show comp detail 12 sales within ~0.75 mi
| Address | Dist | Beds/Ba | Sqft | Sold | Price | $/sf | Match |
|---|---|---|---|---|---|---|---|
| 5710 Saint Louis Ave | 0.12mi | 2/1.0 (-1) | 1,000 (+4%) | 8mo | $25,000 | $25 | 76 |
| 34 Blakemore Pl | 0.51mi | 2/1.0 (-1) | 988 (+3%) | 2mo | $55,000 | $56 | 65 |
| 6241 Lorraine Ave | 0.71mi | 3/1.0 | 950 (-1%) | 4mo | $57,900 | $61 | 62 |
| 2810 Arlington Ave | 0.59mi | 2/1.0 (-1) | 968 (+1%) | 6mo | $25,000 | $26 | 61 |
| 6206 Lorraine Ave | 0.59mi | 3/1.0 | 918 (-4%) | 6mo | $69,900 | $76 | 60 |
| 5658 Maffitt Ave | 0.30mi | 2/1.0 (-1) | 850 (-12%) | 4mo | $25,000 | $29 | 59 |
| 5920 Dressell Ave | 0.61mi | 2/1.0 (-1) | 912 (-5%) | 3mo | $75,000 | $82 | 56 |
| 6219 Dardanella Ave | 0.70mi | 3/1.0 | 980 (+2%) | 13mo | $34,900 | $36 | 53 |
| 1636 Belt Ave | 0.72mi | 2/1.0 (-1) | 1,003 (+4%) | 9mo | $19,900 | $20 | 47 |
| 2505 Crescent Ave | 0.68mi | 3/1.0 | 850 (-12%) | 5mo | $100,000 | $118 | 45 |
| 1632 Belt Ave | 0.72mi | 2/1.0 (-1) | 1,003 (+4%) | 12mo | $37,900 | $38 | 44 |
| 2917 Abner Pl | 0.61mi | 3/1.0 | 1,104 (+15%) | 13mo | $25,000 | $23 | 36 |
Match score weights: distance 35% · size 25% · config 20% · recency 20%. Top-matched comps best support the ARV.
Projected returns pro-forma
0.54% appreciation · 3.0% rent growth · sell at horizon
- IRR
- 31.8%
- Equity multiple
- 2.59×
- Total profit
- $31,247
- Equity at exit
- $22,234
- IRR
- 34.7%
- Equity multiple
- 5.03×
- Total profit
- $78,980
- Equity at exit
- $28,301
Cash invested: $19,600 (down + closing). Projections, not guarantees.
Landlord ↔ Tenant lean methodology
- Overall (STATE)
- 81 Strongly Landlord-Friendly
- State Missouri
- 81 Strongly Landlord-Friendly · R+10
- County
- — inherits STATE
- City
- — inherits STATE
ZIP-level market 63120
- Home prices YoY
- 0.4%
- Active inventory
- 20
- Price-to-rent
- 5.0×
Monthly cashflow live
- Estimated rent
- $1,166 high interval (Pro) →
- Mortgage (P&I)
- −$367
- Tax from tax record
- −$30 /mo · $360/yr
- Insurance
- −$29
- HOA
- −$0
- Vacancy / Maint / Mgmt
- −$245
- Net cashflow
- $495
Break-even live
Sensitivity live
| Price | -10% $534 | -5% $515 | +0% $495 | +5% $475 | +10% $455 |
|---|---|---|---|---|---|
| Rent | -10% $403 | -5% $449 | +0% $495 | +5% $541 | +10% $587 |
| Rate | -1.0pp $530 | -0.5pp $513 | base $495 | +0.5pp $477 | +1.0pp $458 |
UW: 25.0% down · 7.5% · 30yr · 1.5% tax · 5.0% vac · 8.0% maint · 8.0% mgmt
Financing live
Cash to close
- Down payment
- $17,500
- Closing costs
- $2,100
- Reserves months
- —
- Total cash needed
- —
Loan-product check · same deal, 3 products live
Conventional
25% down · 7.5% · 30yr
- Down + closing
- —
- Monthly P&I
- —
- Monthly cashflow
- —
- DSCR
- —
- Eligible?
- —
Personal DTI + credit; lowest rate.
DSCR
20% down · 8.5% · 30yr
- Down + closing
- —
- Monthly P&I
- —
- Monthly cashflow
- —
- DSCR
- —
- Eligible?
- —
No personal income docs; deal must DSCR.
Hard money
10% down · 12.0% · 12mo
- Down + closing
- —
- Monthly P&I
- —
- Monthly cashflow
- —
- DSCR
- —
- Eligible?
- —
Short-term bridge; refi at stabilization.
Rent comps 14 comps
| Address | Beds | Baths | Sqft | Rent | $/sqft | DOM | Units | Dist |
|---|---|---|---|---|---|---|---|---|
| 5662 Maffitt Ave Saint Louis, MO | 2.0 | 1.0 | 850 | $895 | $1.05 | 9d | 1 | 0.31mi |
| 5818 Ferris Ave Saint Louis, MO | 3.0 | 1.0 | 1014 | $1,500 | $1.48 | 46d | 1 | 0.44mi |
| 5824 Ferris Ave Saint Louis, MO | 4.0 | 2.0 | 1008 | $1,500 | $1.49 | 46d | 1 | 0.45mi |
| 5608 Wabada Ave Saint Louis, MO | 2.0 | 1.0 | 910 | $1,300 | $1.43 | 18d | 1 | 0.51mi |
| 3720 Darby St Saint Louis, MO | 2.0 | 1.0 | 960 | $1,123 | $1.17 | 46d | 1 | 0.56mi |
| 2831 Abner Pl Unit 7 St. Louis, MO | 2.0 | 1.0 | 968 | $1,250 | $1.29 | 25d | 1 | 0.66mi |
| 1965 Arlington Ave Saint Louis, MO | 3.0 | 1.0 | 980 | $1,300 | $1.33 | 6d | 1 | 0.72mi |
| 4715 Thrush Ave Unit 24 St. Louis, MO | 2.0 | 1.0 | 900 | $1,350 | $1.50 | 25d | 1 | 1.18mi |
| 1420 Union Blvd Unit 2F St. Louis, MO | 2.0 | 1.0 | 1096 | $995 | $0.91 | 46d | 1 | 1.20mi |
| 4719 Plover Ave Saint Louis, MO | 2.0 | 1.0 | 744 | $995 | $1.34 | 6d | 1 | 1.20mi |
| 1266 Amherst Pl Unit 2nd floor St. Louis, MO | 2.0 | 1.0 | 1050 | $1,000 | $0.95 | 46d | 1 | 1.21mi |
| 5989 Julian Ave Unit 37 St. Louis, MO | 2.0 | 1.0 | 780 | $1,200 | $1.54 | 20d | 1 | 1.21mi |
| 4935 Alcott Ave Saint Louis, MO | 3.0 | 1.0 | 680 | $705 | $1.04 | 18d | 1 | 1.36mi |
| 5203 Page Blvd Unit 5201 1st Floor St. Louis, MO | 2.0 | 1.0 | 1000 | $750 | $0.75 | 16d | 1 | 1.41mi |
Listing history 16 events
-
2026-06-21days on market $70,000 Active 23 DOM
-
2026-06-18days on market $70,000 Active 20 DOM
-
2026-06-17days on market $70,000 Active 19 DOM
-
2026-06-16days on market $70,000 Active 18 DOM
-
2026-06-15days on market $70,000 Active 17 DOM
-
2026-06-13days on market $70,000 Active 15 DOM
-
2026-06-09days on market $70,000 Active 11 DOM
-
2026-06-08days on market $70,000 Active 10 DOM
-
2026-06-07days on market $70,000 Active 9 DOM
-
2026-06-05days on market $70,000 Active 6 DOM
-
2026-06-03days on market $70,000 Active 5 DOM
-
2026-06-02days on market $70,000 Active 4 DOM
-
2026-06-01days on market $70,000 Active 3 DOM
-
2026-05-31days on market $70,000 Active 2 DOM
-
2026-05-29$70,000 Active
-
2003-06-06soldstatus $50,000
ⓘ Source: listings_history table (triggers on properties + properties_extension) + one-shot
backfill from property_details.listing_events for pre-trigger history.
Tax reassessment forecast MO · Resets to sale price
- Current annual tax
- $360 · $30/mo
- Projected year-2 tax
- $679 · $57/mo
- Expected delta
- +$319/yr (+$27/mo · 88.5%)
ⓘ Screening estimate from a state-policy table — verify with the county assessor before closing.
Climate risk First Street
- Flood 1/10 Low FEMA zone X (unshaded) · 0% chance over 30 yrs
- Wildfire 1/10 Low
- Heat 5/10 Major 7 d/yr ≥107°F today · 21 d/yr by 30 yrs out
- Wind 2/10 Low 100% chance of damaging wind over 30 yrs
- Air quality 4/10 Moderate 4 unhealthy d/yr today · 5 by 30 yrs out
Nearby sold comps map
Loading sold comps map…
Walkable amenities ~0.75 mi
Loading nearby amenities…
Taxation est. · year 1
- Rental income
- $13,992
- − Mortgage interest
- −$3,921
- − Property taxes
- −$360
- − Insurance
- −$350
- − Repairs & maintenance
- −$1,119
- − Management
- −$1,119
- − Depreciation
- −$2,036
- Taxable income
- $5,086
- Est. tax owed @ 24.0%
- −$1,221
- After-tax cash flow
- $4,718/yr
For passive investors: Depreciation is non-cash, so a rental often shows a tax loss while cash-flowing — sheltering income. Rental losses are passive: they offset passive income freely, and up to $25,000/yr can offset ordinary (W-2) income if you actively participate and your MAGI is under $100k (phasing out to $0 by $150k); unused losses carry forward. On sale, claimed depreciation is recaptured at up to 25%, and gains may owe capital-gains tax (a 1031 exchange can defer both). Figures are a year-1 estimate at your 24.0% rate — not tax advice; consult a CPA.
Schools (NCES district)
- District
- St. Louis City
- NCES district ID
- 2929280
- Math proficiency
- 10% ▼ -6.00%
- Reading proficiency
- 18% ▼ -3.00%
- Median HH income
- $35,685
- Composite
- 11.54/100
- National rank
- #9699
- State rank
- #312 of 324 in MO
Livability — St. Louis
No livability data for this city. (Only ~50 U.S. cities are tracked.)
Census & demographics
- Census place
- St. Louis, MO
- County
- Saint Louis City · 254,015 people
- City population
- 283,259
- Metro
- St. Louis, MO-IL
- Population (ZIP)
- 6,790
- Household income
- $35,176
- Rent vs Own
- Severe rent burden
- 555.0
Population outlook (St. Louis County) Hauer SSP2
- Today (2025)
- 315,737 people
- By 2030
- 313,865 · -0.6%
- By 2040
- 305,439 · -3.3%
- By 2050
- 296,529 · -6.1%
- By 2075
- 271,028 · -14.2%
- By 2100
- 255,359 · -19.1%
Race, ethnicity, and origin ACS 2023
- Neighborhood character
- Predominantly Black (90%)
- Race & ethnicity
- Black 90% Two or more races 7% White 2%
- Foreign-born
- 1% · Canada
- Languages at home
- 97% English-only · Spanish 1% French/Haitian/Cajun 1%
Political lean MEDSL · St. Louis
- 2024 margin
- Solid D (+64.7) · D 81.4% · R 16.7% · Other 2.0%
- 2008→2024 swing
- -3.5pp toward R · 2008: 68.2pp · 2024: 64.7pp
- All cycles
- 2024: D+64.7 2020: D+66.2 2016: D+63.7 2012: D+66.6 2008: D+68.2
Not yet ingested
- Civics
- —
Market trends
- HPI YoY
- ▲ 0.54%
- Current HPI
- 141.8177
- Rent YoY
- —
- Metro
- St. Louis, MO-IL
- State GDP YoY
- ▲ 1.84%
- F500 in state
- 20
Industry mix (Fortune 500 HQ in MO)
| Industry | F500 HQs | Revenue |
|---|---|---|
| Healthcare | 1 | $163B |
|
||
| Insurance | 1 | $21B |
|
||
| Industrial Technology | 1 | $17B |
|
||
| Retail | 1 | $16B |
|
||
| Industrial Distribution | 1 | $10B |
|
||
| Utilities | 1 | $9B |
|
||
Price history
+40.0% since first listed2 events — show timeline
- 2026-05-29 Listed $70,000 MARIS as Distributed by MLS Grid
- 2003-06-06 Sold (Public Records) $50,000 Public Records
Property tax history
-1.2%/yrLatest (2024): $360 · +4.7% YoY. Source: county tax records.
Cash-flow waterfall
monthlySold comps — $/sqft
last 12 mo · ≤1 miLoading sold comps…