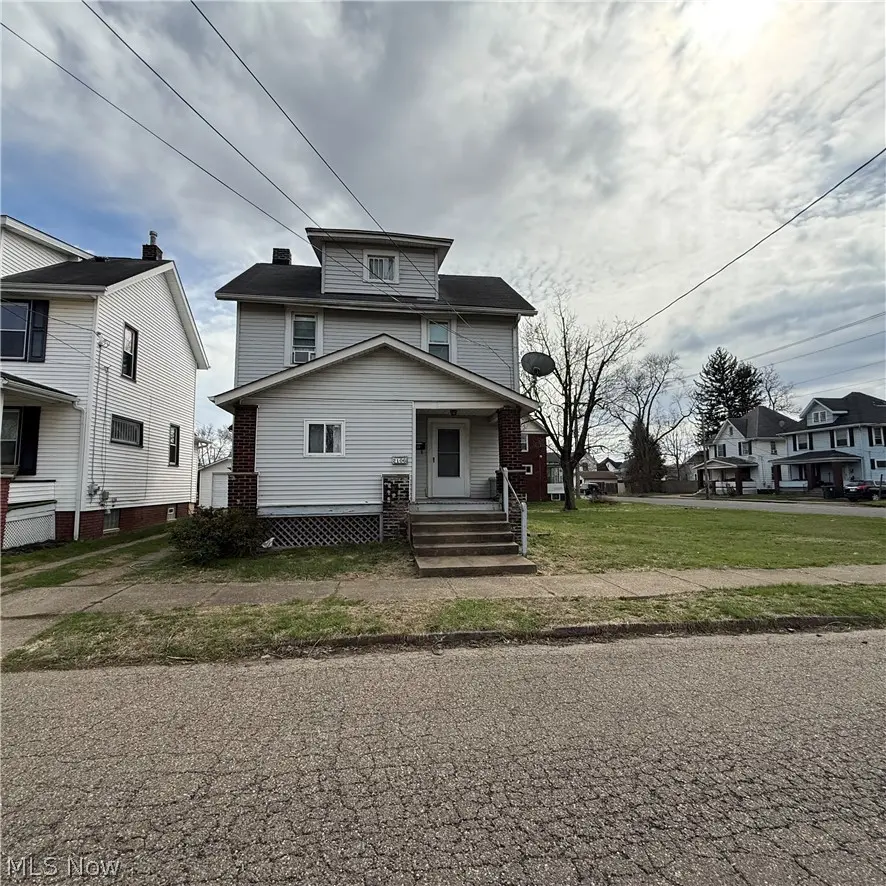
2106 Indiana Way NE · Canton, OH
Flood risk 4/10 · Minor
- FEMA flood zone
- X (unshaded)
- Chance of flooding over 30 yrs
- 0.23%
- Est. flood insurance / yr
- $473 – $860
Fire risk 1/10 · Minimal
- Est. fire insurance / yr
- $713 – $1,323
Heat risk 3/10 · Minor
- Hot days now (above 96°F)
- 7 days/yr
- Hot days in 30 yrs
- 17 days/yr
Wind risk 1/10 · Minimal
- Chance of severe wind over 30 yrs
- —
Air-quality risk 2/10 · Minimal
- Unhealthy air days now
- 1 days/yr
- Unhealthy air days in 30 yrs
- 2 days/yr
Risk factors via First Street. Map © Google.
Why this score? — see what drove the B grade
The composite is a weighted blend of 9 inputs, each scored 0–100. Each bar is that input's sub-score; the figure is the points it added to the 100-point composite (weight × sub-score).
- Cash flow +30.0/30.0
- 1% rule +10.0/10.0
- DSCR +10.0/10.0
- ARV discount +10.0/15.0
- Livability +3.6/5.0
- Condition / age +2.5/5.0
- Rent growth +2.4/5.0
- Schools +1.7/10.0
- Appreciation +0.0/10.0
$70,000
🖨 Deal sheet 📄 Offer letter ✓ Due diligence
Listing remarks MLS
Opportunity is knocking on this spacious corner lot! This solid home offers the perfect chance to build equity and make a home truly your own. Situated on a generous lot with great visibility and room to grow, the property features a functional layout just waiting for your personal touch. Whether you're an investor, flipper, or buyer looking to customize your next home, this property has endless potential. With the right vision and updates, this could be transformed into something special. Bring your ideas and unlock the possibilities!
Key facts
- Functional layout
- Endless potential
- Corner lot
Tags
Neighborhood map
What this means for you Summary
Snapshot
- This is a 3-bed/1.0-bath single-family listed at $70k.
Deal economics
- At list price, monthly cash flow is $401 ($5k/yr) — positive.
- The deal already cash-flows at list — no discount required.
- Meets the 1% rule at list price ($1k rent vs $70k).
- Recommended offer: $66k (6.0% below list) — sets the bar for market timing.
- Cap rate 13.2% vs local median 5.1% in Canton — top-decile yield for the area; either an underpriced asset or a hidden risk that comps aren't pricing in. Stress-test before assuming the spread holds.
Location & tenants
- Location reads 71/100 on livability (#441 in OH) — a middle-class / working-renter tenant base. Strengths: commute A+, cost of living A+, housing A; Watch: crime F, employment F.
- Canton City (urban): math 17% / reading 26% proficiency, ranked #627 of 656 in OH (top 96%) — low school quality limits family demand, transient renter base, plan for 1-2y turnover; 76% free/reduced lunch — lower-income household profile, screen leases tightly.
- Market conditions: Rents soft (-0.2%/yr); 71 active listings in the ZIP; 17 comparable units currently listed for rent nearby; rentals at typical pace (median 21d on market — plan ~3-4 weeks tenant-placement turnaround); lower-income renter base — watch delinquency; 528 units permitted in Stark County in 2024 (84 in 5+ unit buildings).
- This rent runs 30% of the median local income ($43k/yr) — at the standard rent-burdened threshold; future hikes will face affordability resistance.
Forward outlook
- Local home prices are declining (-3.0%/yr); year-one equity from $484 of loan paydown is wiped out by about $2k of value loss. Plan a longer hold.
- Stark County population projected to shrink 8% by 2050 — rents likely to lag national; underwrite the cash flow, not the appreciation.
- At projected returns (-3.0% appreciation + 0.0% rent growth), your $20k cash investment doubles in ~6 years — after that, you're playing with house money.
Negotiation context
- It's been on market 80 days — a 6% lower offer ($66k) is reasonable based on typical stale-listing flexibility.
- 2 sale attempts since 5y ago with the ask held roughly flat each time — persistent listings suggest the price (not the market) is what's stuck; bring a comps-based counter.
- Current owner paid $56k; 24% above their basis — modest negotiation headroom, anchor on the comps not their cost.
Risks & watch-outs
- Watch-outs: built in 1920 — expect roof / HVAC / electrical / plumbing capex.
Questions for the listing agent
- It's been on market 80 days. Have you received any prior offers? Is the seller open to a 6% concession, seller financing, or rate buy-down credit?
- Built in 1920 — when were the roof, HVAC, electrical panel, plumbing, and water heater last replaced?
- Why hasn't it sold? Are there any deal-killer items the seller is aware of (foundation, flood, title, zoning, code violations)?
- Is there a deadline driving the sale (1031 exchange, divorce, estate, relocation)? That informs how much negotiation room exists.
- Crime grade is F in this area — have there been break-ins, vandalism, or insurance claims at this property in the last 3 years? What carrier currently insures it and at what premium?
- What's the average days-on-market for RENTAL listings here right now (not sales)? A rising rental-DOM trend means longer vacancies and softer asking-rent achievability than the comps imply.
- What's the recent tenant-quality profile in this submarket — average credit score on applications, eviction rate, late-payment / NSF rate, and stable-employment percentage? A property-management company in the area should have these aggregated.
- How much new for-sale + rental construction is in the pipeline within 1–3 miles? Heavy new supply typically softens prices + rents 12–24 months out; constrained supply supports both.
Investment metrics
- 1% rule
- 1.57% ✓
- Cap rate
- 13.17%
- Cash-on-cash
- 24.56%
- DSCR
- 2.09
- GRM
- 5.3
CMA / ARV
- ARV (median comp)
- $74,173
- List price
- $70,000
- Delta
- -5.63%
- Verdict
- FAIR
- Comps
- 20 within 1.0 mi
Show comp detail 12 sales within ~0.75 mi
| Address | Dist | Beds/Ba | Sqft | Sold | Price | $/sf | Match |
|---|---|---|---|---|---|---|---|
| 2005 17th St NE | 0.12mi | 3/1.0 | 1,040 (-6%) | 1mo | $144,100 | $139 | 84 |
| 2212 Indiana Way NE | 0.04mi | 3/1.0 | 1,256 (+14%) | 1mo | $72,500 | $58 | 74 |
| 1311 18th St NE | 0.64mi | 3/1.0 | 1,100 (0%) | 1mo | $125,000 | $114 | 69 |
| 1209 17th St NE | 0.70mi | 3/1.0 | 1,080 (-2%) | 4mo | $119,000 | $110 | 61 |
| 1604 Wooster Ave NE | 0.68mi | 3/1.0 | 1,162 (+6%) | 2mo | $90,000 | $77 | 57 |
| 1624 May Pl NE | 0.40mi | 2/1.0 (-1) | 1,222 (+11%) | 3mo | $108,150 | $89 | 56 |
| 2028 Saint Elmo Ave NE | 0.63mi | 2/1.0 (-1) | 1,152 (+5%) | 4mo | $109,990 | $95 | 54 |
| 2656 22nd St NE | 0.69mi | 3/1.0 | 1,008 (-8%) | 1mo | $25,000 | $25 | 53 |
| 2735 19th St NE | 0.71mi | 3/1.0 | 1,008 (-8%) | 2mo | $84,000 | $83 | 52 |
| 1525 14th St NE | 0.54mi | 3/1.0 | 1,264 (+15%) | 2mo | $21,900 | $17 | 48 |
| 1529 23rd St NE | 0.69mi | 3/2.0 | 1,239 (+13%) | 1mo | $162,000 | $131 | 42 |
| 1316 19th St NE | 0.65mi | 3/1.0 | 1,264 (+15%) | 4mo | $110,000 | $87 | 41 |
Match score weights: distance 35% · size 25% · config 20% · recency 20%. Top-matched comps best support the ARV.
Projected returns pro-forma
-3.0% appreciation · 0.0% rent growth · sell at horizon
- IRR
- 14.5%
- Equity multiple
- 1.56×
- Total profit
- $10,980
- Equity at exit
- $10,437
- IRR
- 20.9%
- Equity multiple
- 2.53×
- Total profit
- $30,003
- Equity at exit
- $6,052
Cash invested: $19,600 (down + closing). Projections, not guarantees.
Landlord ↔ Tenant lean methodology
- Overall (STATE)
- 73 Landlord-Friendly
- State Ohio
- 73 Landlord-Friendly · R+6
- County
- — inherits STATE
- City
- — inherits STATE
ZIP-level market 44705
- Rents YoY
- -0.2%
- Active inventory
- 71
- Price-to-rent
- 5.3×
Monthly cashflow live
- Estimated rent
- $1,102 high interval (Pro) →
- Mortgage (P&I)
- −$367
- Tax from tax record
- −$73 /mo · $881/yr
- Insurance
- −$29
- HOA
- −$0
- Vacancy / Maint / Mgmt
- −$231
- Net cashflow
- $401
Break-even live
UW: 25.0% down · 7.5% · 30yr · 1.5% tax · 5.0% vac · 8.0% maint · 8.0% mgmt
Financing live
Cash to close
- Down payment
- $17,500
- Closing costs
- $2,100
- Reserves months
- —
- Total cash needed
- —
Loan-product check · same deal, 3 products live
Conventional
25% down · 7.5% · 30yr
- Down + closing
- —
- Monthly P&I
- —
- Monthly cashflow
- —
- DSCR
- —
- Eligible?
- —
Personal DTI + credit; lowest rate.
DSCR
20% down · 8.5% · 30yr
- Down + closing
- —
- Monthly P&I
- —
- Monthly cashflow
- —
- DSCR
- —
- Eligible?
- —
No personal income docs; deal must DSCR.
Hard money
10% down · 12.0% · 12mo
- Down + closing
- —
- Monthly P&I
- —
- Monthly cashflow
- —
- DSCR
- —
- Eligible?
- —
Short-term bridge; refi at stabilization.
Rent comps 17 comps
| Address | Beds | Baths | Sqft | Rent | $/sqft | DOM | Units | Dist |
|---|---|---|---|---|---|---|---|---|
| 2213 17th St NE Canton, OH | 2.0 | 1.0 | 1132 | $1,100 | $0.97 | 44d | 1 | 0.12mi |
| 2018 Maple Ave NE Canton, OH | 2.0 | 1.0 | 1206 | $950 | $0.79 | 13d | 1 | 0.45mi |
| 1524 Parkhill Pl NE Canton, OH | 3.0 | 1.0 | 856 | $995 | $1.16 | 43d | 1 | 0.52mi |
| 1206 Lawrence Rd NE Apt 3 Canton, OH | 2.0 | 1.0 | 900 | $950 | $1.06 | 20d | 1 | 0.92mi |
| 1613 Spring Ave NE Canton, OH | 3.0 | 1.0 | 1320 | $1,095 | $0.83 | 20d | 1 | 0.95mi |
| 1629 Spring Ave NE Unit Na Canton, OH | 2.0 | 1.0 | 1100 | $836 | $0.76 | 20d | 1 | 0.95mi |
| 2103 Willowrow Ave NE Canton, OH | 3.0 | 1.0 | 850 | $1,000 | $1.18 | 13d | 1 | 0.96mi |
| 2321 Harmont Ave NE Canton, OH | 2.0 | 1.0 | 800 | $1,200 | $1.50 | 13d | 1 | 1.13mi |
| 1906 6th St NE Unit 1906-002 Canton, OH | 3.0 | 1.0 | 906 | $1,000 | $1.10 | 13d | 1 | 1.18mi |
| 924 Spring Ave NE Canton, OH | 4.0 | 1.5 | 1407 | $1,395 | $0.99 | 20d | 1 | 1.18mi |
| 123 17th St NW Canton, OH | 2.0 | 1.0–1.5 | 766 | $1,050 | $1.37 | 13d | 1 | 1.18mi |
| 1220 Market Ave N Unit 4 Canton, OH | 3.0 | 1.0 | 1400 | $1,100 | $0.79 | 43d | 1 | 1.28mi |
| 1946 Otto Pl NE Canton, OH | 3.0 | 1.0 | 1499 | $28,000 | $18.68 | 13d | 1 | 1.30mi |
| 316 Young Ave NE Canton, OH | 4.0 | 1.0 | 1268 | $1,050 | $0.83 | 13d | 1 | 1.37mi |
| 1511 2nd St NE Canton, OH | 3.0 | 1.0 | 1129 | $1,250 | $1.11 | 43d | 1 | 1.43mi |
| 2048 2nd St NE Unit 2048 Canton, OH | 2.0 | 1.0 | 1092 | $950 | $0.87 | 13d | 1 | 1.46mi |
| 1307 Woodland Ave NW Unit 2 Canton, OH | 2.0 | 1.0 | 973 | $675 | $0.69 | 43d | 1 | 1.48mi |
Listing history 23 events
-
2026-06-18days on market $70,000 Active 80 DOM
-
2026-06-17days on market $70,000 Active 79 DOM
-
2026-06-16days on market $70,000 Active 78 DOM
-
2026-06-15days on market $70,000 Active 77 DOM
-
2026-06-14days on market $70,000 Active 75 DOM
-
2026-06-13days on market $70,000 Active 74 DOM
-
2026-06-10days on market $70,000 Active 72 DOM
-
2026-06-09days on market $70,000 Active 71 DOM
-
2026-06-08days on market $70,000 Active 70 DOM
-
2026-06-07days on market $70,000 Active 69 DOM
-
2026-06-05days on market $70,000 Active 66 DOM
-
2026-06-03days on market $70,000 Active 65 DOM
-
2026-06-02days on market $70,000 Active 64 DOM
-
2026-06-01days on market $70,000 Active 63 DOM
-
2026-05-31days on market $70,000 Active 62 DOM
-
2026-05-30days on market $70,000 Active 61 DOM
-
2026-03-30$70,000 Active 541-char remark
Show marketing remark (541 chars)
Opportunity is knocking on this spacious corner lot! This solid home offers the perfect chance to build equity and make a home truly your own. Situated on a generous lot with great visibility and room to grow, the property features a functional layout just waiting for your personal touch. Whether you're an investor, flipper, or buyer looking to customize your next home, this property has endless potential. With the right vision and updates, this could be transformed into something special. Bring your ideas and unlock the possibilities!
-
2025-03-07soldstatus $56,500
-
2022-02-27historical
-
2021-12-03price $62,500
-
2021-08-27$64,900 Active
-
2004-05-03soldstatus $56,300
-
2002-12-30soldstatus $65,000
ⓘ Source: listings_history table (triggers on properties + properties_extension) + one-shot
backfill from property_details.listing_events for pre-trigger history.
Tax reassessment forecast OH · Partial reset (capped growth)
- Current annual tax
- $881 · $73/mo
- Projected year-2 tax
- $987 · $82/mo
- Expected delta
- +$105/yr (+$9/mo · 12.0%)
ⓘ Screening estimate from a state-policy table — verify with the county assessor before closing.
Climate risk First Street
- Flood 4/10 Moderate FEMA zone X (unshaded) · 23% chance over 30 yrs
- Wildfire 1/10 Low
- Heat 3/10 Moderate 7 d/yr ≥96°F today · 17 d/yr by 30 yrs out
- Wind 1/10 Low
- Air quality 2/10 Low 1 unhealthy d/yr today · 2 by 30 yrs out
Nearby sold comps map
Loading sold comps map…
Walkable amenities ~0.75 mi
Loading nearby amenities…
Taxation est. · year 1
- Rental income
- $13,227
- − Mortgage interest
- −$3,921
- − Property taxes
- −$881
- − Insurance
- −$350
- − Repairs & maintenance
- −$1,058
- − Management
- −$1,058
- − Depreciation
- −$2,036
- Taxable income
- $3,922
- Est. tax owed @ 24.0%
- −$941
- After-tax cash flow
- $3,872/yr
For passive investors: Depreciation is non-cash, so a rental often shows a tax loss while cash-flowing — sheltering income. Rental losses are passive: they offset passive income freely, and up to $25,000/yr can offset ordinary (W-2) income if you actively participate and your MAGI is under $100k (phasing out to $0 by $150k); unused losses carry forward. On sale, claimed depreciation is recaptured at up to 25%, and gains may owe capital-gains tax (a 1031 exchange can defer both). Figures are a year-1 estimate at your 24.0% rate — not tax advice; consult a CPA.
Schools (NCES district)
- District
- Canton City
- NCES district ID
- 3904371
- Math proficiency
- 17% ▼ -17.00%
- Reading proficiency
- 26% ▼ -12.00%
- Median HH income
- $28,825
- Composite
- 17.1/100
- National rank
- #9116
- State rank
- #627 of 656 in OH
Livability — Canton
- Score
- 71/100
- State rank
- #441
- US rank
- #7259
Category grades
Schools grade is shown separately in the Schools card above.
Census & demographics
- Census place
- Canton, OH
- County
- Stark County · 272,865 people
- City population
- 103,614
- Metro
- Canton-Massillon, OH
- Population (ZIP)
- 16,872
- Household income
- $43,439
- Rent vs Own
- Severe rent burden
- 524.0
Population outlook (Stark County) Hauer SSP2
- Today (2025)
- 373,708 people
- By 2030
- 371,245 · -0.7%
- By 2040
- 361,331 · -3.3%
- By 2050
- 345,290 · -7.6%
- By 2075
- 302,669 · -19.0%
- By 2100
- 238,870 · -36.1%
Race, ethnicity, and origin ACS 2023
- Neighborhood character
- Diverse neighborhood (Simpson 0.60)
- Race & ethnicity
- White 58% Black 22% Two or more races 13% Hispanic / Latino 9%
- Hispanic origin (detail)
- Mexican 2% Puerto Rican 2%
- Common ancestry
- Italian 5% Romanian 4% Lithuanian 2%
- Foreign-born
- 3% · Canada
- Languages at home
- 97% English-only · Spanish 2% German/W. Germanic 1%
Political lean MEDSL · Stark
- 2024 margin
- Strong R (+21.9) · D 38.6% · R 60.5%
- 2008→2024 swing
- -27.4pp toward R · 2008: 5.5pp · 2024: -21.9pp
- All cycles
- 2024: R+21.9 2020: R+18.5 2016: R+17.4 2012: R+0.4 2008: D+5.5
Not yet ingested
- Civics
- —
Market trends
- HPI YoY
- ▼ -200.62%
- Current HPI
- 150.1531
- Rent YoY
- ▼ -0.23%
- Metro
- Canton-Massillon, OH
- State GDP YoY
- ▲ 1.98%
- F500 in state
- 48
Industry mix (Fortune 500 HQ in OH)
| Industry | F500 HQs | Revenue |
|---|---|---|
| Insurance | 3 | $145B |
|
||
| Industrial Machinery | 3 | $49B |
|
||
| Financial Services | 3 | $24B |
|
||
| Consumer Goods | 2 | $93B |
|
||
| Aerospace / Defense | 2 | $47B |
|
||
| Utilities | 2 | $33B |
|
||
Price history
+7.7% since first listed7 events — show timeline
- 2026-03-30 Listed $70,000 MLSNOW
- 2025-03-07 Sold (Public Records) $56,500 Public Records
- 2022-02-27 Listing Removed — MLSNOW
- 2021-12-03 Price Changed $62,500 MLSNOW
- 2021-08-27 Listed $64,900 MLSNOW
- 2004-05-03 Sold (Public Records) $56,300 Public Records
- 2002-12-30 Sold (Public Records) $65,000 Public Records
Property tax history
+2.3%/yrLatest (2024): $881 · +11.1% YoY. Source: county tax records.
Cash-flow waterfall
monthlySold comps — $/sqft
last 12 mo · ≤1 miLoading sold comps…