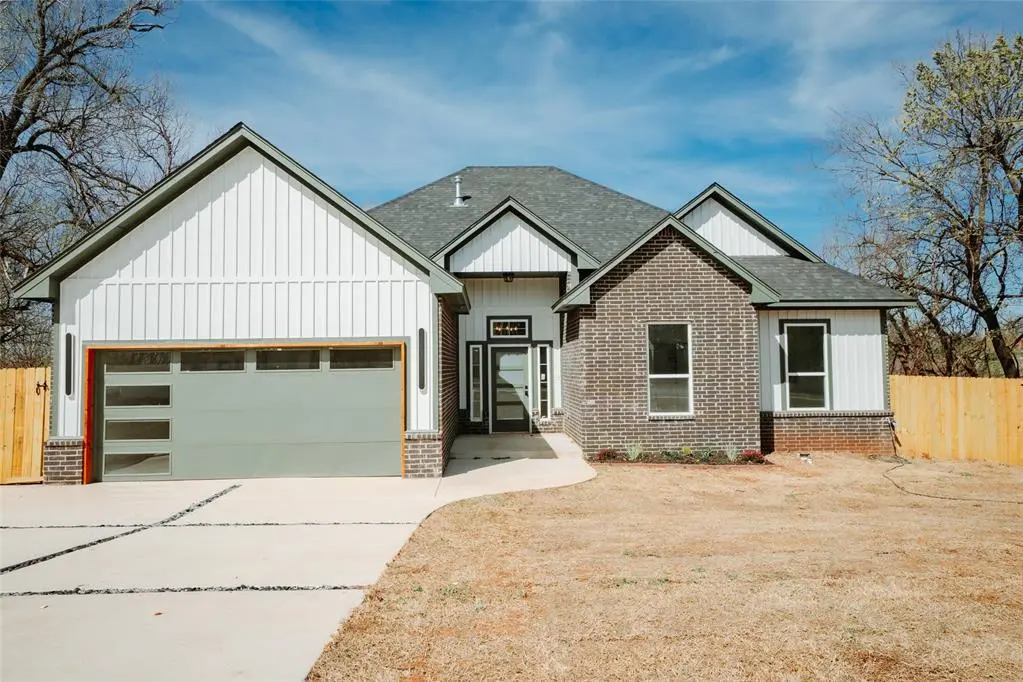
1101 SW 23rd St · Oklahoma City, OK
Flood risk 4/10 · Minor
- FEMA flood zone
- X (shaded)
- Chance of flooding over 30 yrs
- 0.22%
- Est. flood insurance / yr
- $507 – $1,088
Fire risk 1/10 · Minimal
- Est. fire insurance / yr
- $2,463 – $4,575
Heat risk 6/10 · Moderate
- Hot days now (above 107°F)
- 7 days/yr
- Hot days in 30 yrs
- 19 days/yr
Wind risk 2/10 · Minimal
- Chance of severe wind over 30 yrs
- 4.0%
Air-quality risk 1/10 · Minimal
- Unhealthy air days now
- 0 days/yr
- Unhealthy air days in 30 yrs
- 0 days/yr
Risk factors via First Street. Map © Google.
Why this score? — see what drove the D- grade
The composite is a weighted blend of 9 inputs, each scored 0–100. Each bar is that input's sub-score; the figure is the points it added to the 100-point composite (weight × sub-score).
- ARV discount +15.0/15.0
- Appreciation +10.0/10.0
- Livability +4.0/5.0
- Rent growth +3.6/5.0
- Cash flow +3.2/30.0
- Condition / age +2.5/5.0
- Schools +0.7/10.0
- 1% rule +0.0/10.0
- DSCR +0.0/10.0
$325,000
🖨 Deal sheet 📄 Offer letter ✓ Due diligence
Listing remarks MLS
Beautiful new construction offering modern living space on a spacious lot in Oklahoma City. Features include an open layout, luxury tile flooring throughout, modern fireplace, and a designer kitchen with custom cabinetry, quartz countertops, and a large island. The primary suite offers a double vanity with LED mirrors and sleek finishes. Enjoy a fully fenced backyard . This home is conveniently located near highways ,shopping fine dining, downtown and wheeler district !
Key facts
- Luxury tile flooring
- Custom cabinetry
- Designer kitchen
Tags
Neighborhood map
What this means for you Summary
Snapshot
- This is a 4-bed/2.0-bath single-family listed at $325k.
Deal economics
- At list price, monthly cash flow is $-1k ($-12k/yr) — negative.
- To cash-flow at today's rent, offer at most $143k (55.9% below list).
- To meet the 1% rule (rent ≥ 1% of price), the offer needs to be $125k (61.6% below list).
- Recommended offer: $125k (61.6% below list) — sets the bar for 1% rule.
- Cap rate 2.5% vs local median 3.7% in Oklahoma City — below-typical yield; the buyer is paying a premium for something (appreciation thesis, condition, location) that the cap rate doesn't capture.
Location & tenants
- Location reads 80/100 on livability (#3 in OK, #1,635 nationally) — a professional / high-income tenant draw. Strengths: amenities A+, commute A+, cost of living A+; Watch: schools F, crime F.
- Oklahoma City (urban): math 7% / reading 10% proficiency, ranked #254 of 270 in OK (top 94%) — low school quality limits family demand, transient renter base, plan for 1-2y turnover; 82% free/reduced lunch — lower-income household profile, screen leases tightly.
- Market conditions: Rents rising fast (+4.5%/yr); 83 active listings in the ZIP; 5 comparable units currently listed for rent nearby; rentals at typical pace (median 24d on market — plan ~3-4 weeks tenant-placement turnaround); lower-income renter base — watch delinquency; 5,365 units permitted in Oklahoma County in 2024 (569 in 5+ unit buildings).
- This rent runs 35% of the median local income ($43k/yr) — at the standard rent-burdened threshold; future hikes will face affordability resistance.
Forward outlook
- In year one you build about $35k of equity ($2k loan paydown + $32k appreciation (10.0% local appreciation)).
- Oklahoma County population projected at +41% by 2050 — long-run rental-demand tailwind backs the buy-and-hold thesis.
- By year 2, paydown + projected appreciation supports a ~$56k cash-out refi (75% LTV) — recoverable capital for the next deal without selling this one.
Negotiation context
- It's been on market 67 days — a 6% lower offer ($306k) is reasonable based on typical stale-listing flexibility.
- Current owner paid $186k; list at $325k implies a 75% gain — meaningful room to come down on a strong offer.
Risks & watch-outs
- Climate carrying-cost: extreme-heat days projected 7→19/yr by 2055 (HVAC capex compounding) — expect insurance premiums to compound above CPI over the hold.
Questions for the listing agent
- What do current leases actually rent for vs. the listed asking? Can we see a recent rent roll and the last 12 months of T-12 income?
- It's been on market 67 days. Have you received any prior offers? Is the seller open to a 62% concession, seller financing, or rate buy-down credit?
- Why hasn't it sold? Are there any deal-killer items the seller is aware of (foundation, flood, title, zoning, code violations)?
- Is there a deadline driving the sale (1031 exchange, divorce, estate, relocation)? That informs how much negotiation room exists.
- Schools are F-rated, which usually means shorter tenancies and higher turnover. Who's the typical renter profile here, and what's been the actual vacancy rate?
- Crime grade is F in this area — have there been break-ins, vandalism, or insurance claims at this property in the last 3 years? What carrier currently insures it and at what premium?
- The area grade is low — what's the realistic commute time and amenity access for the typical tenant pool here? Any planned neighborhood developments (good or bad) we should know about?
- What's the average days-on-market for RENTAL listings here right now (not sales)? A rising rental-DOM trend means longer vacancies and softer asking-rent achievability than the comps imply.
- What's the recent tenant-quality profile in this submarket — average credit score on applications, eviction rate, late-payment / NSF rate, and stable-employment percentage? A property-management company in the area should have these aggregated.
- How much new for-sale + rental construction is in the pipeline within 1–3 miles? Heavy new supply typically softens prices + rents 12–24 months out; constrained supply supports both.
Investment metrics
- 1% rule
- 0.38% ✗
- Cap rate
- 2.50%
- Cash-on-cash
- -13.56%
- DSCR
- 0.40
- GRM
- 21.7
CMA / ARV
- ARV (median comp)
- $534,294
- List price
- $325,000
- Delta
- -39.17%
- Verdict
- UNDERPRICED
- Comps
- 20 within 1.0 mi
Show comp detail 12 sales within ~0.75 mi
| Address | Dist | Beds/Ba | Sqft | Sold | Price | $/sf | Match |
|---|---|---|---|---|---|---|---|
| 1817 Runway Blvd | 0.37mi | 3/2.5 (-1) | 1,413 (-5%) | 8mo | $367,000 | $260 | 60 |
| 1232 SW 17th St | 0.45mi | 3/2.0 (-1) | 1,376 (-8%) | 2mo | $187,000 | $136 | 60 |
| 1743 Oso Ave | 0.36mi | 3/2.5 (-1) | 1,331 (-11%) | 1mo | $415,000 | $312 | 57 |
| 1636 S Douglas Ave | 0.55mi | 3/2.5 (-1) | 1,583 (+6%) | 0mo | $475,000 | $300 | 56 |
| 1640 S Douglas Ave | 0.50mi | 3/2.5 (-1) | 1,583 (+6%) | 3mo | $475,000 | $300 | 56 |
| 1044 SW 26th St | 0.25mi | 3/1.0 (-1) | 1,679 (+13%) | 4mo | $66,000 | $39 | 54 |
| 605 SW 26th St | 0.65mi | 3/1.0 (-1) | 1,532 (+3%) | 6mo | $125,000 | $82 | 51 |
| 1141 SW Binkley St | 0.64mi | 3/1.0 (-1) | 1,450 (-3%) | 7mo | $160,000 | $110 | 51 |
| 1700 SW 18th St | 0.63mi | 3/2.0 (-1) | 1,334 (-10%) | 2mo | $152,000 | $114 | 47 |
| 1536 SW 28th St | 0.71mi | 3/2.0 (-1) | 1,360 (-9%) | 2mo | $234,000 | $172 | 46 |
| 1628 S Douglas Ave | 0.55mi | 3/2.5 (-1) | 1,670 (+12%) | 6mo | $485,000 | $290 | 42 |
| 1033 SW Binkley St | 0.63mi | 3/1.0 (-1) | 1,342 (-10%) | 6mo | $190,000 | $142 | 41 |
Match score weights: distance 35% · size 25% · config 20% · recency 20%. Top-matched comps best support the ARV.
Projected returns pro-forma
10.0% appreciation · 4.51% rent growth · sell at horizon
- IRR
- 15.1%
- Equity multiple
- 2.25×
- Total profit
- $113,314
- Equity at exit
- $292,786
- IRR
- 14.9%
- Equity multiple
- 5.28×
- Total profit
- $389,105
- Equity at exit
- $631,404
Cash invested: $91,000 (down + closing). Projections, not guarantees.
Landlord ↔ Tenant lean methodology
- Overall (STATE)
- 83 Strongly Landlord-Friendly
- State Oklahoma
- 83 Strongly Landlord-Friendly · R+20
- County
- — inherits STATE
- City
- — inherits STATE
ZIP-level market 73109
- Home prices YoY
- 9.5%
- Rents YoY
- 4.5%
- Active inventory
- 83
- Price-to-rent
- 21.7×
Monthly cashflow live
- Estimated rent
- $1,249 high interval (Pro) →
- Mortgage (P&I)
- −$1,704
- Tax from tax record
- −$175 /mo · $2,101/yr
- Insurance
- −$135
- HOA
- −$0
- Vacancy / Maint / Mgmt
- −$262
- Net cashflow
- $-1,028
Break-even live
UW: 25.0% down · 7.5% · 30yr · 1.5% tax · 5.0% vac · 8.0% maint · 8.0% mgmt
Financing live
Cash to close
- Down payment
- $81,250
- Closing costs
- $9,750
- Reserves months
- —
- Total cash needed
- —
Loan-product check · same deal, 3 products live
Conventional
25% down · 7.5% · 30yr
- Down + closing
- —
- Monthly P&I
- —
- Monthly cashflow
- —
- DSCR
- —
- Eligible?
- —
Personal DTI + credit; lowest rate.
DSCR
20% down · 8.5% · 30yr
- Down + closing
- —
- Monthly P&I
- —
- Monthly cashflow
- —
- DSCR
- —
- Eligible?
- —
No personal income docs; deal must DSCR.
Hard money
10% down · 12.0% · 12mo
- Down + closing
- —
- Monthly P&I
- —
- Monthly cashflow
- —
- DSCR
- —
- Eligible?
- —
Short-term bridge; refi at stabilization.
Rent comps 5 comps
| Address | Beds | Baths | Sqft | Rent | $/sqft | DOM | Units | Dist |
|---|---|---|---|---|---|---|---|---|
| 1345 SW 27th St Oklahoma City, OK | 3.0 | 2.0 | 1153 | $1,095 | $0.95 | 2d | 1 | 0.46mi |
| 1416 S Daugherty Ave Oklahoma City, OK | 3.0 | 1.0 | 1164 | $1,120 | $0.96 | 12d | 1 | 0.89mi |
| 1616 Linden St Oklahoma City, OK | 3.0 | 1.5 | 1175 | $975 | $0.83 | 24d | 1 | 0.93mi |
| 2140 SW 35th St Oklahoma City, OK | 3.0 | 2.0 | 976 | $1,300 | $1.33 | 44d | 1 | 1.23mi |
| 1132 SW 40th St Oklahoma City, OK | 3.0 | 2.0 | 1436 | $1,350 | $0.94 | 24d | 1 | 1.26mi |
Listing history 10 events
-
2026-06-18days on market $325,000 Active 67 DOM
-
2026-06-18days on market $325,000 Active 66 DOM
-
2026-05-14price $325,000 474-char remark
Show marketing remark (474 chars)
Beautiful new construction offering modern living space on a spacious lot in Oklahoma City. Features include an open layout, luxury tile flooring throughout, modern fireplace, and a designer kitchen with custom cabinetry, quartz countertops, and a large island. The primary suite offers a double vanity with LED mirrors and sleek finishes. Enjoy a fully fenced backyard . This home is conveniently located near highways ,shopping fine dining, downtown and wheeler district !
-
2026-04-23price $330,000 474-char remark
Show marketing remark (474 chars)
Beautiful new construction offering modern living space on a spacious lot in Oklahoma City. Features include an open layout, luxury tile flooring throughout, modern fireplace, and a designer kitchen with custom cabinetry, quartz countertops, and a large island. The primary suite offers a double vanity with LED mirrors and sleek finishes. Enjoy a fully fenced backyard . This home is conveniently located near highways ,shopping fine dining, downtown and wheeler district !
-
2026-03-30price $345,000 474-char remark
Show marketing remark (474 chars)
Beautiful new construction offering modern living space on a spacious lot in Oklahoma City. Features include an open layout, luxury tile flooring throughout, modern fireplace, and a designer kitchen with custom cabinetry, quartz countertops, and a large island. The primary suite offers a double vanity with LED mirrors and sleek finishes. Enjoy a fully fenced backyard . This home is conveniently located near highways ,shopping fine dining, downtown and wheeler district !
-
2026-03-19$350,000 Active 474-char remark
Show marketing remark (474 chars)
Beautiful new construction offering modern living space on a spacious lot in Oklahoma City. Features include an open layout, luxury tile flooring throughout, modern fireplace, and a designer kitchen with custom cabinetry, quartz countertops, and a large island. The primary suite offers a double vanity with LED mirrors and sleek finishes. Enjoy a fully fenced backyard . This home is conveniently located near highways ,shopping fine dining, downtown and wheeler district !
-
2025-01-21soldstatus $186,000
-
2007-06-04soldstatus $118,000
-
2004-05-17soldstatus $105,000
-
2000-12-15soldstatus $91,000
ⓘ Source: listings_history table (triggers on properties + properties_extension) + one-shot
backfill from property_details.listing_events for pre-trigger history.
Tax reassessment forecast OK · Resets to sale price
- Current annual tax
- $2,101 · $175/mo
- Projected year-2 tax
- $2,925 · $244/mo
- Expected delta
- +$824/yr (+$69/mo · 39.2%)
ⓘ Screening estimate from a state-policy table — verify with the county assessor before closing.
Climate risk First Street
- Flood 4/10 Moderate FEMA zone X (shaded) · 22% chance over 30 yrs
- Wildfire 1/10 Low
- Heat 6/10 Major 7 d/yr ≥107°F today · 19 d/yr by 30 yrs out
- Wind 2/10 Low 4% chance of damaging wind over 30 yrs
- Air quality 1/10 Low 0 unhealthy d/yr today · 0 by 30 yrs out
Nearby sold comps map
Loading sold comps map…
Walkable amenities ~0.75 mi
Loading nearby amenities…
Taxation est. · year 1
- Rental income
- $14,986
- − Mortgage interest
- −$18,205
- − Property taxes
- −$2,101
- − Insurance
- −$1,625
- − Repairs & maintenance
- −$1,199
- − Management
- −$1,199
- − Depreciation
- −$9,455
- Taxable loss
- −$18,798
- Est. tax savings @ 24.0%
- +$4,511
- After-tax cash flow
- $-7,828/yr
For passive investors: Depreciation is non-cash, so a rental often shows a tax loss while cash-flowing — sheltering income. Rental losses are passive: they offset passive income freely, and up to $25,000/yr can offset ordinary (W-2) income if you actively participate and your MAGI is under $100k (phasing out to $0 by $150k); unused losses carry forward. On sale, claimed depreciation is recaptured at up to 25%, and gains may owe capital-gains tax (a 1031 exchange can defer both). Figures are a year-1 estimate at your 24.0% rate — not tax advice; consult a CPA.
Schools (NCES district)
- District
- Oklahoma City
- NCES district ID
- 4022770
- Math proficiency
- 7% ▼ -5.00%
- Reading proficiency
- 10% ▼ -6.00%
- Median HH income
- $35,606
- Composite
- 7.0/100
- National rank
- #9970
- State rank
- #254 of 270 in OK
Livability — Oklahoma City
- Score
- 80/100
- State rank
- #3
- US rank
- #1635
Category grades
Schools grade is shown separately in the Schools card above.
Census & demographics
- Census place
- Oklahoma City, OK
- County
- Oklahoma County · 771,644 people
- City population
- 498,656
- Metro
- Oklahoma City, OK
- Population (ZIP)
- 21,378
- Household income
- $43,133
- Rent vs Own
- Severe rent burden
- 1473.0
Population outlook (Oklahoma County) Hauer SSP2
- Today (2025)
- 911,875 people
- By 2030
- 982,413 · +7.7%
- By 2040
- 1,130,468 · +24.0%
- By 2050
- 1,288,422 · +41.3%
- By 2075
- 1,711,482 · +87.7%
- By 2100
- 2,088,448 · +129.0%
Race, ethnicity, and origin ACS 2023
- Neighborhood character
- Diverse neighborhood (Simpson 0.55)
- Race & ethnicity
- Hispanic / Latino 62% Two or more races 24% White 23% Black 9% Native American 5%
- Hispanic origin (detail)
- Mexican 58%
- Common ancestry
- Italian 1% Hispanic 1% Scottish 1%
- Foreign-born
- 26% · Canada
- Languages at home
- 49% English-only · Spanish 50% Other Asian/Pacific 0%
Political lean MEDSL · Oklahoma
- 2024 margin
- Toss-up / Even · D 48.0% · R 49.7% · Other 2.3%
- 2008→2024 swing
- +15.1pp toward D · 2008: -16.8pp · 2024: -1.7pp
- All cycles
- 2024: R+1.7 2020: R+1.1 2016: R+10.5 2012: R+16.7 2008: R+16.8
Not yet ingested
- Civics
- —
Market trends
- HPI YoY
- ▲ 23.48%
- Current HPI
- 270.5333
- Rent YoY
- ▲ 4.51%
- Metro
- Oklahoma City, OK
- State GDP YoY
- ▲ 1.55%
- F500 in state
- 6
Industry mix (Fortune 500 HQ in OK)
| Industry | F500 HQs | Revenue |
|---|---|---|
| Energy | 3 | $48B |
|
||
Price history
+257.1% since first listed8 events — show timeline
- 2026-05-14 Price Changed $325,000 MLSOK
- 2026-04-23 Price Changed $330,000 MLSOK
- 2026-03-30 Price Changed $345,000 MLSOK
- 2026-03-19 Listed $350,000 MLSOK
- 2025-01-21 Sold (Public Records) $186,000 Public Records
- 2007-06-04 Sold (Public Records) $118,000 Public Records
- 2004-05-17 Sold (Public Records) $105,000 Public Records
- 2000-12-15 Sold (Public Records) $91,000 Public Records
Property tax history
+3.0%/yrLatest (2024): $2,101 · +4.4% YoY. Source: county tax records.
Cash-flow waterfall
monthlySold comps — $/sqft
last 12 mo · ≤1 miLoading sold comps…