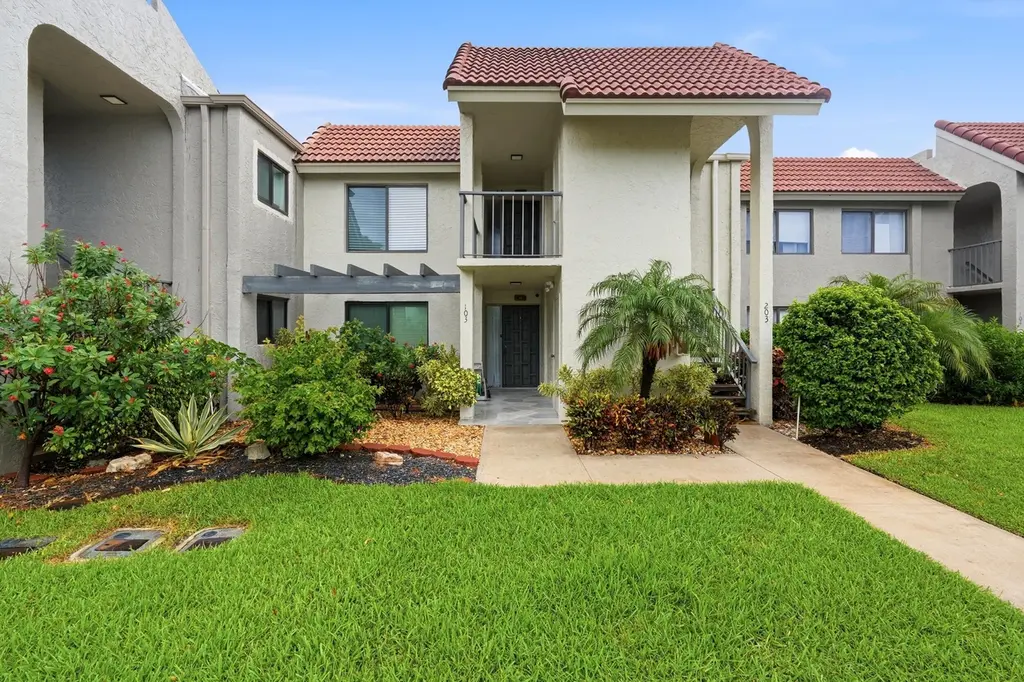
5500 Fairway Park Dr #103 · Golf, FL
Flood risk 1/10 · Minimal
- FEMA flood zone
- X (unshaded)
- Chance of flooding over 30 yrs
- 0.0%
- Est. flood insurance / yr
- $507 – $1,088
Fire risk 1/10 · Minimal
- Est. fire insurance / yr
- $947 – $1,759
Heat risk 9/10 · Severe
- Hot days now (above 106°F)
- 7 days/yr
- Hot days in 30 yrs
- 26 days/yr
Wind risk 10/10 · Severe
- Chance of severe wind over 30 yrs
- 99.0%
Air-quality risk 2/10 · Minimal
- Unhealthy air days now
- 1 days/yr
- Unhealthy air days in 30 yrs
- 2 days/yr
Risk factors via First Street. Map © Google.
Why this score? — see what drove the D grade
The composite is a weighted blend of 9 inputs, each scored 0–100. Each bar is that input's sub-score; the figure is the points it added to the 100-point composite (weight × sub-score).
- Cash flow +9.6/30.0
- ARV discount +7.5/15.0
- 1% rule +5.4/10.0
- Appreciation +4.9/10.0
- Schools +4.3/10.0
- Livability +3.2/5.0
- Rent growth +2.8/5.0
- DSCR +2.7/10.0
- Condition / age +2.5/5.0
$265,000
🖨 Deal sheet (PDF) 📄 Offer letter ✓ Due diligence
Listing remarks MLS
PRISTINE FIRST FLOOR 2BR/2BA CONDO IN 55+ COMMUNITY WITH LOVELY GARDEN VIEW. LARGE SCREENED AND TILED PATIO WITH EASTERN EXPOSURE PERFECT TO ENJOY FLORIDA EVENINGS. KITCHEN WITH PLENTY OF COUNTER SPACE AND SPACIOUS BRIGHT BREAKFAST NOOK. FORMAL DINING OPEN TO FAMILY ROOM AND GARDEN VIEW. SPACIOUS MASTER WITH WALK IN CLOSET AND ACCESS TO PATIO. WALK TO POOL AND CLUBHOUSE WHERE SOCIAL ACTIVITIES TAKE PLACE. GOLF MEMBERSHIP AVAILABLE BUT NOT MANDATORY. INDIAN SPRINGS IS CLOSE TO SHOPPING, RESTAURANTS, THE TURNPIKE AND I95 AND MINUTES FROM THE BEACHES. MOVE IN READY NOT TO BE MISSED!
Key facts
- View of garden area
- Impact windows
- $699 HOA
Tags
Property features AI
Finance
- Other: Pets not allowed
- HOA & community: Community with HOA; Monthly HOA fee (reported); Community amenities include clubhouse, golf course, pool, spa/hot tub, storage, and tennis courts; HOA fees cover cable TV, insurance, grounds maintenance, security, trash, and common areas; Senior community
Exterior
- Parking: 2 parking spaces; Concrete parking surface
- Utilities: Public water; Public sewer; Electricity available; Cable available
- Home design: Condominium; One-story; Updated / remodeled; Accessible features with grip-accessible elements; Faces west
- Construction: Built with CBS construction; Spanish tile roof
- Exterior features: Storage structure on property; Not waterfront
Interior
- Kitchen: Disposal; Dishwasher; Electric range; Microwave; Refrigerator; Freezer
- Bedrooms: 2 bedrooms on the main level
- Flooring: Laminate; Tile
- Bathrooms: 2 full bathrooms
- Heating & cooling: Central heating; Central air conditioning
- Interior features: Walk-in closets; Split bedroom layout; Roman tub
- Laundry & utility: In-unit laundry
Neighborhood map
What this means for you Summary
Snapshot
- This is a 2-bed/2.0-bath condo listed at $265k.
Deal economics
- At list price, monthly cash flow is $-180 ($-2k/yr) — negative.
- To cash-flow at today's rent, offer at most $233k (12.0% below list).
- Meets the 1% rule at list price ($3k rent vs $265k).
- Recommended offer: $233k (12.0% below list) — sets the bar for cash-flow.
Location & tenants
- Location reads 63/100 on livability (#703 in FL) — a middle-class / working-renter tenant base. Strengths: crime A+, employment A+, housing A+; Watch: amenities F, commute F, cost of living F.
- Palm Beach (suburban): math 46% / reading 53% proficiency, ranked #34 of 73 in FL (top 47%) — families likely to look elsewhere, expect single-tenant / working-renter base with shorter leases.
- Zoned schools: Hagen Road Elementary School (math 55% / reading 63%, grade B-, #722 of 2,144 statewide, top 34%, 773 students, 46% FRL); Carver Middle School (math 22% / reading 34%, grade F, #486 of 571 statewide, top 86%, 732 students, 73% FRL); Boynton Beach Community High (math 13% / reading 25%, grade F, #565 of 667 statewide, top 85%, 1,547 students, 65% FRL).
- Zoned-school proficiency averages 35% at this address vs 50% district-wide (-14 pts) — the specific schools serving this property underperform the Palm Beach average; the district grade overstates school quality for this exact location.
- Market conditions: Rents rising (+1.3%/yr); 489 active listings in the ZIP; 40 comparable units currently listed for rent nearby; rentals at typical pace (median 26d on market — plan ~3-4 weeks tenant-placement turnaround); solid renter incomes; 3,974 units permitted in Palm Beach County in 2024 (1,012 in 5+ unit buildings).
- This rent runs 41% of the median local income ($81k/yr) — at the standard rent-burdened threshold; future hikes will face affordability resistance.
Forward outlook
- In year one you build about $1k of equity ($2k loan paydown + $-641 appreciation (-0.2% local appreciation)).
- Palm Beach County population projected at +30% by 2050 — long-run rental-demand tailwind backs the buy-and-hold thesis.
Negotiation context
- It's been on market 18 days — a 2% lower offer ($261k) is reasonable based on typical stale-listing flexibility.
- 3 sale attempts since 21y ago with the ask held roughly flat each time — persistent listings suggest the price (not the market) is what's stuck; bring a comps-based counter.
- Current owner paid $150k; list at $265k implies a 77% gain — meaningful room to come down on a strong offer.
Risks & watch-outs
- Watch-outs: HOA is 25% of rent.
- Climate carrying-cost: severe wind risk, 99% chance of damaging wind over 30y; extreme-heat days projected 7→26/yr by 2055 (HVAC capex compounding) — expect insurance premiums to compound above CPI over the hold.
Questions for the listing agent
- What do current leases actually rent for vs. the listed asking? Can we see a recent rent roll and the last 12 months of T-12 income?
- What does the HOA fee cover, when was the last increase, and are there any pending special assessments or reserve-fund shortfalls?
- Any open or pending special assessments — roof, HVAC, plumbing, elevator, façade? What's the per-unit balance and payoff schedule, and is the seller paying it off at close or rolling it to the buyer?
- Is there a deadline driving the sale (1031 exchange, divorce, estate, relocation)? That informs how much negotiation room exists.
- The area grade is low — what's the realistic commute time and amenity access for the typical tenant pool here? Any planned neighborhood developments (good or bad) we should know about?
- What's the average days-on-market for RENTAL listings here right now (not sales)? A rising rental-DOM trend means longer vacancies and softer asking-rent achievability than the comps imply.
- What's the recent tenant-quality profile in this submarket — average credit score on applications, eviction rate, late-payment / NSF rate, and stable-employment percentage? A property-management company in the area should have these aggregated.
- How much new apartment / multifamily construction is in the pipeline within 1–3 miles? Heavy new supply (>2% of stock underway) typically softens rents 12–24 months out; light construction supports rent growth.
Investment metrics
- 1% rule
- 1.04% ✓
- Cap rate
- 5.48%
- Cash-on-cash
- -2.90%
- DSCR
- 0.87
- GRM
- 8.0
CMA / ARV
No comps found within radius.
Projected returns pro-forma
-0.24% appreciation · 1.28% rent growth · sell at horizon
- IRR
- -7.9%
- Equity multiple
- 0.64×
- Total profit
- $-26,526
- Equity at exit
- $73,761
- IRR
- -3.2%
- Equity multiple
- 0.68×
- Total profit
- $-23,574
- Equity at exit
- $86,159
Cash invested: $74,200 (down + closing). Projections, not guarantees.
Landlord ↔ Tenant lean methodology
- Overall (STATE)
- 87 Strongly Landlord-Friendly
- State Florida
- 87 Strongly Landlord-Friendly · R+3
- County
- — inherits STATE
- City
- — inherits STATE
ZIP-level market 33437
- Home prices YoY
- -0.1%
- Rents YoY
- 1.3%
- Active inventory
- 489
- Price-to-rent
- 8.0×
Monthly cashflow live
- Estimated rent
- $2,768 high interval (Pro) →
- Mortgage (P&I)
- −$1,390
- Tax from tax record
- −$167 /mo · $2,007/yr
- Insurance
- −$110
- HOA
- −$699
- Vacancy / Maint / Mgmt
- −$581
- Net cashflow
- $-180
Break-even live
Sensitivity live
| Price | -10% $-30 | -5% $-105 | +0% $-180 | +5% $-255 | +10% $-330 |
|---|---|---|---|---|---|
| Rent | -10% $-398 | -5% $-289 | +0% $-180 | +5% $-70 | +10% $39 |
| Rate | -1.0pp $-46 | -0.5pp $-112 | base $-180 | +0.5pp $-248 | +1.0pp $-318 |
UW: 25.0% down · 7.5% · 30yr · 1.5% tax · 5.0% vac · 8.0% maint · 8.0% mgmt
Financing live
Cash to close
- Down payment
- $66,250
- Closing costs
- $7,950
- Reserves months
- —
- Total cash needed
- —
Loan-product check · same deal, 3 products live
Conventional
25% down · 7.5% · 30yr
- Down + closing
- —
- Monthly P&I
- —
- Monthly cashflow
- —
- DSCR
- —
- Eligible?
- —
Personal DTI + credit; lowest rate.
DSCR
20% down · 8.5% · 30yr
- Down + closing
- —
- Monthly P&I
- —
- Monthly cashflow
- —
- DSCR
- —
- Eligible?
- —
No personal income docs; deal must DSCR.
Hard money
10% down · 12.0% · 12mo
- Down + closing
- —
- Monthly P&I
- —
- Monthly cashflow
- —
- DSCR
- —
- Eligible?
- —
Short-term bridge; refi at stabilization.
Rent comps 40 comps
| Address | Beds | Baths | Sqft | Rent | $/sqft | DOM | Units | Dist |
|---|---|---|---|---|---|---|---|---|
| 5750 Fairway Park Ct #101 Boynton Beach, FL | 3.0 | 2.0 | 1426 | $1,850 | $1.30 | 26d | 1 | 0.02mi |
| 5675 Northpointe Ln Boynton Beach, FL | 2.0 | 2.5 | 1163 | $2,950 | $2.54 | 26d | 1 | 0.20mi |
| 5675 Northpointe Ln Boynton Beach, FL | 2.0 | 2.0 | 1163 | $3,000 | $2.58 | 5d | 1 | 0.20mi |
| 5734 Northpointe Ln Boynton Beach, FL | 2.0 | 2.0 | 1125 | $2,600 | $2.31 | 6d | 1 | 0.22mi |
| 5734 Northpointe Ln Boynton Beach, FL | 2.0 | 2.0 | 1125 | $2,750 | $2.44 | 17d | 1 | 0.22mi |
| 5694 Northpointe Ln Boynton Beach, FL | 2.0 | 2.0 | 1125 | $2,825 | $2.51 | 9d | 1 | 0.22mi |
| 12118 Country Greens Blvd Boynton Beach, FL | 3.0 | 2.0 | 1566 | $3,000 | $1.92 | 13d | 1 | 0.23mi |
| 12299 Forest Greens Dr Boynton Beach, FL | 2.0 | 2.0 | 1310 | $2,450 | $1.87 | 19d | 1 | 0.40mi |
| 5570 Piping Rock Dr Boynton Beach, FL | 2.0 | 2.0 | 1478 | $3,000 | $2.03 | 1d | 1 | 0.44mi |
| 5570 Piping Rock Dr Boynton Beach, FL | 2.0 | 2.0 | 1478 | $2,850 | $1.93 | 26d | 1 | 0.44mi |
| 12390 Summer Springs Dr Boynton Beach, FL | 3.0 | 2.0 | 1861 | $3,300 | $1.77 | 26d | 1 | 0.51mi |
| 5335 Vernio Ln Boynton Beach, FL | 3.0 | 2.0 | 1798 | $3,700 | $2.06 | 26d | 1 | 0.62mi |
| 11282 Green Lake Dr #204 Boynton Beach, FL | 2.0 | 2.0 | 1196 | $3,750 | $3.14 | 26d | 1 | 0.69mi |
| 12547 Imperial Isle Dr Boynton Beach, FL | 2.0–3.0 | 2.0 | 1500 | $2,500 | $1.67 | 26d | 2 | 0.69mi |
| 11234 Green Lake Dr #102 Boynton Beach, FL | 2.0 | 2.0 | 1196 | $2,200 | $1.84 | 26d | 1 | 0.74mi |
| 11230 Green Lake Dr #204 Boynton Beach, FL | 3.0 | 2.0 | 1549 | $3,000 | $1.94 | 14d | 1 | 0.76mi |
| 11211 S Military Trl Boynton Beach, FL | 1.0–3.0 | 1.0–2.0 | 1033 | $2,260 | $2.19 | 0d | 31 | 0.79mi |
| 11115 Oakdale Rd Boynton Beach, FL | 3.0 | 2.0 | 1713 | $4,200 | $2.45 | 26d | 1 | 0.83mi |
| 12654 Via Ravenna Boynton Beach, FL | 3.0 | 2.0 | 1729 | $3,500 | $2.02 | 26d | 1 | 0.87mi |
| 13056 Anthorne Ln Unit 113 Boynton Beach, FL | 3.0 | 2.5 | 1755 | $3,600 | $2.05 | 1d | 1 | 0.94mi |
| 5574 Royal Lake Cir Boynton Beach, FL | 3.0 | 2.0 | 1658 | $5,000 | $3.02 | 17d | 1 | 0.99mi |
| 6446 Aspen Glen Cir Boynton Beach, FL | 3.0 | 2.0 | 1800 | $3,800 | $2.11 | 22d | 1 | 1.01mi |
| 6446 Aspen Glen Cir Unit 6446 Boynton Beach, FL | 3.0 | 2.0 | 1800 | $4,000 | $2.22 | 26d | 1 | 1.01mi |
| 10921 Royal Caribbean Cir Boynton Beach, FL | 3.0 | 2.0 | 1782 | $3,800 | $2.13 | 26d | 1 | 1.04mi |
| 10921 Royal Caribbean Cir Boynton Beach, FL | 3.0 | 2.0 | 1762 | $3,800 | $2.16 | 6d | 1 | 1.04mi |
| 5952 Regal Glen Dr #103 Boynton Beach, FL | 3.0 | 2.0 | 1813 | $2,550 | $1.41 | 26d | 1 | 1.10mi |
| 6599 Old Farm Trl #6599 Boynton Beach, FL | 3.0 | 2.5 | 1441 | $3,000 | $2.08 | 26d | 1 | 1.14mi |
| 5850 Sugar Palm Ct Delray Beach, FL | 2.0 | 2.0 | 1198 | $3,300 | $2.75 | 26d | 1 | 1.19mi |
| 13921 Royal Palm Ct Unit D Delray Beach, FL | 2.0 | 2.0 | 1205 | $4,000 | $3.32 | 9d | 1 | 1.20mi |
| 6633 Old Farm Trl Boynton Beach, FL | 3.0 | 2.5 | 1441 | $3,500 | $2.43 | 26d | 1 | 1.21mi |
| 6760 Heritage Grande #6304 Boynton Beach, FL | 2.0 | 2.0 | 880 | $2,000 | $2.27 | 24d | 1 | 1.23mi |
| 6769 Heritage Grande #2103 Boynton Beach, FL | 2.0 | 2.0 | 880 | $2,000 | $2.27 | 20d | 1 | 1.23mi |
| 6768 Heritage Grande Boynton Beach, FL | 2.0 | 2.0 | 1200 | $1,800 | $1.50 | 26d | 1 | 1.23mi |
| 6768 Heritage Grande Boynton Beach, FL | 2.0 | 2.0 | 1200 | $1,800 | $1.50 | 20d | 1 | 1.23mi |
| 10596 Sunset Isles Ct Boynton Beach, FL | 3.0 | 2.0 | 1769 | $4,500 | $2.54 | 26d | 1 | 1.28mi |
| 13817 Royal Palm Ct Unit B Delray Beach, FL | 2.0 | 2.0 | 1205 | $3,200 | $2.66 | 26d | 1 | 1.29mi |
| 10624 Tropic Palm Ave #202 Boynton Beach, FL | 3.0 | 2.0 | 1385 | $2,550 | $1.84 | 26d | 1 | 1.30mi |
| 6685 Old Farm Trl Boynton Beach, FL | 3.0 | 2.0 | 1361 | $2,995 | $2.20 | 26d | 1 | 1.32mi |
| 10592 Tropic Palm Ave #202 Boynton Beach, FL | 2.0 | 2.0 | 1385 | $2,450 | $1.77 | 26d | 1 | 1.34mi |
| 13283 Pineapple Palm Ct Unit F Delray Beach, FL | 2.0 | 2.0 | 1198 | $2,100 | $1.75 | 9d | 1 | 1.41mi |
HOA detail condo
- Monthly dues
- $699 · $8,388/yr
- Likely covers
- pool
- Assessments
- None detected in remarks — confirm with the listing agent.
Listing history 11 events
-
2026-06-21days on market $265,000 Active 18 DOM
-
2026-06-18days on market $265,000 Active 15 DOM
-
2026-06-17days on market $265,000 Active 14 DOM
-
2026-06-16days on market $265,000 Active 13 DOM
-
2026-06-15days on market $265,000 Active 12 DOM
-
2026-06-13days on market $265,000 Active 10 DOM
-
2026-06-09days on market $265,000 Active 6 DOM
-
2026-06-08days on market $265,000 Active 5 DOM
-
2026-06-07days on market $265,000 Active 4 DOM
-
2026-06-04remarks 422-char remark
-
2026-06-04$265,000 Active 1 DOM
ⓘ Source: listings_history table (triggers on properties + properties_extension) + one-shot
backfill from property_details.listing_events for pre-trigger history.
Tax reassessment forecast FL · Resets to sale price
- Current annual tax
- $2,007 · $167/mo
- Projected year-2 tax
- $2,200 · $183/mo
- Expected delta
- +$192/yr (+$16/mo · 9.6%)
ⓘ Screening estimate from a state-policy table — verify with the county assessor before closing.
Climate risk First Street
- Flood 1/10 Low FEMA zone X (unshaded) · 0% chance over 30 yrs
- Wildfire 1/10 Low
- Heat 9/10 Extreme 7 d/yr ≥106°F today · 26 d/yr by 30 yrs out
- Wind 10/10 Extreme 99% chance of damaging wind over 30 yrs
- Air quality 2/10 Low 1 unhealthy d/yr today · 2 by 30 yrs out
Nearby sold comps map
Loading sold comps map…
Walkable amenities ~0.75 mi
Loading nearby amenities…
Taxation est. · year 1
- Rental income
- $33,217
- − Mortgage interest
- −$14,844
- − Property taxes
- −$2,007
- − Insurance
- −$1,325
- − Repairs & maintenance
- −$2,657
- − Management
- −$2,657
- − HOA
- −$8,388
- − Depreciation
- −$7,709
- Taxable loss
- −$6,371
- Est. tax savings @ 24.0%
- +$1,529
- After-tax cash flow
- $-626/yr
For passive investors: Depreciation is non-cash, so a rental often shows a tax loss while cash-flowing — sheltering income. Rental losses are passive: they offset passive income freely, and up to $25,000/yr can offset ordinary (W-2) income if you actively participate and your MAGI is under $100k (phasing out to $0 by $150k); unused losses carry forward. On sale, claimed depreciation is recaptured at up to 25%, and gains may owe capital-gains tax (a 1031 exchange can defer both). Figures are a year-1 estimate at your 24.0% rate — not tax advice; consult a CPA.
Schools (NCES district)
- District
- Palm Beach
- NCES district ID
- 1201500
- Math proficiency
- 46% ▼ -16.00%
- Reading proficiency
- 53% ▼ -4.00%
- Median HH income
- $53,943
- Composite
- 42.72/100
- National rank
- #3160
- State rank
- #34 of 73 in FL
Livability — Golf
- Score
- 63/100
- State rank
- #703
- US rank
- #14941
Category grades
Schools grade is shown separately in the Schools card above.
Census & demographics
- County
- Palm Beach County · 1,438,312 people
- Metro
- Miami-Fort Lauderdale-Pompano Beach, FL
- Population (ZIP)
- 37,229
- Household income
- $80,710
- Rent vs Own
- Severe rent burden
- 902.0
Population outlook (Palm Beach County) Hauer SSP2
- Today (2025)
- 1,637,487 people
- By 2030
- 1,743,255 · +6.5%
- By 2040
- 1,948,712 · +19.0%
- By 2050
- 2,132,979 · +30.3%
- By 2075
- 2,530,027 · +54.5%
- By 2100
- 2,706,979 · +65.3%
Race, ethnicity, and origin ACS 2023
- Neighborhood character
- Predominantly White (68%)
- Race & ethnicity
- White 68% Two or more races 13% Hispanic / Latino 12% Black 10% Asian 3%
- Hispanic origin (detail)
- Mexican 1% Puerto Rican 2% Cuban 1% Dominican 1%
- Common ancestry
- Scotch-Irish 8% Romanian 8% Hispanic 6%
- Foreign-born
- 18% · Canada, Jamaica, Vietnam
- Languages at home
- 78% English-only · Spanish 10% French/Haitian/Cajun 6% Other Indo-European 2%
Political lean MEDSL · Palm Beach
- 2024 margin
- Toss-up / Even · D 50.0% · R 49.2%
- 2008→2024 swing
- -22.1pp toward R · 2008: 22.9pp · 2024: 0.8pp
- All cycles
- 2024: D+0.8 2020: D+12.8 2016: D+15.3 2012: D+17.0 2008: D+22.9
Not yet ingested
- Civics
- —
Market trends
- HPI YoY
- ▼ -0.24%
- Current HPI
- 257.5891
- Rent YoY
- ▲ 1.28%
- Metro
- Miami-Fort Lauderdale-Pompano Beach, FL
- State GDP YoY
- ▲ 3.28%
- F500 in state
- 36
Industry mix (Fortune 500 HQ in FL)
| Industry | F500 HQs | Revenue |
|---|---|---|
| Industrial Technology | 2 | $29B |
|
||
| Insurance | 2 | $17B |
|
||
| Retail | 1 | $60B |
|
||
| Technology Distribution | 1 | $58B |
|
||
| Homebuilding | 1 | $35B |
|
||
| Technology Manufacturing | 1 | $35B |
|
||
Price history
+268.1% since first listed11 events — show timeline
- 2026-06-03 Listed $265,000 Beaches MLS
- 2019-03-21 Sold (Public Records) $150,000 Public Records
- 2019-03-21 Sold (MLS) $150,000 Beaches MLS
- 2019-02-25 Contingent — Beaches MLS
- 2019-02-18 Price Changed $152,000 Beaches MLS
- 2019-01-24 Listed $155,000 Beaches MLS
- 2005-04-12 Sold (Public Records) $178,000 Public Records
- 2005-04-04 Sold (MLS) $178,000 Beaches MLS
- 2005-04-01 Listing Removed — Beaches MLS
- 2005-03-06 Listed $180,000 Beaches MLS
- 1995-06-14 Sold (Public Records) $72,000 Public Records
Property tax history
+6.9%/yrLatest (2025): $2,007 · +2.3% YoY. Source: county tax records.
Cash-flow waterfall
monthlySold comps — $/sqft
last 12 mo · ≤1 miLoading sold comps…