18425 NE 95th St #113 · Redmond, WA
Flood risk No data
- FEMA flood zone
- —
- Chance of flooding over 30 yrs
- —
- Est. flood insurance / yr
- —
Fire risk No data
- Est. fire insurance / yr
- —
Heat risk No data
- Hot days now (above threshold)
- —
- Hot days in 30 yrs
- —
Wind risk No data
- Chance of severe wind over 30 yrs
- —
Air-quality risk No data
- Unhealthy air days now
- —
- Unhealthy air days in 30 yrs
- —
Risk factors via First Street. Map © Google.
Why this score? — see what drove the B grade
The composite is a weighted blend of 9 inputs, each scored 0–100. Each bar is that input's sub-score; the figure is the points it added to the 100-point composite (weight × sub-score).
- Cash flow +30.0/30.0
- DSCR +10.0/10.0
- 1% rule +9.1/10.0
- Schools +7.5/10.0
- ARV discount +6.0/15.0
- Livability +4.4/5.0
- Condition / age +4.0/5.0
- Rent growth +2.7/5.0
- Appreciation +0.0/10.0
$160,000
🖨 Deal sheet (PDF) 📄 Offer letter ✓ Due diligence
Listing remarks
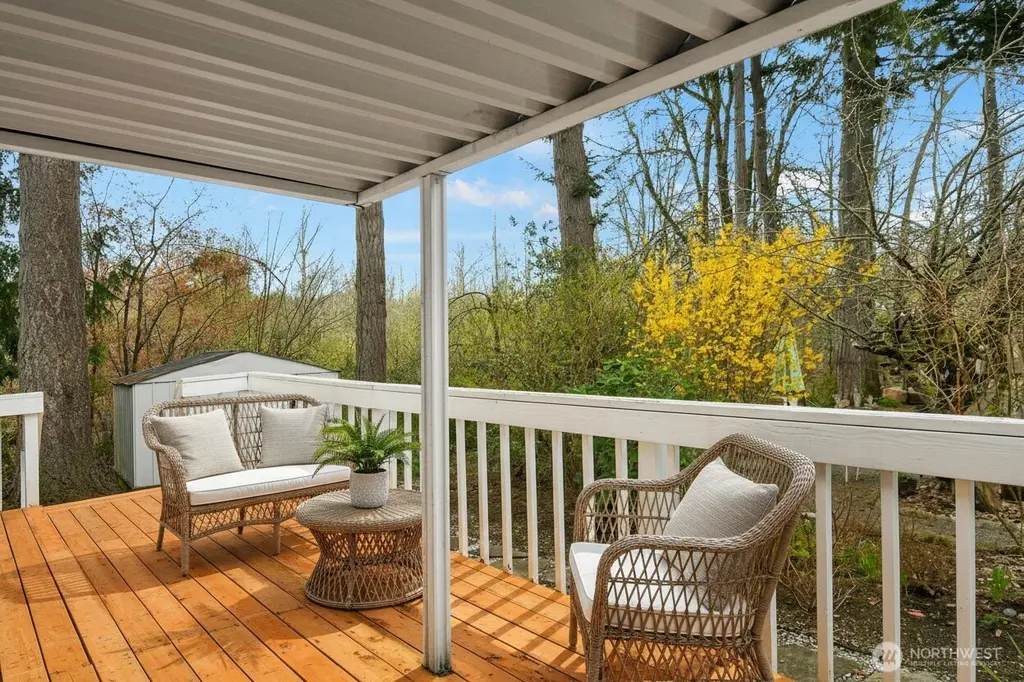
Welcome home to this 'Cute-as-a Button' single-wide home in the highly desired 55+ community of Friendly Village. Located 'across the bridge' in a peaceful and quiet cul-de-sac, this meticulously maintained home backs up to a green-belt and offers soothing territorial views and sounds of nature. Cheerful and bright, with newer double-paned vinyl windows, doors, a brand new hot water heater and a fresh paint job, this home is move-in ready! Enjoy summer on the newly re-built spacious deck. Home comes with a handy shed in the backyard and features a lovely low-maintenance yard. Enjoy the community clubhouse complete with a library, kitchen, laundry facilities, exercise room, pool table and a
Key facts
- Green-belt
- Peaceful cul-de-sac
- New hot water heater
Tags
Neighborhood map
What this means for you Summary
Snapshot
- This is a 1-bed/1.5-bath manufactured listed at $160k. Condition is rated good.
Deal economics
- At list price, monthly cash flow is $674 ($8k/yr) — positive.
- The deal already cash-flows at list — no discount required.
- Meets the 1% rule at list price ($2k rent vs $160k).
- Recommended offer: $155k (3.0% below list) — sets the bar for market timing.
- Cap rate 11.3% vs local median 1.4% in Redmond — top-decile yield for the area; either an underpriced asset or a hidden risk that comps aren't pricing in. Stress-test before assuming the spread holds.
Location & tenants
- Location reads 88/100 on livability (#10 in WA, #186 nationally) — a professional / high-income tenant draw. Strengths: amenities A+, commute A+, employment A+; Watch: cost of living F.
- Lake Washington School District (suburban): math 79% / reading 85% proficiency, ranked #3 of 291 in WA (top 1%) — strong family-tenant draw, lease renewals of 3-5y typical; only 10% free/reduced lunch — higher-income household profile.
- Zoned schools: Emily Dickinson Elementary (305 students, 11% FRL); Evergreen Middle School (771 students, 10% FRL); Redmond High School (2,218 students, 15% FRL) — zoned schools at 12% FRL track the district average.
- Market conditions: Rents flat; 337 active listings in the ZIP; 40 comparable units currently listed for rent nearby; rentals leasing fast (median 7d on market — plan ~1-2 weeks tenant-placement turnaround); high-income renter base; 10,555 units permitted in King County in 2024 (7,119 in 5+ unit buildings).
- This rent is only 17% of the median local income ($163k/yr) — well below the 30% rent-burden line; pricing power to push rent on renewal without tenant pushback.
Forward outlook
- Local home prices are declining (-3.0%/yr); year-one equity from $1k of loan paydown is wiped out by about $5k of value loss. Plan a longer hold.
- King County population projected at +44% by 2050 — long-run rental-demand tailwind backs the buy-and-hold thesis.
- At projected returns (-3.0% appreciation + 0.7% rent growth), your $45k cash investment doubles in ~9 years — after that, you're playing with house money.
Negotiation context
- It's been on market 41 days — a 3% lower offer ($155k) is reasonable based on typical stale-listing flexibility.
- 2 sale attempts since 21y ago with the ask held roughly flat each time — persistent listings suggest the price (not the market) is what's stuck; bring a comps-based counter.
- Current owner paid $7k; list at $160k implies a 2154% gain — meaningful room to come down on a strong offer.
Questions for the listing agent
- It's been on market 41 days. Have you received any prior offers? Is the seller open to a 3% concession, seller financing, or rate buy-down credit?
- Built in 1973 — when were the roof, HVAC, electrical panel, plumbing, and water heater last replaced?
- Is there a deadline driving the sale (1031 exchange, divorce, estate, relocation)? That informs how much negotiation room exists.
- Schools are A-rated — typically a magnet for longer-tenancy family renters. What's the average tenant stay here, and is there a school-zone premium baked into asking?
- What's the average days-on-market for RENTAL listings here right now (not sales)? A rising rental-DOM trend means longer vacancies and softer asking-rent achievability than the comps imply.
- What's the recent tenant-quality profile in this submarket — average credit score on applications, eviction rate, late-payment / NSF rate, and stable-employment percentage? A property-management company in the area should have these aggregated.
- How much new for-sale + rental construction is in the pipeline within 1–3 miles? Heavy new supply typically softens prices + rents 12–24 months out; constrained supply supports both.
Investment metrics
- 1% rule
- 1.41% ✓
- Cap rate
- 11.35%
- Cash-on-cash
- 18.06%
- DSCR
- 1.80
- GRM
- 5.9
CMA / ARV
- ARV (median comp)
- $154,858
- List price
- $160,000
- Delta
- 3.32%
- Verdict
- FAIR
- Comps
- 3 within 1.0 mi
Show comp detail 3 sales within ~0.75 mi
| Address | Dist | Beds/Ba | Sqft | Sold | Price | $/sf | Match |
|---|---|---|---|---|---|---|---|
| 18425 NE 95th St #113 | 0.00mi | 1/1.5 | 924 (0%) | 0mo | $150,000 | $162 | 100 |
| 18425 NE 95th St #82 | 0.07mi | 2/2.0 (+1) | 896 (-3%) | 2mo | $179,950 | $201 | 83 |
| 18425 NE 95 St #52 | 0.08mi | 2/2.0 (+1) | 1,056 (+14%) | 23mo | $245,000 | $232 | 46 |
Match score weights: distance 35% · size 25% · config 20% · recency 20%. Top-matched comps best support the ARV.
Projected returns pro-forma
-3.0% appreciation · 0.65% rent growth · sell at horizon
- IRR
- 7.0%
- Equity multiple
- 1.26×
- Total profit
- $11,834
- Equity at exit
- $23,857
- IRR
- 14.1%
- Equity multiple
- 2.01×
- Total profit
- $45,349
- Equity at exit
- $13,834
Cash invested: $44,800 (down + closing). Projections, not guarantees.
Landlord ↔ Tenant lean methodology
- Overall (STATE)
- 28 Tenant-Leaning
- State Washington
- 28 Tenant-Leaning · D+8
- County
- — inherits STATE
- City
- — inherits STATE
ZIP-level market 98052
- Rents YoY
- 0.7%
- Active inventory
- 337
- Price-to-rent
- 5.9×
Monthly cashflow live
- Estimated rent
- $2,253 high interval (Pro) →
- Mortgage (P&I)
- −$839
- Tax est. 1.5%
- −$200 /mo · $2,400/yr
- Insurance
- −$67
- HOA
- −$0
- Vacancy / Maint / Mgmt
- −$473
- Net cashflow
- $674
Break-even live
Sensitivity live
| Price | -10% $785 | -5% $729 | +0% $674 | +5% $619 | +10% $564 |
|---|---|---|---|---|---|
| Rent | -10% $496 | -5% $585 | +0% $674 | +5% $763 | +10% $852 |
| Rate | -1.0pp $755 | -0.5pp $715 | base $674 | +0.5pp $633 | +1.0pp $590 |
UW: 25.0% down · 7.5% · 30yr · 1.5% tax · 5.0% vac · 8.0% maint · 8.0% mgmt
Financing live
Cash to close
- Down payment
- $40,000
- Closing costs
- $4,800
- Reserves months
- —
- Total cash needed
- —
Loan-product check · same deal, 3 products live
Conventional
25% down · 7.5% · 30yr
- Down + closing
- —
- Monthly P&I
- —
- Monthly cashflow
- —
- DSCR
- —
- Eligible?
- —
Personal DTI + credit; lowest rate.
DSCR
20% down · 8.5% · 30yr
- Down + closing
- —
- Monthly P&I
- —
- Monthly cashflow
- —
- DSCR
- —
- Eligible?
- —
No personal income docs; deal must DSCR.
Hard money
10% down · 12.0% · 12mo
- Down + closing
- —
- Monthly P&I
- —
- Monthly cashflow
- —
- DSCR
- —
- Eligible?
- —
Short-term bridge; refi at stabilization.
Rent comps 40 comps
| Address | Beds | Baths | Sqft | Rent | $/sqft | DOM | Units | Dist |
|---|---|---|---|---|---|---|---|---|
| 9009 Avondale Rd NE Unit K122 Redmond, WA | 2.0 | 2.0 | 958 | $2,800 | $2.92 | 26d | 1 | 0.47mi |
| 9009 Avondale Rd NE Redmond, WA | 2.0 | 2.0 | 1026 | $2,672 | $2.60 | 45d | 2 | 0.52mi |
| 17771 NE 90th St Redmond, WA | 1.0–3.0 | 1.0–2.0 | 1062 | $2,190 | $2.06 | 0d | 13 | 0.58mi |
| 17202 NE 85th Pl Redmond, WA | 2.0 | 1.0–2.0 | 891 | $2,457 | $2.76 | 0d | 4 | 0.78mi |
| 17634 NE Union Hill Rd Redmond, WA | 1.0–2.0 | 1.0–2.0 | 822 | $1,979 | $2.41 | 0d | 5 | 0.81mi |
| 8222 169th Ave NE Unit C4 Redmond, WA | 2.0 | 1.0 | 831 | $2,195 | $2.64 | 26d | 1 | 1.15mi |
| 8020 169th Ave NE Unit 12 Redmond, WA | 2.0 | 1.0 | 750 | $1,999 | $2.67 | 26d | 1 | 1.20mi |
| 8020 169th Ave NE Apt 2 Redmond, WA | 2.0 | 1.0 | 750 | $1,999 | $2.67 | 0d | 1 | 1.20mi |
| 16910 NE 80th St Redmond, WA | 2.0 | 1.0 | 825 | $1,995 | $2.42 | 21d | 1 | 1.23mi |
| 11305 183rd Pl NE Redmond, WA | 3.0 | 1.0–3.0 | 1211 | $2,885 | $2.38 | 0d | 1 | 1.25mi |
| 7805 170th Pl NE Redmond, WA | 1.0 | 1.0 | 725 | $2,388 | $3.29 | 0d | 2 | 1.25mi |
| 11220 196th Ave NE Unit 1 Redmond, WA | 1.0 | 1.0 | 600 | $2,500 | $4.17 | 45d | 1 | 1.26mi |
| 9447 166th Ave NE Redmond, WA | 1.0 | 1.0 | 600 | $1,745 | $2.91 | 18d | 1 | 1.28mi |
| 7920 168th Ave NE Redmond, WA | 1.0 | 1.0 | 600 | $1,595 | $2.66 | 45d | 1 | 1.30mi |
| 8851 166th Ave NE Unit A101 Redmond, WA | 1.0 | 1.0 | 772 | $1,995 | $2.58 | 23d | 1 | 1.30mi |
| 16518 NE 91st St Redmond, WA | 1.0–2.0 | 1.0 | 900 | $2,250 | $2.50 | 6d | 8 | 1.30mi |
| 8839 166th Ave NE Unit C101 Redmond, WA | 1.0 | 1.0 | 772 | $2,000 | $2.59 | 12d | 1 | 1.32mi |
| 8845 166th Ave NE Unit B104 Redmond, WA | 1.0 | 1.0 | 772 | $2,400 | $3.11 | 0d | 1 | 1.33mi |
| 17645 NE 69th Ct Unit 1009 Redmond, WA | 1.0 | 1.0 | 641 | $1,820 | $2.84 | 45d | 1 | 1.33mi |
| 17620 NE 69th Ct Redmond, WA | 1.0–3.0 | 1.0–2.0 | 994 | $2,120 | $2.13 | 0d | 21 | 1.33mi |
| 16405 NE 95th St Redmond, WA | 1.0–2.0 | 1.0–1.5 | 940 | $2,100 | $2.23 | 45d | 4 | 1.34mi |
| 16590 NE 83rd St Redmond, WA | 2.0 | 1.0–2.0 | 769 | $2,595 | $3.37 | 12d | 3 | 1.38mi |
| 7705 168th Ave NE Redmond, WA | 1.0 | 1.0 | 731 | $2,794 | $3.82 | 5d | 4 | 1.39mi |
| 8700 164th Ave NE Redmond, WA | 1.0 | 1.0 | 865 | $2,861 | $3.31 | 45d | 1 | 1.39mi |
| 8704 164th Ave NE Redmond, WA | 2.0 | 1.0 | 950 | $1,135 | $1.19 | 45d | 1 | 1.40mi |
| 8980 Redmond Woodinville Rd NE #302 Redmond, WA | 1.0 | 1.0 | 665 | $2,150 | $3.23 | 4d | 1 | 1.40mi |
| 8460 164th Ave NE Redmond, WA | 1.0 | 1.0 | 510 | $2,501 | $4.90 | 6d | 3 | 1.42mi |
| 16771 Redmond Way Redmond, WA | 3.0 | 1.0–2.0 | 928 | $2,952 | $3.18 | 0d | 266 | 1.42mi |
| 9200 Redmond Woodinville Rd NE Redmond, WA | 1.0 | 1.0 | 750 | $2,128 | $2.84 | 0d | 2 | 1.42mi |
| 8920 Redmond Woodinville Rd NE Unit 8946 Redmond, WA | 1.0 | 1.0 | 756 | $1,695 | $2.24 | 6d | 1 | 1.43mi |
| 8920 Redmond Woodinville Rd NE Unit 8952 Redmond, WA | 2.0 | 1.0 | 875 | $1,885 | $2.15 | 6d | 1 | 1.43mi |
| 16550 NE 79th St Redmond, WA | 1.0–2.0 | 1.0–2.0 | 818 | $2,717 | $3.32 | 5d | 3 | 1.44mi |
| 9110 Woodinville Redmond Rd NE Unit PM-UF-RED9110_302 Redmond, WA | 2.0 | 1.0 | 925 | $2,375 | $2.57 | 6d | 1 | 1.45mi |
| 8280 164th Ave NE Redmond, WA | 2.0 | 1.0–2.0 | 828 | $2,798 | $3.38 | 0d | 9 | 1.46mi |
| 9398 Redmond Woodinville Rd NE #126 Redmond, WA | 1.0 | 1.0 | 750 | $1,962 | $2.62 | 45d | 1 | 1.46mi |
| 10509 165th Pl NE Unit 1545767P Redmond, WA | 2.0 | 2.0 | 990 | $6,032 | $6.09 | 16d | 1 | 1.47mi |
| 16450 Redmond Way Unit 1BR 1BA Redmond, WA | 1.0 | 1.0 | 644 | $4,899 | $7.61 | 45d | 1 | 1.47mi |
| 17565 NE 67th Ct Redmond, WA | 1.0–2.0 | 1.0–2.0 | 874 | $2,696 | $3.08 | 0d | 7 | 1.47mi |
| 6332 E Lake Sammamish Pkwy NE Redmond, WA | 1.0–3.0 | 1.0–2.0 | 1134 | $2,214 | $1.95 | 0d | 10 | 1.47mi |
| 16595 Redmond Way Redmond, WA | 1.0–2.0 | 1.0–2.0 | 830 | $2,061 | $2.48 | 0d | 27 | 1.47mi |
Listing history 3 events
-
2026-04-09$160,000 Active
-
2005-11-23soldstatus $7,100
-
2005-10-04$8,100
ⓘ Source: listings_history table (triggers on properties + properties_extension) + one-shot
backfill from property_details.listing_events for pre-trigger history.
Nearby sold comps map
Loading sold comps map…
Walkable amenities ~0.75 mi
Loading nearby amenities…
Taxation est. · year 1
- Rental income
- $27,035
- − Mortgage interest
- −$8,962
- − Property taxes
- −$2,400
- − Insurance
- −$800
- − Repairs & maintenance
- −$2,163
- − Management
- −$2,163
- − Depreciation
- −$4,655
- Taxable income
- $5,892
- Est. tax owed @ 24.0%
- −$1,414
- After-tax cash flow
- $6,675/yr
For passive investors: Depreciation is non-cash, so a rental often shows a tax loss while cash-flowing — sheltering income. Rental losses are passive: they offset passive income freely, and up to $25,000/yr can offset ordinary (W-2) income if you actively participate and your MAGI is under $100k (phasing out to $0 by $150k); unused losses carry forward. On sale, claimed depreciation is recaptured at up to 25%, and gains may owe capital-gains tax (a 1031 exchange can defer both). Figures are a year-1 estimate at your 24.0% rate — not tax advice; consult a CPA.
Condition & rehab AI · 10 photos
This move-in ready single-wide home in a peaceful 55+ community offers a fresh paint job, new appliances, and a newly re-built deck, making it an excellent investment opportunity.
Value-add opportunities
- Both landscaping — enhances curb appeal and adds value
- Both furniture — improves the home's livability and appeal
- Both upgraded appliances — attracts more buyers and renters
Renovation cost estimate screening
Value-add ROI direction
- Both landscaping — enhances curb appeal and adds value ↑
- Both furniture — improves the home's livability and appeal ↑
- Both upgraded appliances — attracts more buyers and renters ↑
ⓘ Cost ranges are severity-bucket heuristics (US national rule-of-thumb). Get contractor quotes + a written scope before underwriting a rehab budget.
Schools (NCES district)
- District
- Lake Washington School District
- NCES district ID
- 5304230
- Math proficiency
- 79% ▬ 0.00%
- Reading proficiency
- 85% ▲ 1.00%
- Median HH income
- $103,849
- Composite
- 75.15/100
- National rank
- #251
- State rank
- #3 of 291 in WA
Livability — Redmond
- Score
- 88/100
- State rank
- #10
- US rank
- #186
Category grades
Schools grade is shown separately in the Schools card above.
Census & demographics
- Census place
- Redmond, WA
- County
- King County · 2,251,916 people
- City population
- 103,482
- Metro
- Seattle-Tacoma-Bellevue, WA
- Population (ZIP)
- 80,717
- Household income
- $163,460
- Rent vs Own
- Severe rent burden
- 3044.0
Population outlook (King County) Hauer SSP2
- Today (2025)
- 2,576,485 people
- By 2030
- 2,803,316 · +8.8%
- By 2040
- 3,255,921 · +26.4%
- By 2050
- 3,706,444 · +43.9%
- By 2075
- 4,746,063 · +84.2%
- By 2100
- 5,407,730 · +109.9%
Race, ethnicity, and origin ACS 2023
- Neighborhood character
- Diverse neighborhood (Simpson 0.62)
- Race & ethnicity
- White 47% Asian 38% Two or more races 7% Hispanic / Latino 7% Black 2%
- Hispanic origin (detail)
- Mexican 5%
- Common ancestry
- Portuguese 2% Italian 2% Scotch-Irish 2%
- Foreign-born
- 44% · China, Canada, South Korea
- Languages at home
- 53% English-only · Other Asian/Pacific 11% Chinese 10% Other Indo-European 10%
Political lean MEDSL · King
- 2024 margin
- Solid D (+51.7) · D 74.2% · R 22.5% · Other 3.4%
- 2008→2024 swing
- +9.6pp toward D · 2008: 42.1pp · 2024: 51.7pp
- All cycles
- 2024: D+51.7 2020: D+52.7 2016: D+50.4 2012: D+39.9 2008: D+42.1
Not yet ingested
- Civics
- —
Market trends
- HPI YoY
- ▼ -1157.66%
- Current HPI
- 434.1949
- Rent YoY
- ▲ 0.65%
- Metro
- Seattle-Tacoma-Bellevue, WA
- State GDP YoY
- ▲ 4.65%
- F500 in state
- 22
Industry mix (Fortune 500 HQ in WA)
| Industry | F500 HQs | Revenue |
|---|---|---|
| Retail | 2 | $269B |
|
||
| Technology / Retail | 1 | $638B |
|
||
| Technology | 1 | $245B |
|
||
| Telecommunications | 1 | $38B |
|
||
| Food / Beverage | 1 | $36B |
|
||
| Automotive / Trucks | 1 | $34B |
|
||
Price history
+1875.3% since first listed3 events — show timeline
- 2026-04-09 Listed $160,000 NWMLS as Distributed by MLS Grid
- 2005-11-23 Sold (MLS) $7,100 NWMLS as Distributed by MLS Grid
- 2005-10-04 Listed $8,100 NWMLS as Distributed by MLS Grid
Cash-flow waterfall
monthlySold comps — $/sqft
last 12 mo · ≤1 miLoading sold comps…