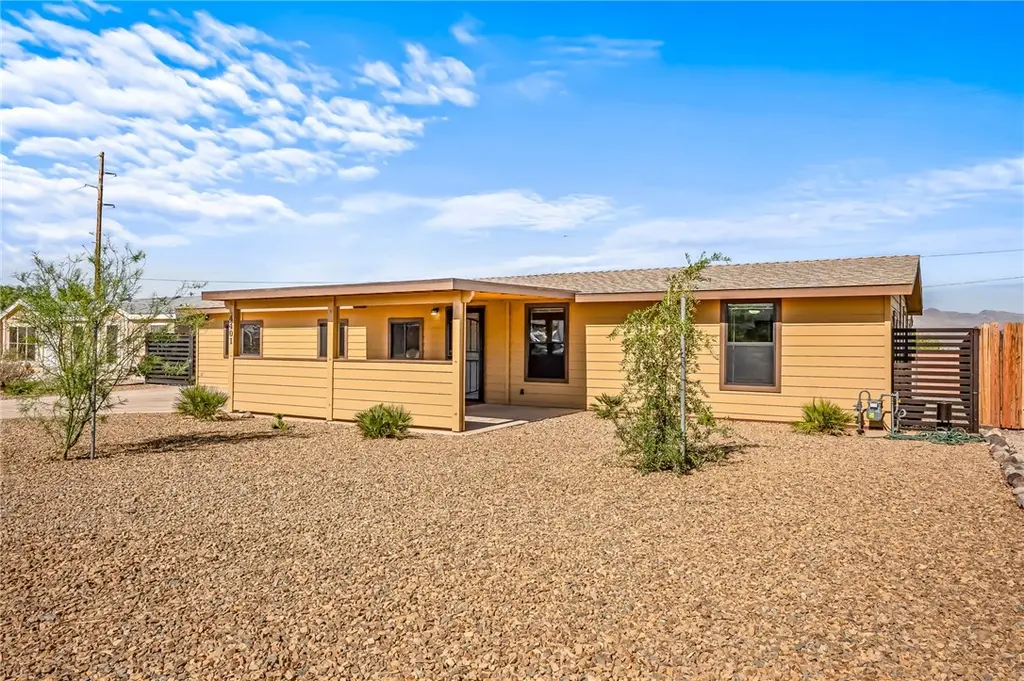
4401 S Morgan Way · Fort Mohave, AZ
Flood risk 1/10 · Minimal
- FEMA flood zone
- X (shaded)
- Chance of flooding over 30 yrs
- 0.0%
- Est. flood insurance / yr
- $507 – $1,088
Fire risk 4/10 · Minor
- Est. fire insurance / yr
- $610 – $1,132
Heat risk 9/10 · Severe
- Hot days now (above 115°F)
- 6 days/yr
- Hot days in 30 yrs
- 13 days/yr
Wind risk 1/10 · Minimal
- Chance of severe wind over 30 yrs
- —
Air-quality risk 1/10 · Minimal
- Unhealthy air days now
- 0 days/yr
- Unhealthy air days in 30 yrs
- 0 days/yr
Risk factors via First Street. Map © Google.
Why this score? — see what drove the D grade
The composite is a weighted blend of 9 inputs, each scored 0–100. Each bar is that input's sub-score; the figure is the points it added to the 100-point composite (weight × sub-score).
- Cash flow +17.0/30.0
- ARV discount +9.6/15.0
- DSCR +5.3/10.0
- 1% rule +3.4/10.0
- Livability +3.2/5.0
- Rent growth +2.5/5.0
- Condition / age +2.5/5.0
- Schools +1.3/10.0
- Appreciation +0.0/10.0
$245,000
🖨 Deal sheet (PDF) 📄 Offer letter ✓ Due diligence
Listing remarks
Beautifully remodeled 4-bedroom, 2-bath home offering 1,435 sq. ft. of comfortable living space and packed with upgrades. This move-in ready property features new flooring, fresh paint, new windows, and a new A/C system for added comfort and efficiency. The open and inviting interior creates a bright, welcoming atmosphere that's ready for you to make your own. Step outside to a covered patio providing the perfect space to entertain, relax, host gatherings, or enjoy your morning coffee. The landscaping has already been completed, giving the property great curb appeal with minimal upkeep. Located in a desirable HOA community with access to a community pool, this turnkey home combines modern u
Key facts
- Remodeled
- New a/c system
- Fresh paint
Tags
Property features AI
Finance
- HOA & community: Homeowners association with a $120 quarterly fee (about $40/month); Community pool
Exterior
- Utilities: Public water; Public sewer; 220 volt electric service; Electricity available; Natural gas available
- Home design: Manufactured home (double wide); Residential property; Shingle roof
- Construction: Shingle roof; Double wide manufactured construction
- Exterior features: Block fencing; Community pool; Paved road access; Lot roughly 75 x 83 (0.14 acres)
Interior
- Kitchen: Gas range; Gas oven; Dishwasher; Microwave; Disposal; Pantry
- Bathrooms: 2 full bathrooms
- Heating & cooling: Central heating (natural gas); Central air; Ceiling fan(s); Electric cooling
- Interior features: Ceiling fans; Pantry; Walk-in closet(s); Accessible entrance
- Laundry & utility: Dryer; Water heater
Neighborhood map
What this means for you Summary
Snapshot
- This is a 4-bed/2.0-bath manufactured listed at $245k.
Deal economics
- At list price, monthly cash flow is $165 ($2k/yr) — positive.
- The deal already cash-flows at list — no discount required.
- To meet the 1% rule (rent ≥ 1% of price), the offer needs to be $207k (15.6% below list).
- Recommended offer: $207k (15.6% below list) — sets the bar for 1% rule.
- Cap rate 7.1% vs local median 4.3% in Fort Mohave — top-decile yield for the area; either an underpriced asset or a hidden risk that comps aren't pricing in. Stress-test before assuming the spread holds.
Location & tenants
- Location reads 65/100 on livability (#88 in AZ) — a middle-class / working-renter tenant base. Strengths: cost of living A+, housing A+; Watch: employment C-, health & safety C-, crime D+.
- Colorado River Union High School District (4381) (town): math 13% / reading 17% proficiency, ranked #213 of 249 in AZ (top 86%) — low school quality limits family demand, transient renter base, plan for 1-2y turnover.
- Zoned schools: Camp Mohave Elementary School (math 29% / reading 40%, grade F, #471 of 1,109 statewide, top 44%, 375 students, 66% FRL); Mohave Valley Junior High School (math 28% / reading 31%, grade F, #84 of 218 statewide, top 41%, 448 students, 55% FRL); River Valley High School (math 12% / reading 12%, grade F, #287 of 381 statewide, top 76%, 545 students, 50% FRL).
- Market conditions: 380 active listings in the ZIP; 1 comparable units currently listed for rent nearby; 2,543 units permitted in Mohave County in 2024 (33 in 5+ unit buildings).
- This rent runs 38% of the median local income ($65k/yr) — at the standard rent-burdened threshold; future hikes will face affordability resistance.
Forward outlook
- Local home prices are declining (-3.0%/yr); year-one equity from $2k of loan paydown is wiped out by about $7k of value loss. Plan a longer hold.
- Mohave County population projected to shrink 6% by 2050 — rents likely to lag national; underwrite the cash flow, not the appreciation.
Negotiation context
- Only 13 days on market — expect competitive offers; lowballing is unlikely to land.
- Current owner paid $67k; list at $245k implies a 264% gain — meaningful room to come down on a strong offer.
Risks & watch-outs
- Climate carrying-cost: extreme-heat days projected 6→13/yr by 2055 (HVAC capex compounding) — expect insurance premiums to compound above CPI over the hold.
Questions for the listing agent
- What does the HOA fee cover, when was the last increase, and are there any pending special assessments or reserve-fund shortfalls?
- Is there a deadline driving the sale (1031 exchange, divorce, estate, relocation)? That informs how much negotiation room exists.
- Schools are F-rated, which usually means shorter tenancies and higher turnover. Who's the typical renter profile here, and what's been the actual vacancy rate?
- Crime grade is D in this area — have there been break-ins, vandalism, or insurance claims at this property in the last 3 years? What carrier currently insures it and at what premium?
- The area grade is low — what's the realistic commute time and amenity access for the typical tenant pool here? Any planned neighborhood developments (good or bad) we should know about?
- What's the average days-on-market for RENTAL listings here right now (not sales)? A rising rental-DOM trend means longer vacancies and softer asking-rent achievability than the comps imply.
- What's the recent tenant-quality profile in this submarket — average credit score on applications, eviction rate, late-payment / NSF rate, and stable-employment percentage? A property-management company in the area should have these aggregated.
- How much new for-sale + rental construction is in the pipeline within 1–3 miles? Heavy new supply typically softens prices + rents 12–24 months out; constrained supply supports both.
Investment metrics
- 1% rule
- 0.84% ✗
- Cap rate
- 7.10%
- Cash-on-cash
- 2.88%
- DSCR
- 1.13
- GRM
- 9.9
CMA / ARV
- ARV (on-the-fly)
- $256,865
- Comps found
- 12
Show comp detail 12 sales within ~0.75 mi
| Address | Dist | Beds/Ba | Sqft | Sold | Price | $/sf | Match |
|---|---|---|---|---|---|---|---|
| 2572 E Sunrise Vista Blvd | 0.15mi | 3/2.0 (-1) | 1,355 (-6%) | 1mo | $110,000 | $81 | 78 |
| 2586 E Spunkmeyer Way | 0.20mi | 3/2.0 (-1) | 1,500 (+4%) | 12mo | $270,000 | $180 | 68 |
| 4263 S Tamara Ter | 0.26mi | 3/2.0 (-1) | 1,394 (-3%) | 12mo | $263,000 | $189 | 68 |
| 4462 S Amanda Ave | 0.27mi | 3/2.0 (-1) | 1,588 (+11%) | 1mo | $235,000 | $148 | 64 |
| 4388 S Amanda Ave | 0.24mi | 3/2.0 (-1) | 1,246 (-13%) | 4mo | $265,000 | $213 | 59 |
| 4486 S Lynda Cir | 0.24mi | 3/2.0 (-1) | 1,590 (+11%) | 11mo | $238,000 | $150 | 57 |
| 2637 E Davida Ave | 0.36mi | 3/2.0 (-1) | 1,542 (+8%) | 12mo | $230,000 | $149 | 56 |
| 4263 S Amanda Ave | 0.35mi | 4/2.0 | 1,590 (+11%) | 14mo | $270,000 | $170 | 54 |
| 2652 E Vicki Ave | 0.39mi | 3/2.0 (-1) | 1,624 (+13%) | 2mo | $290,000 | $179 | 53 |
| 2711 E Vicki Ave | 0.50mi | 3/2.0 (-1) | 1,575 (+10%) | 3mo | $253,000 | $161 | 53 |
| 2619 E Mary Ave | 0.34mi | 4/2.0 | 1,628 (+13%) | 13mo | $299,900 | $184 | 51 |
| 2212 Arizona Ave | 0.60mi | 3/2.0 (-1) | 1,568 (+9%) | 9mo | $345,000 | $220 | 44 |
Match score weights: distance 35% · size 25% · config 20% · recency 20%. Top-matched comps best support the ARV.
Projected returns pro-forma
-3.0% appreciation · 3.0% rent growth · sell at horizon
- IRR
- -11.8%
- Equity multiple
- 0.57×
- Total profit
- $-29,323
- Equity at exit
- $36,530
- IRR
- -2.7%
- Equity multiple
- 0.82×
- Total profit
- $-12,467
- Equity at exit
- $21,183
Cash invested: $68,600 (down + closing). Projections, not guarantees.
Landlord ↔ Tenant lean methodology
- Overall (STATE)
- 87 Strongly Landlord-Friendly
- State Arizona
- 87 Strongly Landlord-Friendly · R+3
- County
- — inherits STATE
- City
- — inherits STATE
ZIP-level market 86426
- Home prices YoY
- -5.2%
- Active inventory
- 380
- Price-to-rent
- 9.9×
Monthly cashflow live
- Estimated rent
- $2,067 medium interval (Pro) →
- Mortgage (P&I)
- −$1,285
- Tax from tax record
- −$42 /mo · $500/yr
- Insurance
- −$102
- HOA
- −$40
- Vacancy / Maint / Mgmt
- −$434
- Net cashflow
- $165
Break-even live
Sensitivity live
| Price | -10% $303 | -5% $234 | +0% $165 | +5% $-185 | +10% $-269 |
|---|---|---|---|---|---|
| Rent | -10% $1 | -5% $83 | +0% $165 | +5% $246 | +10% $328 |
| Rate | -1.0pp $288 | -0.5pp $227 | base $165 | +0.5pp $101 | +1.0pp $37 |
UW: 25.0% down · 7.5% · 30yr · 1.5% tax · 5.0% vac · 8.0% maint · 8.0% mgmt
Financing live
Cash to close
- Down payment
- $61,250
- Closing costs
- $7,350
- Reserves months
- —
- Total cash needed
- —
Loan-product check · same deal, 3 products live
Conventional
25% down · 7.5% · 30yr
- Down + closing
- —
- Monthly P&I
- —
- Monthly cashflow
- —
- DSCR
- —
- Eligible?
- —
Personal DTI + credit; lowest rate.
DSCR
20% down · 8.5% · 30yr
- Down + closing
- —
- Monthly P&I
- —
- Monthly cashflow
- —
- DSCR
- —
- Eligible?
- —
No personal income docs; deal must DSCR.
Hard money
10% down · 12.0% · 12mo
- Down + closing
- —
- Monthly P&I
- —
- Monthly cashflow
- —
- DSCR
- —
- Eligible?
- —
Short-term bridge; refi at stabilization.
Rent comps 1 comps
| Address | Beds | Baths | Sqft | Rent | $/sqft | DOM | Units | Dist |
|---|---|---|---|---|---|---|---|---|
| 4408 S Caitlan Ave Fort Mohave, AZ | 3.0 | 2.0 | 1505 | $2,000 | $1.33 | 15d | 1 | 0.31mi |
HOA detail
- Monthly dues
- $40 · $480/yr
- Likely covers
- landscapingpool
Listing history 10 events
-
2026-06-22days on market $245,000 Active 13 DOM
-
2026-06-18days on market $245,000 Active 10 DOM
-
2026-06-17days on market $245,000 Active 9 DOM
-
2026-06-16days on market $245,000 Active 8 DOM
-
2026-06-15days on market $245,000 Active 7 DOM
-
2026-06-14days on market $245,000 Active 5 DOM
-
2026-06-13days on market $245,000 Active 4 DOM
-
2026-06-10days on market $245,000 Active 2 DOM
-
2026-06-09remarks 699-char remark
-
2026-06-09$245,000 Active 1 DOM
ⓘ Source: listings_history table (triggers on properties + properties_extension) + one-shot
backfill from property_details.listing_events for pre-trigger history.
Tax reassessment forecast AZ · Resets to sale price
- Current annual tax
- $500 · $42/mo
- Projected year-2 tax
- $1,617 · $135/mo
- Expected delta
- +$1,117/yr (+$93/mo · 223.5%)
ⓘ Screening estimate from a state-policy table — verify with the county assessor before closing.
Climate risk First Street
- Flood 1/10 Low FEMA zone X (shaded) · 0% chance over 30 yrs
- Wildfire 4/10 Moderate
- Heat 9/10 Extreme 6 d/yr ≥115°F today · 13 d/yr by 30 yrs out
- Wind 1/10 Low
- Air quality 1/10 Low 0 unhealthy d/yr today · 0 by 30 yrs out
Nearby sold comps map
Loading sold comps map…
Walkable amenities ~0.75 mi
Loading nearby amenities…
Taxation est. · year 1
- Rental income
- $24,807
- − Mortgage interest
- −$13,724
- − Property taxes
- −$500
- − Insurance
- −$1,225
- − Repairs & maintenance
- −$1,985
- − Management
- −$1,985
- − HOA
- −$480
- − Depreciation
- −$7,127
- Taxable loss
- −$2,218
- Est. tax savings @ 24.0%
- +$532
- After-tax cash flow
- $2,508/yr
For passive investors: Depreciation is non-cash, so a rental often shows a tax loss while cash-flowing — sheltering income. Rental losses are passive: they offset passive income freely, and up to $25,000/yr can offset ordinary (W-2) income if you actively participate and your MAGI is under $100k (phasing out to $0 by $150k); unused losses carry forward. On sale, claimed depreciation is recaptured at up to 25%, and gains may owe capital-gains tax (a 1031 exchange can defer both). Figures are a year-1 estimate at your 24.0% rate — not tax advice; consult a CPA.
Schools (NCES district)
- District
- Colorado River Union High School District (4381)
- NCES district ID
- 0400082
- Math proficiency
- 13% ▼ -17.00%
- Reading proficiency
- 17% ▼ -18.00%
- Median HH income
- $39,132
- Composite
- 12.72/100
- National rank
- #9603
- State rank
- #213 of 249 in AZ
Livability — Fort Mohave
- Score
- 65/100
- State rank
- #88
- US rank
- #13539
Category grades
Schools grade is shown separately in the Schools card above.
Census & demographics
- Census place
- Fort Mohave, AZ
- County
- Mohave County · 181,906 people
- City population
- 15,467
- Metro
- Lake Havasu City-Kingman, AZ
- Population (ZIP)
- 15,467
- Household income
- $64,551
- Rent vs Own
- Severe rent burden
- 207.0
Population outlook (Mohave County) Hauer SSP2
- Today (2025)
- 209,184 people
- By 2030
- 209,674 · +0.2%
- By 2040
- 205,897 · -1.6%
- By 2050
- 196,810 · -5.9%
- By 2075
- 169,454 · -19.0%
- By 2100
- 136,630 · -34.7%
Race, ethnicity, and origin ACS 2023
- Neighborhood character
- Predominantly White (73%)
- Race & ethnicity
- White 73% Hispanic / Latino 18% Two or more races 8% Asian 4%
- Hispanic origin (detail)
- Mexican 14%
- Common ancestry
- Lithuanian 3% Romanian 2% Italian 1%
- Foreign-born
- 7% · Canada
- Languages at home
- 88% English-only · Spanish 7% Tagalog/Filipino 2% Other Asian/Pacific 1%
Political lean MEDSL · Mohave
- 2024 margin
- Solid R (+55.8) · D 21.8% · R 77.6%
- 2008→2024 swing
- -22.9pp toward R · 2008: -32.9pp · 2024: -55.8pp
- All cycles
- 2024: R+55.8 2020: R+51.3 2016: R+51.5 2012: R+42.6 2008: R+32.9
Not yet ingested
- Civics
- —
Market trends
- HPI YoY
- ▼ -15.22%
- Current HPI
- 278.7975
- Rent YoY
- —
- Metro
- Lake Havasu City-Kingman, AZ
- State GDP YoY
- ▲ 4.54%
- F500 in state
- 20
Industry mix (Fortune 500 HQ in AZ)
| Industry | F500 HQs | Revenue |
|---|---|---|
| Technology | 2 | $13B |
|
||
| Mining / Metals | 1 | $23B |
|
||
| Environmental Services | 1 | $16B |
|
||
| Metals / Steel | 1 | $14B |
|
||
| Technology Distribution | 1 | $9B |
|
||
| Homebuilding | 1 | $8B |
|
||
Price history
+775.0% since first listed5 events — show timeline
- 2026-06-08 Listed $245,000 WARDEX
- 2003-04-22 Sold (Public Records) $67,400 Public Records
- 2002-08-26 Sold (Public Records) $67,400 Public Records
- 1997-12-30 Sold (Public Records) $55,000 Public Records
- 1996-12-10 Sold (Public Records) $28,000 Public Records
Property tax history
+0.6%/yrLatest (2025): $500 · +8.4% YoY. Source: county tax records.
Cash-flow waterfall
monthlySold comps — $/sqft
last 12 mo · ≤1 miLoading sold comps…