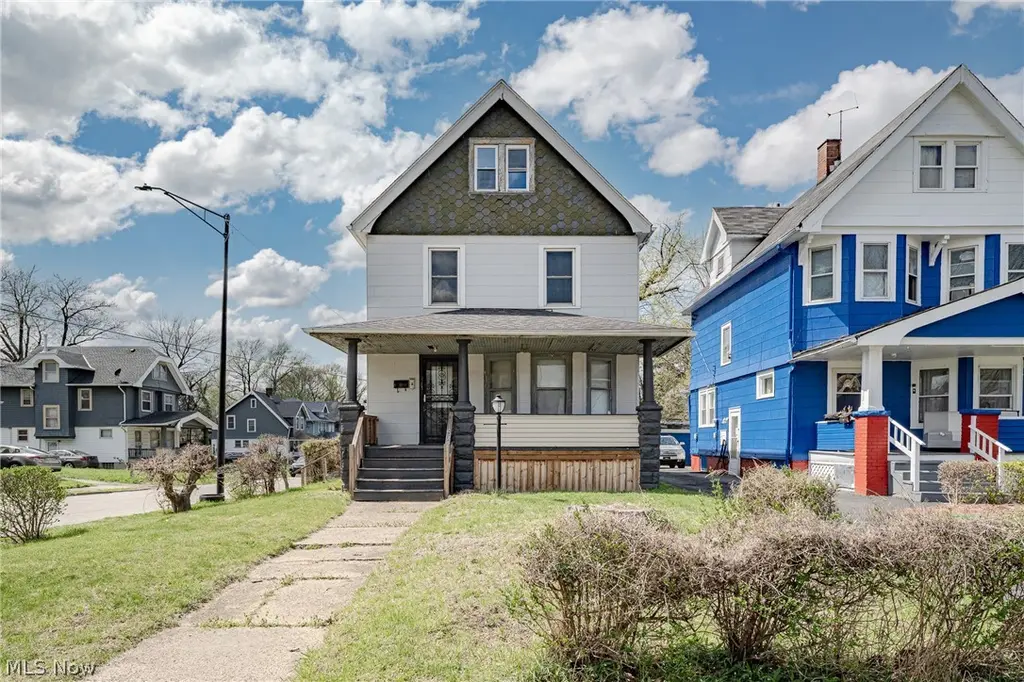
1484 E 135th St · East Cleveland, OH
Flood risk 1/10 · Minimal
- FEMA flood zone
- X (unshaded)
- Chance of flooding over 30 yrs
- 0.0%
- Est. flood insurance / yr
- $473 – $860
Fire risk 1/10 · Minimal
- Est. fire insurance / yr
- $713 – $1,323
Heat risk 3/10 · Minor
- Hot days now (above 95°F)
- 7 days/yr
- Hot days in 30 yrs
- 17 days/yr
Wind risk 1/10 · Minimal
- Chance of severe wind over 30 yrs
- —
Air-quality risk 3/10 · Minor
- Unhealthy air days now
- 3 days/yr
- Unhealthy air days in 30 yrs
- 5 days/yr
Risk factors via First Street. Map © Google.
Why this score? — see what drove the C+ grade
The composite is a weighted blend of 9 inputs, each scored 0–100. Each bar is that input's sub-score; the figure is the points it added to the 100-point composite (weight × sub-score).
- Cash flow +28.1/30.0
- DSCR +10.0/10.0
- ARV discount +7.5/15.0
- 1% rule +7.0/10.0
- Rent growth +3.8/5.0
- Livability +3.3/5.0
- Condition / age +2.5/5.0
- Schools +0.7/10.0
- Appreciation +0.0/10.0
$99,900
🖨 Deal sheet 📄 Offer letter ✓ Due diligence
Listing remarks
Welcome to 1484 E 135th St in East Cleveland, a colonial home offering a blend of classic character and thoughtful updates throughout. Fresh paint enhances much of the interior, creating a clean and refreshed feel from the moment you arrive. A welcoming front porch leads to the front door, opening into a foyer that sets the tone for the home's inviting layout. From the foyer, the space flows into the living room, where updated flooring extends across the first floor, creating a cohesive and modern look. Toward the back of the home, the kitchen features updated cabinetry and countertops, offering a solid foundation for future customization. Appliances are not included, allowing the next owne
Key facts
- Finished bonus room
- Updated flooring
- Updated cabinetry
Tags
Property features AI
Finance
- Financial info: Annual tax amount listed (2025)
Exterior
- Parking: No garage; property lists 2 garage spaces in records
- Utilities: Public water; Public sewer
- Home design: 2-story residence; Above-grade finished area recorded at 1,176
- Construction: Asbestos and vinyl siding exterior; Asphalt shingle roof
- Exterior features: Lot recorded at approximately 0.1093 acres
Interior
- Bedrooms: 6 total rooms (includes bedrooms and living spaces)
- Bathrooms: 1 full bathroom; 1 half bathroom
- Heating & cooling: Gas heating with radiators
- Interior features: Full unfinished basement
Neighborhood map
What this means for you Summary
Snapshot
- This is a 3-bed/1.0-bath single-family listed at $100k.
Deal economics
- At list price, monthly cash flow is $313 ($4k/yr) — positive.
- The deal already cash-flows at list — no discount required.
- Meets the 1% rule at list price ($1k rent vs $100k).
- Recommended offer: $98k (1.5% below list) — sets the bar for market timing.
- Cap rate 10.1% vs local median 17.4% in East Cleveland — below-typical yield; the buyer is paying a premium for something (appreciation thesis, condition, location) that the cap rate doesn't capture.
Location & tenants
- Location reads 66/100 on livability (#650 in OH) — a middle-class / working-renter tenant base. Strengths: commute A+, cost of living A+, health & safety A+; Watch: schools F, crime F, employment F.
- East Cleveland City School District (suburban): math 4% / reading 17% proficiency, ranked #652 of 656 in OH (top 99%) — low school quality limits family demand, transient renter base, plan for 1-2y turnover; 92% free/reduced lunch — lower-income household profile, screen leases tightly.
- Market conditions: Rents rising fast (+5.2%/yr); 99 active listings in the ZIP; 25 comparable units currently listed for rent nearby; rentals at typical pace (median 24d on market — plan ~3-4 weeks tenant-placement turnaround); 40% of comp listings sitting > 30 days — soft ceiling on asking rent; lower-income renter base — watch delinquency; 1,441 units permitted in Cuyahoga County in 2024 (700 in 5+ unit buildings).
- At $1,200/mo this rent would consume 50% of the median local household income ($29k/yr) (locally 1702% of renters already pay >50% of income on rent) — very limited rent-growth headroom before tenants either downsize or default.
Forward outlook
- Local home prices are declining (-3.0%/yr); year-one equity from $691 of loan paydown is wiped out by about $3k of value loss. Plan a longer hold.
- Cuyahoga County population projected to shrink 8% by 2050 — rents likely to lag national; underwrite the cash flow, not the appreciation.
- At projected returns (-3.0% appreciation + 5.2% rent growth), your $28k cash investment doubles in ~8 years — after that, you're playing with house money.
Negotiation context
- It's been on market 20 days — a 2% lower offer ($98k) is reasonable based on typical stale-listing flexibility.
- 2 sale attempts with the ask held roughly flat each time — persistent listings suggest the price (not the market) is what's stuck; bring a comps-based counter.
Risks & watch-outs
- Watch-outs: built in 1920 — expect roof / HVAC / electrical / plumbing capex.
Questions for the listing agent
- Built in 1920 — when were the roof, HVAC, electrical panel, plumbing, and water heater last replaced?
- Is there a deadline driving the sale (1031 exchange, divorce, estate, relocation)? That informs how much negotiation room exists.
- Schools are F-rated, which usually means shorter tenancies and higher turnover. Who's the typical renter profile here, and what's been the actual vacancy rate?
- Crime grade is F in this area — have there been break-ins, vandalism, or insurance claims at this property in the last 3 years? What carrier currently insures it and at what premium?
- What's the average days-on-market for RENTAL listings here right now (not sales)? A rising rental-DOM trend means longer vacancies and softer asking-rent achievability than the comps imply.
- What's the recent tenant-quality profile in this submarket — average credit score on applications, eviction rate, late-payment / NSF rate, and stable-employment percentage? A property-management company in the area should have these aggregated.
- How much new for-sale + rental construction is in the pipeline within 1–3 miles? Heavy new supply typically softens prices + rents 12–24 months out; constrained supply supports both.
Investment metrics
- 1% rule
- 1.20% ✓
- Cap rate
- 10.05%
- Cash-on-cash
- 13.42%
- DSCR
- 1.60
- GRM
- 6.9
CMA / ARV
- ARV (median comp)
- $43,775
- List price
- $99,900
- Delta
- 185.32%
- Verdict
- OVERPRICED
- Comps
- 20 within 1.0 mi
Show comp detail 12 sales within ~0.75 mi
| Address | Dist | Beds/Ba | Sqft | Sold | Price | $/sf | Match |
|---|---|---|---|---|---|---|---|
| 1524 E 133rd St | 0.14mi | 3/1.0 | 1,232 (+5%) | 6mo | $30,000 | $24 | 81 |
| 13500 Claiborne Rd | 0.12mi | 3/1.0 | 1,297 (+10%) | 5mo | $44,500 | $34 | 73 |
| 14205 Savannah Ave | 0.23mi | 3/1.5 | 1,160 (-1%) | 17mo | $40,000 | $34 | 71 |
| 14312 Scioto Ave | 0.35mi | 3/1.0 | 1,090 (-7%) | 2mo | $23,500 | $22 | 70 |
| 1371 E 141st St | 0.28mi | 3/1.0 | 1,216 (+3%) | 19mo | $16,500 | $14 | 66 |
| 1273 E 135th St | 0.40mi | 4/1.0 (+1) | 1,256 (+7%) | 3mo | $65,000 | $52 | 62 |
| 14200 Scioto Ave | 0.30mi | 3/1.0 | 1,256 (+7%) | 17mo | $48,500 | $39 | 61 |
| 13412 5th Ave | 0.30mi | 3/1.0 | 1,251 (+6%) | 18mo | $86,000 | $69 | 60 |
| 1358 E 134th St | 0.23mi | 3/1.0 | 1,286 (+9%) | 17mo | $42,500 | $33 | 59 |
| 1367 Shawview Ave | 0.50mi | 3/1.0 | 1,273 (+8%) | 8mo | $22,000 | $17 | 56 |
| 1227 E 135th St | 0.48mi | 3/1.0 | 1,312 (+12%) | 15mo | $65,000 | $50 | 46 |
| 14619 Elm Ave | 0.55mi | 3/1.0 | 1,008 (-14%) | 17mo | $65,000 | $64 | 36 |
Match score weights: distance 35% · size 25% · config 20% · recency 20%. Top-matched comps best support the ARV.
Projected returns pro-forma
-3.0% appreciation · 5.16% rent growth · sell at horizon
- IRR
- 5.7%
- Equity multiple
- 1.23×
- Total profit
- $6,384
- Equity at exit
- $14,895
- IRR
- 16.9%
- Equity multiple
- 2.52×
- Total profit
- $42,578
- Equity at exit
- $8,638
Cash invested: $27,972 (down + closing). Projections, not guarantees.
Landlord ↔ Tenant lean methodology
- Overall (STATE)
- 73 Landlord-Friendly
- State Ohio
- 73 Landlord-Friendly · R+6
- County
- — inherits STATE
- City
- — inherits STATE
ZIP-level market 44112
- Rents YoY
- 5.2%
- Active inventory
- 99
- Price-to-rent
- 6.9×
Monthly cashflow live
- Estimated rent
- $1,200 high interval (Pro) →
- Mortgage (P&I)
- −$524
- Tax from tax record
- −$70 /mo · $837/yr
- Insurance
- −$42
- HOA
- −$0
- Vacancy / Maint / Mgmt
- −$252
- Net cashflow
- $313
Break-even live
UW: 25.0% down · 7.5% · 30yr · 1.5% tax · 5.0% vac · 8.0% maint · 8.0% mgmt
Financing live
Cash to close
- Down payment
- $24,975
- Closing costs
- $2,997
- Reserves months
- —
- Total cash needed
- —
Loan-product check · same deal, 3 products live
Conventional
25% down · 7.5% · 30yr
- Down + closing
- —
- Monthly P&I
- —
- Monthly cashflow
- —
- DSCR
- —
- Eligible?
- —
Personal DTI + credit; lowest rate.
DSCR
20% down · 8.5% · 30yr
- Down + closing
- —
- Monthly P&I
- —
- Monthly cashflow
- —
- DSCR
- —
- Eligible?
- —
No personal income docs; deal must DSCR.
Hard money
10% down · 12.0% · 12mo
- Down + closing
- —
- Monthly P&I
- —
- Monthly cashflow
- —
- DSCR
- —
- Eligible?
- —
Short-term bridge; refi at stabilization.
Rent comps 25 comps
| Address | Beds | Baths | Sqft | Rent | $/sqft | DOM | Units | Dist |
|---|---|---|---|---|---|---|---|---|
| 1459 E 134th St Unit up East Cleveland, OH | 2.0 | 1.0 | 1150 | $850 | $0.74 | 10d | 1 | 0.06mi |
| 13900 Potomac Ave Cleveland, OH | 3.0 | 1.0 | 1172 | $1,355 | $1.16 | 24d | 1 | 0.15mi |
| 14205 Savannah Ave Cleveland, OH | 3.0 | 1.0 | 1160 | $1,350 | $1.16 | 16d | 1 | 0.23mi |
| 14005 Scioto Ave Cleveland, OH | 3.0 | 1.0 | 1056 | $1,570 | $1.49 | 16d | 1 | 0.24mi |
| 14009 Mayfair Ave Unit 1 East Cleveland, OH | 2.0 | 1.0 | 764 | $1,200 | $1.57 | 44d | 1 | 0.29mi |
| 14009 Mayfair Ave Unit 2 East Cleveland, OH | 4.0 | 2.0 | 1144 | $1,390 | $1.22 | 44d | 1 | 0.29mi |
| 14200 Scioto Ave Cleveland, OH | 3.0 | 1.0 | 1256 | $1,350 | $1.07 | 16d | 1 | 0.30mi |
| 12819 Edmonton Ave Cleveland, OH | 4.0 | 1.0 | 1423 | $1,795 | $1.26 | 16d | 1 | 0.33mi |
| 14312 Scioto Ave Cleveland, OH | 3.0 | 1.0 | 1090 | $1,300 | $1.19 | 4d | 1 | 0.35mi |
| 14835 Euclid Ave Cleveland, OH | 1.0–2.0 | 1.0 | 712 | $850 | $1.19 | 44d | 12 | 0.56mi |
| 14813 Alder Ave Cleveland, OH | 3.0 | 1.0 | 1188 | $1,150 | $0.97 | 24d | 1 | 0.65mi |
| 1801 Stanwood Rd Unit 13 East Cleveland, OH | 2.0 | 1.0 | 800 | $900 | $1.12 | 44d | 1 | 0.66mi |
| 15421 Plymouth Pl East Cleveland, OH | 2.0 | 1.0 | 950 | $972 | $1.02 | 44d | 1 | 0.67mi |
| 1726 Taylor Rd East Cleveland, OH | 2.0 | 1.0 | 900 | $972 | $1.08 | 44d | 1 | 0.70mi |
| 1867 N Taylor Rd Apt 309 Cleveland, OH | 2.0 | 1.0 | 850 | $700 | $0.82 | 44d | 1 | 0.91mi |
| 13605 Terrace Rd Unit RD-5 East Cleveland, OH | 2.0 | 1.0 | 700 | $850 | $1.21 | 44d | 1 | 1.05mi |
| 14120 Superior Ave Unit 4 East Cleveland, OH | 3.0 | 1.0 | 1408 | $1,350 | $0.96 | 44d | 1 | 1.05mi |
| 14120 Superior Ave Unit 1 East Cleveland, OH | 3.0 | 1.0 | 1400 | $1,350 | $0.96 | 10d | 1 | 1.05mi |
| 13540 Superior Rd Cleveland, OH | 1.0–2.0 | 1.0 | 655 | $850 | $1.30 | 16d | 2 | 1.08mi |
| 13420 Euclid Ave Unit 13444-214 East Cleveland, OH | 2.0 | 1.0 | 800 | $850 | $1.06 | 44d | 1 | 1.08mi |
| 13420 Euclid Ave Unit 1817-307 East Cleveland, OH | 2.0 | 1.0 | 800 | $850 | $1.06 | 24d | 1 | 1.08mi |
| 16000 Terrace Rd Cleveland, OH | 1.0–3.0 | 1.0–2.0 | 1000 | $1,210 | $1.21 | 2d | 39 | 1.15mi |
| 1338 Lakeview Rd Unit Down Cleveland, OH | 3.0 | 1.0 | 1000 | $1,900 | $1.90 | 24d | 1 | 1.29mi |
| 876 Eloise Dr Unit Upper Cleveland Heights, OH | 2.0 | 1.0 | 1233 | $1,200 | $0.97 | 16d | 1 | 1.36mi |
| 886 Helmsdale Rd Cleveland Heights, OH | 2.0 | 1.0 | 1037 | $995 | $0.96 | 16d | 1 | 1.45mi |
Listing history 15 events
-
2026-06-18days on market $99,900 Active 20 DOM
-
2026-06-17days on market $99,900 Active 19 DOM
-
2026-06-16days on market $99,900 Active 18 DOM
-
2026-06-15days on market $99,900 Active 17 DOM
-
2026-06-13days on market $99,900 Active 15 DOM
-
2026-06-13days on market $99,900 Active 14 DOM
-
2026-06-09days on market $99,900 Active 11 DOM
-
2026-06-08days on market $99,900 Active 10 DOM
-
2026-06-07days on market $99,900 Active 9 DOM
-
2026-06-05days on market $99,900 Active 6 DOM
-
2026-06-03days on market $99,900 Active 5 DOM
-
2026-06-02days on market $99,900 Active 4 DOM
-
2026-06-01days on market $99,900 Active 3 DOM
-
2026-05-31days on market $99,900 Active 2 DOM
-
2026-04-15$124,900 Active 1447-char remark
ⓘ Source: listings_history table (triggers on properties + properties_extension) + one-shot
backfill from property_details.listing_events for pre-trigger history.
Tax reassessment forecast OH · Partial reset (capped growth)
- Current annual tax
- $837 · $70/mo
- Projected year-2 tax
- $1,198 · $100/mo
- Expected delta
- +$361/yr (+$30/mo · 43.1%)
ⓘ Screening estimate from a state-policy table — verify with the county assessor before closing.
Climate risk First Street
- Flood 1/10 Low FEMA zone X (unshaded) · 0% chance over 30 yrs
- Wildfire 1/10 Low
- Heat 3/10 Moderate 7 d/yr ≥95°F today · 17 d/yr by 30 yrs out
- Wind 1/10 Low
- Air quality 3/10 Moderate 3 unhealthy d/yr today · 5 by 30 yrs out
Nearby sold comps map
Loading sold comps map…
Walkable amenities ~0.75 mi
Loading nearby amenities…
Taxation est. · year 1
- Rental income
- $14,401
- − Mortgage interest
- −$5,596
- − Property taxes
- −$837
- − Insurance
- −$500
- − Repairs & maintenance
- −$1,152
- − Management
- −$1,152
- − Depreciation
- −$2,906
- Taxable income
- $2,258
- Est. tax owed @ 24.0%
- −$542
- After-tax cash flow
- $3,212/yr
For passive investors: Depreciation is non-cash, so a rental often shows a tax loss while cash-flowing — sheltering income. Rental losses are passive: they offset passive income freely, and up to $25,000/yr can offset ordinary (W-2) income if you actively participate and your MAGI is under $100k (phasing out to $0 by $150k); unused losses carry forward. On sale, claimed depreciation is recaptured at up to 25%, and gains may owe capital-gains tax (a 1031 exchange can defer both). Figures are a year-1 estimate at your 24.0% rate — not tax advice; consult a CPA.
Schools (NCES district)
- District
- East Cleveland City School District
- NCES district ID
- 3904390
- Math proficiency
- 4% ▼ -16.00%
- Reading proficiency
- 17% ▼ -13.00%
- Median HH income
- $22,726
- Composite
- 7.38/100
- National rank
- #9954
- State rank
- #652 of 656 in OH
Livability — East Cleveland
- Score
- 66/100
- State rank
- #650
- US rank
- #11510
Category grades
Schools grade is shown separately in the Schools card above.
Census & demographics
- Census place
- East Cleveland, OH
- County
- Cuyahoga County · 1,090,369 people
- City population
- 17,848
- Metro
- Cleveland-Elyria, OH
- Population (ZIP)
- 17,848
- Household income
- $28,799
- Rent vs Own
- Severe rent burden
- 1702.0
Population outlook (Cuyahoga County) Hauer SSP2
- Today (2025)
- 1,244,621 people
- By 2030
- 1,230,093 · -1.2%
- By 2040
- 1,189,108 · -4.5%
- By 2050
- 1,145,706 · -7.9%
- By 2075
- 1,076,557 · -13.5%
- By 2100
- 978,987 · -21.3%
Race, ethnicity, and origin ACS 2023
- Neighborhood character
- Predominantly Black (89%)
- Race & ethnicity
- Black 89% White 7% Two or more races 2% Hispanic / Latino 1%
- Common ancestry
- Lithuanian 1%
- Foreign-born
- 4% · Canada
- Languages at home
- 93% English-only · French/Haitian/Cajun 3% Spanish 2% Russian/Polish/Slavic 1%
Political lean MEDSL · Cuyahoga
- 2024 margin
- Solid D (+31.5) · D 65.4% · R 33.9%
- 2008→2024 swing
- -7.4pp toward R · 2008: 38.9pp · 2024: 31.5pp
- All cycles
- 2024: D+31.5 2020: D+34.1 2016: D+35.0 2012: D+38.7 2008: D+38.9
Not yet ingested
- Civics
- —
Market trends
- HPI YoY
- ▼ -115.61%
- Current HPI
- 67.2162
- Rent YoY
- ▲ 5.16%
- Metro
- Cleveland-Elyria, OH
- State GDP YoY
- ▲ 1.98%
- F500 in state
- 48
Industry mix (Fortune 500 HQ in OH)
| Industry | F500 HQs | Revenue |
|---|---|---|
| Insurance | 3 | $145B |
|
||
| Industrial Machinery | 3 | $49B |
|
||
| Financial Services | 3 | $24B |
|
||
| Consumer Goods | 2 | $93B |
|
||
| Aerospace / Defense | 2 | $47B |
|
||
| Utilities | 2 | $33B |
|
||
Price history
-20.0% since first listed3 events — show timeline
- 2026-05-29 Listed $99,900 MLSNOW
- 2026-05-26 Listing Removed — MLSNOW
- 2026-04-15 Listed $124,900 MLSNOW
Property tax history
+11.9%/yrLatest (2025): $837 · +0.0% YoY. Source: county tax records.
Cash-flow waterfall
monthlySold comps — $/sqft
last 12 mo · ≤1 miLoading sold comps…