 Multi-family
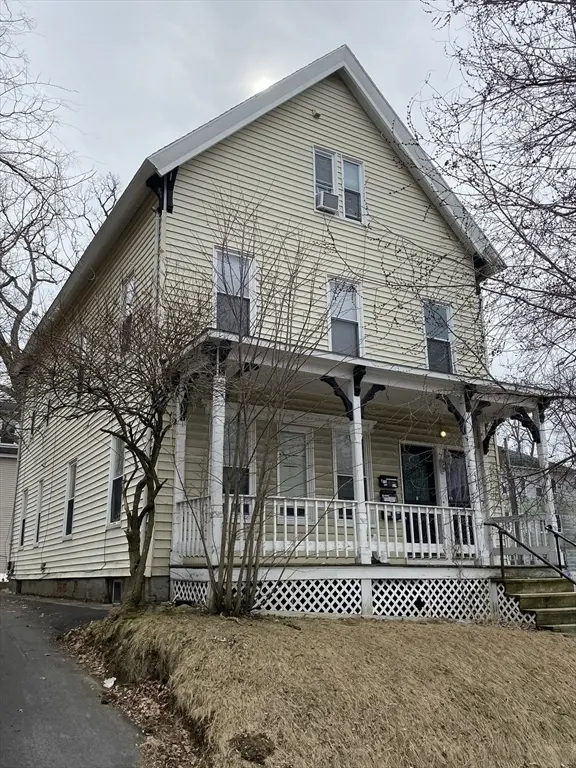
51 May St · Worcester, MA
Flood risk 1/10 · Minimal
- FEMA flood zone
- X (unshaded)
- Chance of flooding over 30 yrs
- 0.0%
- Est. flood insurance / yr
- $473 – $860
Fire risk 1/10 · Minimal
- Est. fire insurance / yr
- $915 – $1,699
Heat risk 4/10 · Minor
- Hot days now (above 93°F)
- 7 days/yr
- Hot days in 30 yrs
- 16 days/yr
Wind risk 6/10 · Moderate
- Chance of severe wind over 30 yrs
- 27.0%
Air-quality risk 2/10 · Minimal
- Unhealthy air days now
- 1 days/yr
- Unhealthy air days in 30 yrs
- 2 days/yr
Risk factors via First Street. Map © Google.
Why this score? — see what drove the C- grade
The composite is a weighted blend of 9 inputs, each scored 0–100. Each bar is that input's sub-score; the figure is the points it added to the 100-point composite (weight × sub-score).
- Cash flow +19.0/30.0
- ARV discount +6.8/15.0
- DSCR +6.0/10.0
- Appreciation +4.6/10.0
- 1% rule +4.4/10.0
- Livability +4.4/5.0
- Condition / age +2.5/5.0
- Schools +2.0/10.0
- Rent growth +1.9/5.0
$675,000
🖨 Deal sheet 📄 Offer letter ✓ Due diligence
Multi-family units
County records classify this as Multi-Family (2-4 Unit). Listing-text estimate: 1 unit. estimate disagrees with records
Listing remarks MLS
Price Improvement!!!!! Welcome to 51 May St in Worcester !This Multi-Family located in the Clark U area has a recent Roof & Heating Systems, All Separate Utilities for each apartment and Landlord Electric Meter. Expanded Parking was also recently added. Each unit is rented currently, with strong rental history and still room to increase to market rent on renewal. Fully Lead Compliant. All units have been updated and maintained. All Units have dedicated Laundry. Convenient location close to most major conveniences, Highway access, University, Train Station, Medical Center.
Key facts
- 6,006 sq ft lot
- 6 parking spots
- Built 1890
Neighborhood map
What this means for you Summary
Snapshot
- This is a 8-bed/3.0-bath multifamily listed at $675k.
Deal economics
- At list price, monthly cash flow is $706 ($8k/yr) — positive.
- The deal already cash-flows at list — no discount required.
- To meet the 1% rule (rent ≥ 1% of price), the offer needs to be $633k (6.2% below list).
- Recommended offer: $633k (6.2% below list) — sets the bar for 1% rule.
- Cap rate 7.5% vs local median 4.1% in Worcester — top-decile yield for the area; either an underpriced asset or a hidden risk that comps aren't pricing in. Stress-test before assuming the spread holds.
Location & tenants
- Location reads 87/100 on livability (#9 in MA, #312 nationally) — a professional / high-income tenant draw. Strengths: crime A+, amenities A+, commute A+; Watch: schools C-, cost of living D.
- Worcester (urban): math 17% / reading 30% proficiency, ranked #280 of 302 in MA (top 93%) — low school quality limits family demand, transient renter base, plan for 1-2y turnover; 66% free/reduced lunch — lower-income household profile, screen leases tightly.
- Market conditions: Rents soft (-2.2%/yr); 25 active listings in the ZIP; 2,293 units permitted in Worcester County in 2024 (1,205 in 5+ unit buildings).
- At $6,329/mo this rent would consume 148% of the median local household income ($51k/yr) (locally 2517% of renters already pay >50% of income on rent) — very limited rent-growth headroom before tenants either downsize or default.
Forward outlook
- Local home prices are declining (-0.7%/yr); year-one equity from $5k of loan paydown is wiped out by about $5k of value loss. Plan a longer hold.
Negotiation context
- It's been on market 84 days — a 6% lower offer ($634k) is reasonable based on typical stale-listing flexibility.
- 3 sale attempts since 18y ago; this cycle's ask has dropped $75k (10%) from the opening price — seller is motivated, your offer sets the floor, not the list.
- Current owner paid $235k; list at $675k implies a 187% gain — meaningful room to come down on a strong offer.
Risks & watch-outs
- Watch-outs: built in 1890 — expect roof / HVAC / electrical / plumbing capex.
- Climate carrying-cost: major wind risk, 27% chance of damaging wind over 30y — expect insurance premiums to compound above CPI over the hold.
Questions for the listing agent
- It's been on market 84 days. Have you received any prior offers? Is the seller open to a 6% concession, seller financing, or rate buy-down credit?
- Built in 1890 — when were the roof, HVAC, electrical panel, plumbing, and water heater last replaced?
- Why hasn't it sold? Are there any deal-killer items the seller is aware of (foundation, flood, title, zoning, code violations)?
- Is there a deadline driving the sale (1031 exchange, divorce, estate, relocation)? That informs how much negotiation room exists.
- What's the average days-on-market for RENTAL listings here right now (not sales)? A rising rental-DOM trend means longer vacancies and softer asking-rent achievability than the comps imply.
- What's the recent tenant-quality profile in this submarket — average credit score on applications, eviction rate, late-payment / NSF rate, and stable-employment percentage? A property-management company in the area should have these aggregated.
- How much new apartment / multifamily construction is in the pipeline within 1–3 miles? Heavy new supply (>2% of stock underway) typically softens rents 12–24 months out; light construction supports rent growth.
Investment metrics
- 1% rule
- 0.94% ✗
- Cap rate
- 7.55%
- Cash-on-cash
- 4.48%
- DSCR
- 1.20
- GRM
- 8.9
CMA / ARV
- ARV (median comp)
- $664,836
- List price
- $675,000
- Delta
- 1.53%
- Verdict
- FAIR
- Comps
- 20 within 1.0 mi
Show comp detail 7 sales within ~0.75 mi
| Address | Dist | Beds/Ba | Sqft | Sold | Price | $/sf | Match |
|---|---|---|---|---|---|---|---|
| 7 Clifton St | 0.04mi | 8/2.0 | 3,056 (+0%) | 21mo | $561,000 | $184 | 76 |
| 38 Clifton St | 0.19mi | 8/3.0 | 2,727 (-11%) | 8mo | $725,000 | $266 | 67 |
| 47 Piedmont St | 0.45mi | 8/3.0 | 2,912 (-4%) | 7mo | $640,000 | $220 | 66 |
| 183 Lovell St | 0.60mi | 8/3.0 | 3,451 (+13%) | 8mo | $620,000 | $180 | 44 |
| 27 Richards St | 0.68mi | 8/3.0 | 2,682 (-12%) | 12mo | $660,000 | $246 | 38 |
| 84-86 Florence St | 0.52mi | 9/3.0 (+1) | 3,453 (+13%) | 17mo | $1,350,000 | $391 | 35 |
| 10 Sycamore St | 0.75mi | 8/3.0 | 3,490 (+14%) | 9mo | $840,000 | $241 | 34 |
Match score weights: distance 35% · size 25% · config 20% · recency 20%. Top-matched comps best support the ARV.
Projected returns pro-forma
-0.73% appreciation · 0.0% rent growth · sell at horizon
- IRR
- -2.0%
- Equity multiple
- 0.91×
- Total profit
- $-16,167
- Equity at exit
- $171,840
- IRR
- 2.1%
- Equity multiple
- 1.19×
- Total profit
- $35,331
- Equity at exit
- $188,147
Cash invested: $189,000 (down + closing). Projections, not guarantees.
Landlord ↔ Tenant lean methodology
- Overall (STATE)
- 20 Strongly Tenant-Friendly
- State Massachusetts
- 20 Strongly Tenant-Friendly · D+15
- County
- — inherits STATE
- City
- — inherits STATE
ZIP-level market 01610
- Home prices YoY
- -0.1%
- Rents YoY
- -2.2%
- Active inventory
- 25
- Price-to-rent
- 26.7×
Monthly cashflow live
- Estimated rent
- $6,329 high interval (Pro) →
- Mortgage (P&I)
- −$3,540
- Tax from tax record
- −$473 /mo · $5,674/yr
- Insurance
- −$281
- HOA
- −$0
- Vacancy / Maint / Mgmt
- −$1,329
- Net cashflow
- $706
Break-even live
3-unit breakdown (identical units grouped — click to expand)
| Units | Beds | Baths | Est. rent |
|---|---|---|---|
| 3× units | 2 | 1 | $6,330 |
| #1 | 2 | 1 | $2,110 |
| #2 | 2 | 1 | $2,110 |
| #3 | 2 | 1 | $2,110 |
| Total (3 units) | $6,329 | ||
UW: 25.0% down · 7.5% · 30yr · 1.5% tax · 5.0% vac · 8.0% maint · 8.0% mgmt
Financing live
Cash to close
- Down payment
- $168,750
- Closing costs
- $20,250
- Reserves months
- —
- Total cash needed
- —
Loan-product check · same deal, 3 products live
Conventional
25% down · 7.5% · 30yr
- Down + closing
- —
- Monthly P&I
- —
- Monthly cashflow
- —
- DSCR
- —
- Eligible?
- —
Personal DTI + credit; lowest rate.
DSCR
20% down · 8.5% · 30yr
- Down + closing
- —
- Monthly P&I
- —
- Monthly cashflow
- —
- DSCR
- —
- Eligible?
- —
No personal income docs; deal must DSCR.
Hard money
10% down · 12.0% · 12mo
- Down + closing
- —
- Monthly P&I
- —
- Monthly cashflow
- —
- DSCR
- —
- Eligible?
- —
Short-term bridge; refi at stabilization.
Listing history 28 events
-
2026-06-18days on market $675,000 Active 84 DOM
-
2026-06-17days on market $675,000 Active 83 DOM
-
2026-06-16statusdays on market $675,000 Active 82 DOM
-
2026-06-15days on market $675,000 Back On Market 81 DOM
-
2026-06-14statusdays on market $675,000 Back On Market 79 DOM
-
2026-06-10days on market $675,000 Contingent 76 DOM
-
2026-06-09days on market $675,000 Contingent 75 DOM
-
2026-06-08days on market $675,000 Contingent 74 DOM
-
2026-06-07days on market $675,000 Contingent 73 DOM
-
2026-06-05statusdays on market $675,000 Contingent 70 DOM
-
2026-06-03days on market $675,000 Active 69 DOM
-
2026-06-02days on market $675,000 Active 68 DOM
-
2026-06-01days on market $675,000 Active 67 DOM
-
2026-05-31days on market $675,000 Active 66 DOM
-
2026-05-31days on market $675,000 Active 65 DOM
-
2026-04-01price $699,990 583-char remark
Show marketing remark (583 chars)
Price Improvement!!!!! Welcome to 51 May St in Worcester !This Multi-Family located in the Clark U area has a recent Roof & Heating Systems, All Separate Utilities for each apartment and Landlord Electric Meter. Expanded Parking was also recently added. Each unit is rented currently, with strong rental history and still room to increase to market rent on renewal. Fully Lead Compliant. All units have been updated and maintained. All Units have dedicated Laundry. Convenient location close to most major conveniences, Highway access, University, Train Station, Medical Center.
-
2026-03-26$750,000 New 583-char remark
Show marketing remark (583 chars)
Price Improvement!!!!! Welcome to 51 May St in Worcester !This Multi-Family located in the Clark U area has a recent Roof & Heating Systems, All Separate Utilities for each apartment and Landlord Electric Meter. Expanded Parking was also recently added. Each unit is rented currently, with strong rental history and still room to increase to market rent on renewal. Fully Lead Compliant. All units have been updated and maintained. All Units have dedicated Laundry. Convenient location close to most major conveniences, Highway access, University, Train Station, Medical Center.
-
2017-04-14soldstatus $235,000 Sold 301-char remark
Show marketing remark (301 chars)
Spacious three family property located in the Clark University area and close to restaurants and shops. This is a great income producing property and all three units are currently rented. Vinyl sided for easy maintenance. Off street parking for three cars. Great investment property or owner occupied!
-
2017-03-04status Under Agreement 301-char remark
Show marketing remark (301 chars)
Spacious three family property located in the Clark University area and close to restaurants and shops. This is a great income producing property and all three units are currently rented. Vinyl sided for easy maintenance. Off street parking for three cars. Great investment property or owner occupied!
-
2017-02-14$259,900 New 301-char remark
Show marketing remark (301 chars)
Spacious three family property located in the Clark University area and close to restaurants and shops. This is a great income producing property and all three units are currently rented. Vinyl sided for easy maintenance. Off street parking for three cars. Great investment property or owner occupied!
-
2009-08-24soldstatus $170,000
-
2009-08-21soldstatus $170,000 Sold
-
2009-01-22price $175,000
-
2008-12-29price $179,900
-
2008-12-05price $189,900
-
2008-11-21price $193,000
-
2008-07-23$198,500
-
2001-07-27soldstatus $77,000
ⓘ Source: listings_history table (triggers on properties + properties_extension) + one-shot
backfill from property_details.listing_events for pre-trigger history.
Tax reassessment forecast MA · Partial reset (capped growth)
- Current annual tax
- $5,674 · $473/mo
- Projected year-2 tax
- $6,988 · $582/mo
- Expected delta
- +$1,314/yr (+$110/mo · 23.2%)
ⓘ Screening estimate from a state-policy table — verify with the county assessor before closing.
Climate risk First Street
- Flood 1/10 Low FEMA zone X (unshaded) · 0% chance over 30 yrs
- Wildfire 1/10 Low
- Heat 4/10 Moderate 7 d/yr ≥93°F today · 16 d/yr by 30 yrs out
- Wind 6/10 Major 27% chance of damaging wind over 30 yrs
- Air quality 2/10 Low 1 unhealthy d/yr today · 2 by 30 yrs out
Nearby sold comps map
Loading sold comps map…
Walkable amenities ~0.75 mi
Loading nearby amenities…
Taxation est. · year 1
- Rental income
- $75,948
- − Mortgage interest
- −$37,810
- − Property taxes
- −$5,674
- − Insurance
- −$3,375
- − Repairs & maintenance
- −$6,076
- − Management
- −$6,076
- − Depreciation
- −$19,636
- Taxable loss
- −$2,700
- Est. tax savings @ 24.0%
- +$648
- After-tax cash flow
- $9,121/yr
For passive investors: Depreciation is non-cash, so a rental often shows a tax loss while cash-flowing — sheltering income. Rental losses are passive: they offset passive income freely, and up to $25,000/yr can offset ordinary (W-2) income if you actively participate and your MAGI is under $100k (phasing out to $0 by $150k); unused losses carry forward. On sale, claimed depreciation is recaptured at up to 25%, and gains may owe capital-gains tax (a 1031 exchange can defer both). Figures are a year-1 estimate at your 24.0% rate — not tax advice; consult a CPA.
Schools (NCES district)
- District
- Worcester
- NCES district ID
- 2513230
- Math proficiency
- 17% ▼ -15.00%
- Reading proficiency
- 30% ▼ -8.00%
- Median HH income
- $45,063
- Composite
- 20.3/100
- National rank
- #8615
- State rank
- #280 of 302 in MA
Livability — Worcester
- Score
- 87/100
- State rank
- #9
- US rank
- #312
Category grades
Schools grade is shown separately in the Schools card above.
Census & demographics
- Census place
- Worcester, MA
- County
- Worcester County · 487,911 people
- City population
- 207,324
- Metro
- Worcester, MA-CT
- Population (ZIP)
- 30,444
- Household income
- $51,472
- Rent vs Own
- Severe rent burden
- 2517.0
Population outlook (Worcester County) Hauer SSP2
- Today (2025)
- 850,858 people
- By 2030
- 860,403 · +1.1%
- By 2040
- 869,902 · +2.2%
- By 2050
- 869,110 · +2.1%
- By 2075
- 870,120 · +2.3%
- By 2100
- 829,703 · -2.5%
Race, ethnicity, and origin ACS 2023
- Neighborhood character
- Diverse neighborhood (Simpson 0.69)
- Race & ethnicity
- Hispanic / Latino 42% White 34% Two or more races 21% Black 13% Asian 6%
- Hispanic origin (detail)
- Mexican 1% Puerto Rican 21% Dominican 8%
- Common ancestry
- Romanian 4% Lithuanian 3% Hispanic 2%
- Foreign-born
- 27% · Canada, Vietnam, China
- Languages at home
- 48% English-only · Spanish 35% Other Indo-European 4% Vietnamese 2%
Political lean MEDSL · Worcester
- 2024 margin
- D (+10.0) · D 53.9% · R 43.9% · Other 2.2%
- 2008→2024 swing
- -3.8pp toward R · 2008: 13.8pp · 2024: 10.0pp
- All cycles
- 2024: D+10.0 2020: D+17.8 2016: D+10.5 2012: D+9.2 2008: D+13.8
Not yet ingested
- Civics
- —
Market trends
- HPI YoY
- ▼ -0.73%
- Current HPI
- 485.4378
- Rent YoY
- ▼ -2.22%
- Metro
- Worcester, MA-CT
- State GDP YoY
- ▲ 2.28%
- F500 in state
- 38
Industry mix (Fortune 500 HQ in MA)
| Industry | F500 HQs | Revenue |
|---|---|---|
| Technology | 3 | $17B |
|
||
| Insurance | 2 | $84B |
|
||
| Retail | 2 | $76B |
|
||
| Life Sciences | 1 | $43B |
|
||
| Energy Technology | 1 | $31B |
|
||
| Aerospace / Defense | 1 | $18B |
|
||
Price history
+809.1% since first listed13 events — show timeline
- 2026-04-01 Price Changed $699,990 MLS PIN
- 2026-03-26 Listed $750,000 MLS PIN
- 2017-04-14 Sold (MLS) $235,000 MLS PIN
- 2017-03-04 Pending — MLS PIN
- 2017-02-14 Listed $259,900 MLS PIN
- 2009-08-24 Sold (Public Records) $170,000 Public Records
- 2009-08-21 Sold (MLS) $170,000 MLS PIN
- 2009-01-22 Price Changed $175,000 MLS PIN
- 2008-12-29 Price Changed $179,900 MLS PIN
- 2008-12-05 Price Changed $189,900 MLS PIN
- 2008-11-21 Price Changed $193,000 MLS PIN
- 2008-07-23 Listed $198,500 MLS PIN
- 2001-07-27 Sold (Public Records) $77,000 Public Records
Property tax history
+6.1%/yrLatest (2023): $5,674 · +11.4% YoY. Source: county tax records.
Cash-flow waterfall
monthlySold comps — $/sqft
last 12 mo · ≤1 miLoading sold comps…