 Duplex
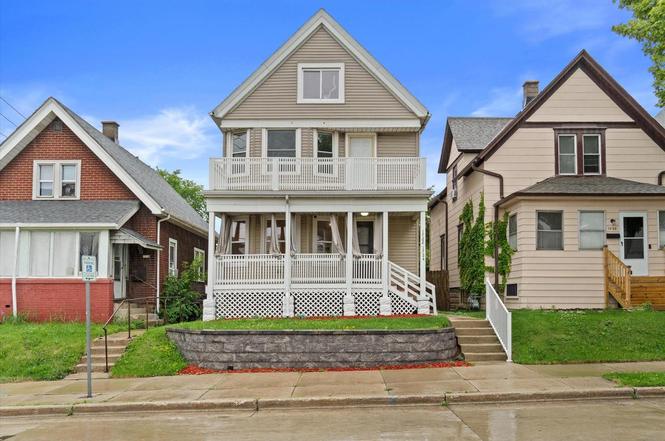
1722 S 66th St #1724 · West Allis, WI
Flood risk 1/10 · Minimal
- FEMA flood zone
- X (unshaded)
- Chance of flooding over 30 yrs
- 0.0%
- Est. flood insurance / yr
- $473 – $860
Fire risk 1/10 · Minimal
- Est. fire insurance / yr
- $636 – $1,182
Heat risk 2/10 · Minimal
- Hot days now (above 99°F)
- 7 days/yr
- Hot days in 30 yrs
- 13 days/yr
Wind risk 2/10 · Minimal
- Chance of severe wind over 30 yrs
- —
Air-quality risk 2/10 · Minimal
- Unhealthy air days now
- 1 days/yr
- Unhealthy air days in 30 yrs
- 1 days/yr
Risk factors via First Street. Map © Google.
Why this score? — see what drove the D grade
The composite is a weighted blend of 9 inputs, each scored 0–100. Each bar is that input's sub-score; the figure is the points it added to the 100-point composite (weight × sub-score).
- Cash flow +15.0/30.0
- ARV discount +7.5/15.0
- DSCR +4.6/10.0
- Rent growth +4.6/5.0
- 1% rule +4.1/10.0
- Livability +4.0/5.0
- Condition / age +2.5/5.0
- Schools +1.9/10.0
- Appreciation +0.0/10.0
$325,000
🖨 Deal sheet (PDF) 📄 Offer letter ✓ Due diligence
Multi-family units
County records classify this as Multi-Family (2-4 Unit). Listing-text estimate: 2 units. confirmed
Listing remarks MLS
Opportunity for an investor or owner occupant. This 2 bedroom, 1 bath duplex has a fully rentable 3rd floor, 1 bedroom, 1 bath apartment with independent access. It shares utilities with the 2nd floor. This property is one block from the new Redeveloping Six Points Farmers Market Neighborhood, with plans for new retail shops, offices and residential condos and lofts. Includes newer roof, windows, vinyl siding, trim and porches. This one won't last long!
Key facts
- Vinyl windows
- Two sets of laundry
- Independent access
Tags
Neighborhood map
What this means for you Summary
Snapshot
- This is a 2 × 2-bed/?-bath units multifamily listed at $325k.
Deal economics
- At list price, monthly cash flow is $103 ($1k/yr) — positive. Per door: $51/mo.
- The deal already cash-flows at list — no discount required.
- To meet the 1% rule (rent ≥ 1% of price), the offer needs to be $297k (8.5% below list).
- Recommended offer: $297k (8.5% below list) — sets the bar for 1% rule.
- Cap rate 6.7% vs local median 4.3% in West Allis — top-decile yield for the area; either an underpriced asset or a hidden risk that comps aren't pricing in. Stress-test before assuming the spread holds.
Location & tenants
- Location reads 79/100 on livability (#69 in WI, #1,958 nationally) — a middle-class / working-renter tenant base. Strengths: commute A+, cost of living A+, housing A+; Watch: amenities F.
- West Allis-West Milwaukee School District (urban): math 17% / reading 26% proficiency, ranked #328 of 342 in WI (top 96%) — low school quality limits family demand, transient renter base, plan for 1-2y turnover.
- Zoned schools: Horace Mann Elementary (math 12% / reading 12%, grade F, #928 of 1,041 statewide, top 90%, 398 students, 82% FRL); West Milwaukee Intermediate (math 11% / reading 21%, grade F, #365 of 383 statewide, top 95%, 304 students, 79% FRL); Central High (math 8% / reading 14%, grade F, #438 of 483 statewide, top 91%, 1,007 students, 68% FRL) — zoned schools average 76% FRL vs 48% district-wide (28 pts higher); higher-poverty schools than district average — tighter screening recommended.
- Market conditions: Rents rising fast (+8.3%/yr); 52 active listings in the ZIP; 40 comparable units currently listed for rent nearby; rentals at typical pace (median 18d on market — plan ~3-4 weeks tenant-placement turnaround); 1,017 units permitted in Milwaukee County in 2024 (803 in 5+ unit buildings).
- At $2,973/mo this rent would consume 59% of the median local household income ($61k/yr) (locally 1377% of renters already pay >50% of income on rent) — very limited rent-growth headroom before tenants either downsize or default.
Forward outlook
- Local home prices are declining (-3.0%/yr); year-one equity from $2k of loan paydown is wiped out by about $10k of value loss. Plan a longer hold.
- Milwaukee County population projected at +4% by 2050 — modest demand growth; plan on rents tracking national, not racing it.
Negotiation context
- Only 2 days on market — expect competitive offers; lowballing is unlikely to land.
- 2 sale attempts since 14y ago; this cycle's ask is 36% above the opening price — seller raised mid-cycle; expect resistance to lowballs.
- Current owner paid $260k; 25% above their basis — modest negotiation headroom, anchor on the comps not their cost.
Risks & watch-outs
- Watch-outs: built in 1910 — expect roof / HVAC / electrical / plumbing capex.
Questions for the listing agent
- Can we see the unit-by-unit rent roll, current vacancy, and any below-market leases? What's the average tenancy length?
- What capital expenditures (roof, boiler, parking lot, exteriors) have been made in the last 5 years, and what's planned in the next 2?
- Built in 1910 — when were the roof, HVAC, electrical panel, plumbing, and water heater last replaced?
- Is there a deadline driving the sale (1031 exchange, divorce, estate, relocation)? That informs how much negotiation room exists.
- The area grade is low — what's the realistic commute time and amenity access for the typical tenant pool here? Any planned neighborhood developments (good or bad) we should know about?
- What's the average days-on-market for RENTAL listings here right now (not sales)? A rising rental-DOM trend means longer vacancies and softer asking-rent achievability than the comps imply.
- What's the recent tenant-quality profile in this submarket — average credit score on applications, eviction rate, late-payment / NSF rate, and stable-employment percentage? A property-management company in the area should have these aggregated.
- How much new apartment / multifamily construction is in the pipeline within 1–3 miles? Heavy new supply (>2% of stock underway) typically softens rents 12–24 months out; light construction supports rent growth.
Investment metrics
- 1% rule
- 0.91% ✗
- Cap rate
- 6.67%
- Cash-on-cash
- 1.35%
- DSCR
- 1.06
- GRM
- 9.1
CMA / ARV
No comps found within radius.
Show comp detail 12 sales within ~0.75 mi
| Address | Dist | Beds/Ba | Sqft | Sold | Price | $/sf | Match |
|---|---|---|---|---|---|---|---|
| 6205 W Mitchell St #6207 | 0.20mi | 6/2.0 | 1,846 | 2mo | $230,000 | $125 | 77 |
| 6410 W National Ave | 0.30mi | —/— | 3,000 | 0mo | $370,000 | $123 | 73 |
| 5912 W Beloit Rd #5914 | 0.41mi | 5/2.0 | 1,932 | 2mo | $230,000 | $119 | 67 |
| 2069 S 71st St #2071 | 0.52mi | 4/2.0 | 1,726 | 0mo | $304,000 | $176 | 63 |
| 7007 W Becher St | 0.51mi | —/— | — | 1mo | $820,000 | — | 63 |
| 2217 S 67th Pl #2219 | 0.54mi | 3/2.0 | 1,865 | 2mo | $225,000 | $121 | 61 |
| 1602 S 75th St #1604 | 0.59mi | 4/2.5 | 1,675 | 1mo | $308,500 | $184 | 59 |
| 2219 S 70th St #2221 | 0.61mi | 3/2.0 | 1,224 | 1mo | $250,000 | $204 | 58 |
| 1417 S 56th St #1419 | 0.65mi | 6/2.0 | 2,058 | 1mo | $364,000 | $177 | 56 |
| 2222 S 72nd St | 0.68mi | 3/2.0 | 1,577 | 1mo | $296,000 | $188 | 55 |
| 2231 S 58th St #2233 | 0.69mi | 3/2.0 | 1,359 | 0mo | $285,000 | $210 | 55 |
| 1332 S 57th St | 0.68mi | 4/2.0 | 1,524 | 2mo | $210,000 | $138 | 55 |
Match score weights: distance 35% · size 25% · config 20% · recency 20%. Top-matched comps best support the ARV.
Projected returns pro-forma
-3.0% appreciation · 8.0% rent growth · sell at horizon
- IRR
- -8.7%
- Equity multiple
- 0.67×
- Total profit
- $-30,368
- Equity at exit
- $48,459
- IRR
- 6.4%
- Equity multiple
- 1.59×
- Total profit
- $53,668
- Equity at exit
- $28,100
Cash invested: $91,000 (down + closing). Projections, not guarantees.
Landlord ↔ Tenant lean methodology
- Overall (STATE)
- 73 Landlord-Friendly
- State Wisconsin
- 73 Landlord-Friendly · R+2
- County
- — inherits STATE
- City
- — inherits STATE
ZIP-level market 53214
- Home prices YoY
- -28.9%
- Rents YoY
- 8.3%
- Active inventory
- 52
- Price-to-rent
- 18.2×
Monthly cashflow live
- Estimated rent
- $2,973 high interval (Pro) →
- Mortgage (P&I)
- −$1,704
- Tax est. 1.5%
- −$406 /mo · $4,875/yr
- Insurance
- −$135
- HOA
- −$0
- Vacancy / Maint / Mgmt
- −$624
- Net cashflow
- $103
Break-even live
Sensitivity live
| Price | -10% $327 | -5% $215 | +0% $103 | +5% $-10 | +10% $-122 |
|---|---|---|---|---|---|
| Rent | -10% $-132 | -5% $-15 | +0% $103 | +5% $220 | +10% $338 |
| Rate | -1.0pp $266 | -0.5pp $185 | base $103 | +0.5pp $18 | +1.0pp $-67 |
2-unit breakdown (identical units grouped — click to expand)
| Units | Beds | Baths | Est. rent |
|---|---|---|---|
| 2× units | 2 | — | $2,974 |
| #1 | 2 | — | $1,487 |
| #2 | 2 | — | $1,487 |
| Total (2 units) | $2,973 | ||
UW: 25.0% down · 7.5% · 30yr · 1.5% tax · 5.0% vac · 8.0% maint · 8.0% mgmt
Financing live
Cash to close
- Down payment
- $81,250
- Closing costs
- $9,750
- Reserves months
- —
- Total cash needed
- —
Loan-product check · same deal, 3 products live
Conventional
25% down · 7.5% · 30yr
- Down + closing
- —
- Monthly P&I
- —
- Monthly cashflow
- —
- DSCR
- —
- Eligible?
- —
Personal DTI + credit; lowest rate.
DSCR
20% down · 8.5% · 30yr
- Down + closing
- —
- Monthly P&I
- —
- Monthly cashflow
- —
- DSCR
- —
- Eligible?
- —
No personal income docs; deal must DSCR.
Hard money
10% down · 12.0% · 12mo
- Down + closing
- —
- Monthly P&I
- —
- Monthly cashflow
- —
- DSCR
- —
- Eligible?
- —
Short-term bridge; refi at stabilization.
Rent comps 40 comps
| Address | Beds | Baths | Sqft | Rent | $/sqft | DOM | Units | Dist |
|---|---|---|---|---|---|---|---|---|
| 6516 W National Ave Unit 1460-102 West Allis, WI | 2.0 | 2.0 | 1143 | $1,775 | $1.55 | 5d | 1 | 0.23mi |
| 6516 W National Ave Unit 6501-212 West Allis, WI | 2.0 | 2.0 | 1204 | $1,945 | $1.62 | 25d | 1 | 0.23mi |
| 6516 W National Ave Unit 1441-309 West Allis, WI | 2.0 | 2.0 | 1150 | $1,575 | $1.37 | 23d | 1 | 0.23mi |
| 6516 W National Ave Unit 6501-310 West Allis, WI | 2.0 | 2.0 | 1289 | $1,995 | $1.55 | 25d | 1 | 0.23mi |
| 6516 W National Ave Unit 1460-105 West Allis, WI | 1.0 | 1.0 | 675 | $1,495 | $2.21 | 5d | 1 | 0.23mi |
| 6516 W National Ave Unit 1441-114 West Allis, WI | 1.0 | 1.0 | 675 | $1,425 | $2.11 | 5d | 1 | 0.23mi |
| 6516 W National Ave Unit 1430-107 West Allis, WI | 1.0 | 1.0 | 880 | $1,610 | $1.83 | 14d | 1 | 0.23mi |
| 6516 W National Ave Unit 1460-104 West Allis, WI | 1.0 | 1.0 | 880 | $1,610 | $1.83 | 25d | 1 | 0.23mi |
| 6516 W National Ave Unit 6501-209 West Allis, WI | 2.0 | 2.0 | 1150 | $1,695 | $1.47 | 5d | 1 | 0.23mi |
| 6516 W National Ave Unit 6519-101 West Allis, WI | 2.0 | 2.0 | 1204 | $1,945 | $1.62 | 18d | 1 | 0.23mi |
| 6516 W National Ave Unit 1441-105 West Allis, WI | 2.0 | 2.0 | 1143 | $1,745 | $1.53 | 25d | 1 | 0.23mi |
| 6516 W National Ave Unit 1460-110 West Allis, WI | 2.0 | 1.0 | 1080 | $1,815 | $1.68 | 18d | 1 | 0.23mi |
| 6516 W National Ave Unit 1460-205 West Allis, WI | 1.0 | 1.0 | 823 | $1,525 | $1.85 | 14d | 1 | 0.23mi |
| 6901 W Mitchell St Unit 6903 West Allis, WI | 2.0 | 1.0 | 800 | $945 | $1.18 | 5d | 1 | 0.27mi |
| 6901 W Mitchell St Unit 6903 West Allis, WI | 2.0 | 1.0 | 800 | $1,150 | $1.44 | 25d | 1 | 0.27mi |
| 1924 S 69th St Unit My West Allis, WI | 2.0 | 1.0 | — | $1,395 | — | 5d | 1 | 0.31mi |
| 6400 W Greenfield Ave West Allis, WI | 2.0 | 1.0 | 950 | $2,148 | $2.26 | 0d | 3 | 0.35mi |
| 1732 S 71st St Unit 1732 West Allis, WI | 3.0 | 1.0 | 912 | $1,795 | $1.97 | 14d | 1 | 0.37mi |
| 1444 S 70th St West Allis, WI | 1.0 | 1.0 | 800 | $979 | $1.22 | 18d | 3 | 0.39mi |
| 1336 S 63rd St #1338 West Allis, WI | 1.0 | 1.0 | 800 | $950 | $1.19 | 25d | 1 | 0.41mi |
| 1301 S 63rd St Uppr -6307 West Allis, WI | 3.0 | 1.0 | 1150 | $1,650 | $1.43 | 25d | 1 | 0.45mi |
| 6521 Beloit Rd Apt 4 West Allis, WI | 1.0 | 1.0 | 800 | $935 | $1.17 | 5d | 1 | 0.52mi |
| 7007 W Becher St West Allis, WI | 1.0 | 1.0 | 800 | $975 | $1.22 | 25d | 1 | 0.53mi |
| 1109 S 64th St Milwaukee, WI | 2.0 | 1.0 | — | $1,250 | — | 25d | 1 | 0.54mi |
| 1624 S 75th St West Allis, WI | 1.0 | 1.0 | — | $875 | — | 16d | 1 | 0.60mi |
| 7205 W Becher St Unit 7205-06 West Allis, WI | 1.0 | 1.0 | — | $900 | — | 19d | 1 | 0.60mi |
| 7205 W Becher St Unit 7205-05 West Allis, WI | 1.0 | 1.0 | — | $900 | — | 5d | 1 | 0.60mi |
| 6406 W Lincoln Ave Unit 32 West Allis, WI | 1.0 | 1.0 | 850 | $920 | $1.08 | 5d | 1 | 0.62mi |
| 1553 S 75th St Unit 1553 West Allis, WI | 2.0 | 1.0 | 1008 | $1,595 | $1.58 | 5d | 1 | 0.64mi |
| 1673 S 54th St Milwaukee, WI | 2.0 | 1.0 | 750 | $1,250 | $1.67 | 25d | 1 | 0.68mi |
| 7500 W Greenfield Ave Unit 7504 Upper West Allis, WI | 2.0 | 1.0 | 844 | $1,250 | $1.48 | 25d | 1 | 0.70mi |
| 1414 S 55th St Unit 4 West Milwaukee, WI | 2.0 | 1.0 | 800 | $995 | $1.24 | 14d | 1 | 0.72mi |
| 5501 W National Ave Unit 240 Milwaukee, WI | 1.0 | 1.0 | — | $995 | — | 18d | 1 | 0.78mi |
| 5501 W National Ave Unit 109 Milwaukee, WI | 2.0 | 1.0 | — | $1,295 | — | 18d | 1 | 0.78mi |
| 5501 W National Ave West Milwaukee, WI | 2.0 | 1.0 | — | $1,295 | — | 18d | 13 | 0.79mi |
| 1333 S 53rd St West Milwaukee, WI | 1.0 | 1.0 | — | $850 | — | 25d | 1 | 0.82mi |
| 1467 S 78th St Milwaukee, WI | 2.0 | 1.0 | 1000 | $1,500 | $1.50 | 14d | 1 | 0.83mi |
| 5832 W Walker St Milwaukee, WI | 3.0 | 1.0 | 981 | $1,300 | $1.33 | 25d | 1 | 0.84mi |
| 642 S 66th St Milwaukee, WI | 3.0 | 1.0 | 1059 | $1,770 | $1.67 | 19d | 1 | 0.90mi |
| 638 S 66th St Milwaukee, WI | 3.0 | 1.0 | 1104 | $1,795 | $1.63 | 16d | 1 | 0.91mi |
Listing history 3 events
-
2026-06-21statusdays on market $325,000 Active 2 DOM
-
2026-06-19remarks 699-char remark
-
2026-06-19$325,000 Coming Soon 1 DOM
ⓘ Source: listings_history table (triggers on properties + properties_extension) + one-shot
backfill from property_details.listing_events for pre-trigger history.
Climate risk First Street
- Flood 1/10 Low FEMA zone X (unshaded) · 0% chance over 30 yrs
- Wildfire 1/10 Low
- Heat 2/10 Low 7 d/yr ≥99°F today · 13 d/yr by 30 yrs out
- Wind 2/10 Low
- Air quality 2/10 Low 1 unhealthy d/yr today · 1 by 30 yrs out
Nearby sold comps map
Loading sold comps map…
Walkable amenities ~0.75 mi
Loading nearby amenities…
Taxation est. · year 1
- Rental income
- $35,676
- − Mortgage interest
- −$18,205
- − Property taxes
- −$4,875
- − Insurance
- −$1,625
- − Repairs & maintenance
- −$2,854
- − Management
- −$2,854
- − Depreciation
- −$9,455
- Taxable loss
- −$4,192
- Est. tax savings @ 24.0%
- +$1,006
- After-tax cash flow
- $2,238/yr
For passive investors: Depreciation is non-cash, so a rental often shows a tax loss while cash-flowing — sheltering income. Rental losses are passive: they offset passive income freely, and up to $25,000/yr can offset ordinary (W-2) income if you actively participate and your MAGI is under $100k (phasing out to $0 by $150k); unused losses carry forward. On sale, claimed depreciation is recaptured at up to 25%, and gains may owe capital-gains tax (a 1031 exchange can defer both). Figures are a year-1 estimate at your 24.0% rate — not tax advice; consult a CPA.
Schools (NCES district)
- District
- West Allis-West Milwaukee School District
- NCES district ID
- 5516260
- Math proficiency
- 17% ▼ -16.00%
- Reading proficiency
- 26% ▼ -12.00%
- Median HH income
- $45,620
- Composite
- 18.71/100
- National rank
- #8881
- State rank
- #328 of 342 in WI
Livability — West Allis
- Score
- 79/100
- State rank
- #69
- US rank
- #1958
Category grades
Schools grade is shown separately in the Schools card above.
Census & demographics
- Census place
- West Allis, WI
- County
- Milwaukee County · 926,379 people
- City population
- 57,365
- Metro
- Milwaukee-Waukesha, WI
- Population (ZIP)
- 34,480
- Household income
- $60,962
- Rent vs Own
- Severe rent burden
- 1377.0
Population outlook (Milwaukee County) Hauer SSP2
- Today (2025)
- 995,758 people
- By 2030
- 1,009,124 · +1.3%
- By 2040
- 1,028,128 · +3.3%
- By 2050
- 1,040,066 · +4.4%
- By 2075
- 1,057,849 · +6.2%
- By 2100
- 1,039,774 · +4.4%
Race, ethnicity, and origin ACS 2023
- Neighborhood character
- Predominantly White (66%)
- Race & ethnicity
- White 66% Hispanic / Latino 18% Two or more races 12% Black 7% Asian 3%
- Hispanic origin (detail)
- Mexican 12% Puerto Rican 4%
- Common ancestry
- Romanian 11% Lithuanian 3% Portuguese 2%
- Foreign-born
- 7% · Canada, China, Philippines
- Languages at home
- 86% English-only · Spanish 10% Other Asian/Pacific 1% Russian/Polish/Slavic 1%
Political lean MEDSL · Milwaukee
- 2024 margin
- Solid D (+38.5) · D 68.3% · R 29.8% · Other 1.8%
- 2008→2024 swing
- +2.7pp toward D · 2008: 35.9pp · 2024: 38.5pp
- All cycles
- 2024: D+38.5 2020: D+39.9 2016: D+37.5 2012: D+34.6 2008: D+35.9
Not yet ingested
- Civics
- —
Market trends
- HPI YoY
- ▼ -112.31%
- Current HPI
- 276.0476
- Rent YoY
- ▲ 8.30%
- Metro
- Milwaukee-Waukesha, WI
- State GDP YoY
- ▲ 2.10%
- F500 in state
- 20
Industry mix (Fortune 500 HQ in WI)
| Industry | F500 HQs | Revenue |
|---|---|---|
| Industrial Machinery | 4 | $23B |
|
||
| Industrial Technology | 2 | $36B |
|
||
| Insurance | 1 | $36B |
|
||
| Professional Services | 1 | $19B |
|
||
| Utilities | 1 | $9B |
|
||
| Consumer Goods | 1 | $3B |
|
||
Price history
+550.0% since first listed8 events — show timeline
- 2026-06-19 Coming Soon $325,000 METROMLS
- 2022-12-12 Sold (MLS) $260,000 METROMLS
- 2022-12-07 Pending — METROMLS
- 2022-11-16 Contingent — METROMLS
- 2022-11-07 Listed $239,000 METROMLS
- 2012-10-09 Listing Removed — METROMLS
- 2012-10-09 Listed $54,900 METROMLS
- 2012-05-21 Sold (MLS) $50,001 METROMLS
Cash-flow waterfall
monthlySold comps — $/sqft
last 12 mo · ≤1 miLoading sold comps…