 Multi-family
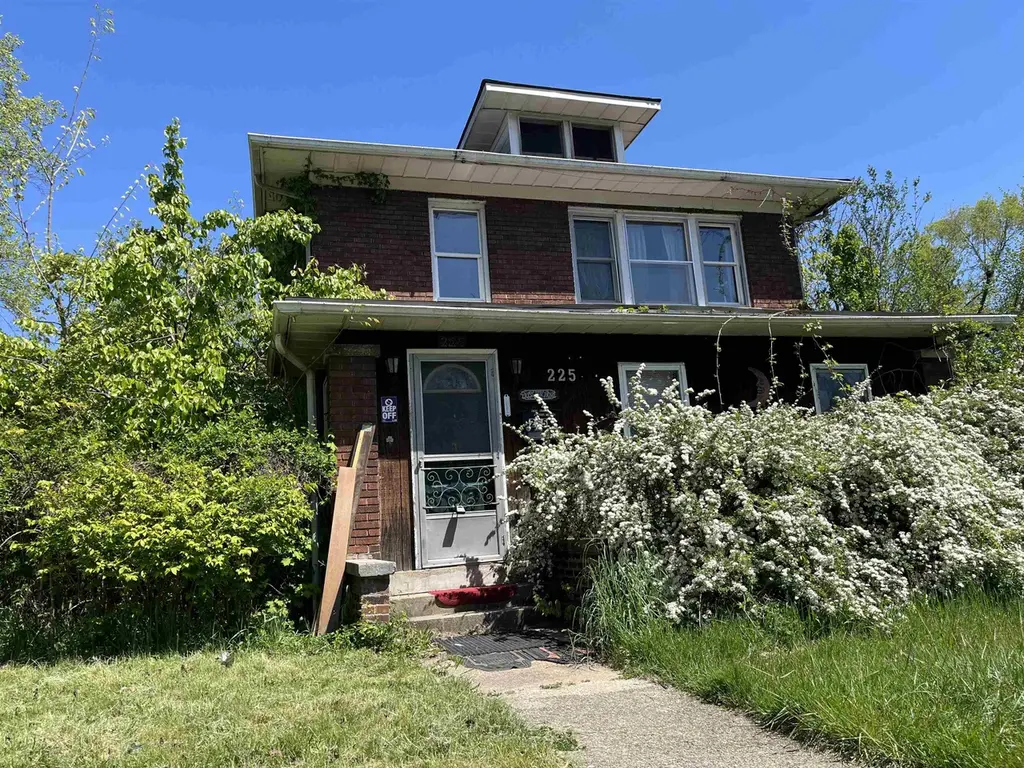
225 E Donald St · South Bend, IN
Flood risk 1/10 · Minimal
- FEMA flood zone
- X (unshaded)
- Chance of flooding over 30 yrs
- 0.0%
- Est. flood insurance / yr
- $473 – $860
Fire risk 1/10 · Minimal
- Est. fire insurance / yr
- $717 – $1,331
Heat risk 2/10 · Minimal
- Hot days now (above 99°F)
- 7 days/yr
- Hot days in 30 yrs
- 16 days/yr
Wind risk 2/10 · Minimal
- Chance of severe wind over 30 yrs
- —
Air-quality risk 3/10 · Minor
- Unhealthy air days now
- 2 days/yr
- Unhealthy air days in 30 yrs
- 3 days/yr
Risk factors via First Street. Map © Google.
Why this score? — see what drove the C+ grade
The composite is a weighted blend of 9 inputs, each scored 0–100. Each bar is that input's sub-score; the figure is the points it added to the 100-point composite (weight × sub-score).
- Cash flow +30.0/30.0
- 1% rule +10.0/10.0
- DSCR +10.0/10.0
- Rent growth +3.5/5.0
- Livability +3.2/5.0
- ARV discount +2.8/15.0
- Condition / age +2.5/5.0
- Schools +1.4/10.0
- Appreciation +0.0/10.0
$85,000
🖨 Deal sheet (PDF) 📄 Offer letter ✓ Due diligence
Multi-family units
County records classify this as Multi-Family (2-4 Unit). Listing-text estimate: 1 unit. estimate disagrees with records
Listing remarks MLS
Fantastic opportunity to own your own duplex with this two-story brick home with loads of potential. Both the upstairs and main levels each have two bedrooms and 1 bathroom. Good sized garage too! House needs a lot of work to make it a home.
Key facts
- 4,356 sq ft lot
- 3 garage spots
- Built 1925
Neighborhood map
What this means for you Summary
Snapshot
- This is a 6-bed/2.0-bath multifamily listed at $85k.
Deal economics
- At list price, monthly cash flow is $1k ($15k/yr) — positive.
- The deal already cash-flows at list — no discount required.
- Meets the 1% rule at list price ($2k rent vs $85k).
- Recommended offer: $80k (6.0% below list) — sets the bar for market timing.
- Cap rate 23.7% vs local median 4.4% in South Bend — top-decile yield for the area; either an underpriced asset or a hidden risk that comps aren't pricing in. Stress-test before assuming the spread holds.
Location & tenants
- Location reads 64/100 on livability (#365 in IN) — a middle-class / working-renter tenant base. Strengths: cost of living A+, housing A+, health & safety A+; Watch: amenities D, employment D, schools F.
- South Bend Community School Corporation (urban): math 12% / reading 21% proficiency, ranked #284 of 301 in IN (top 94%) — low school quality limits family demand, transient renter base, plan for 1-2y turnover; 66% free/reduced lunch — lower-income household profile, screen leases tightly.
- Market conditions: Rents rising fast (+4.1%/yr); 77 active listings in the ZIP; lower-income renter base — watch delinquency; 754 units permitted in St. Joseph County in 2024 (460 in 5+ unit buildings).
- At $2,217/mo this rent would consume 63% of the median local household income ($43k/yr) (locally 545% of renters already pay >50% of income on rent) — very limited rent-growth headroom before tenants either downsize or default.
Forward outlook
- Local home prices are declining (-3.0%/yr); year-one equity from $588 of loan paydown is wiped out by about $3k of value loss. Plan a longer hold.
- At projected returns (-3.0% appreciation + 4.1% rent growth), your $24k cash investment doubles in ~2 years — after that, you're playing with house money.
Negotiation context
- It's been on market 83 days — a 6% lower offer ($80k) is reasonable based on typical stale-listing flexibility.
- 2 sale attempts; this cycle's ask has dropped $10k (11%) from the opening price — seller is motivated, your offer sets the floor, not the list.
Risks & watch-outs
- Watch-outs: built in 1925 — expect roof / HVAC / electrical / plumbing capex.
Questions for the listing agent
- It's been on market 83 days. Have you received any prior offers? Is the seller open to a 6% concession, seller financing, or rate buy-down credit?
- Built in 1925 — when were the roof, HVAC, electrical panel, plumbing, and water heater last replaced?
- Why hasn't it sold? Are there any deal-killer items the seller is aware of (foundation, flood, title, zoning, code violations)?
- Is there a deadline driving the sale (1031 exchange, divorce, estate, relocation)? That informs how much negotiation room exists.
- Schools are F-rated, which usually means shorter tenancies and higher turnover. Who's the typical renter profile here, and what's been the actual vacancy rate?
- Crime grade is F in this area — have there been break-ins, vandalism, or insurance claims at this property in the last 3 years? What carrier currently insures it and at what premium?
- What's the average days-on-market for RENTAL listings here right now (not sales)? A rising rental-DOM trend means longer vacancies and softer asking-rent achievability than the comps imply.
- What's the recent tenant-quality profile in this submarket — average credit score on applications, eviction rate, late-payment / NSF rate, and stable-employment percentage? A property-management company in the area should have these aggregated.
- How much new apartment / multifamily construction is in the pipeline within 1–3 miles? Heavy new supply (>2% of stock underway) typically softens rents 12–24 months out; light construction supports rent growth.
Investment metrics
- 1% rule
- 2.61% ✓
- Cap rate
- 23.66%
- Cash-on-cash
- 62.02%
- DSCR
- 3.76
- GRM
- 3.2
CMA / ARV
- ARV (median comp)
- $77,014
- List price
- $85,000
- Delta
- 10.37%
- Verdict
- OVERPRICED
- Comps
- 20 within 1.0 mi
Projected returns pro-forma
-3.0% appreciation · 4.08% rent growth · sell at horizon
- IRR
- 62.1%
- Equity multiple
- 3.81×
- Total profit
- $66,992
- Equity at exit
- $12,674
- IRR
- 67.0%
- Equity multiple
- 8.12×
- Total profit
- $169,393
- Equity at exit
- $7,349
Cash invested: $23,800 (down + closing). Projections, not guarantees.
Landlord ↔ Tenant lean methodology
- Overall (STATE)
- 90 Strongly Landlord-Friendly
- State Indiana
- 90 Strongly Landlord-Friendly · R+11
- County
- — inherits STATE
- City
- — inherits STATE
ZIP-level market 46613
- Home prices YoY
- -7.2%
- Rents YoY
- 4.1%
- Active inventory
- 77
- Price-to-rent
- 6.4×
Monthly cashflow live
- Estimated rent
- $2,217 high interval (Pro) →
- Mortgage (P&I)
- −$446
- Tax from tax record
- −$40 /mo · $483/yr
- Insurance
- −$35
- HOA
- −$0
- Vacancy / Maint / Mgmt
- −$466
- Net cashflow
- $1,230
Break-even live
Sensitivity live
| Price | -10% $1,278 | -5% $1,254 | +0% $1,230 | +5% $1,206 | +10% $1,182 |
|---|---|---|---|---|---|
| Rent | -10% $1,055 | -5% $1,142 | +0% $1,230 | +5% $1,318 | +10% $1,405 |
| Rate | -1.0pp $1,273 | -0.5pp $1,252 | base $1,230 | +0.5pp $1,208 | +1.0pp $1,186 |
2-unit breakdown (identical units grouped — click to expand)
| Units | Beds | Baths | Est. rent |
|---|---|---|---|
| 2× units | 2 | 1 | $2,216 |
| #1 | 2 | 1 | $1,108 |
| #2 | 2 | 1 | $1,108 |
| Total (2 units) | $2,217 | ||
UW: 25.0% down · 7.5% · 30yr · 1.5% tax · 5.0% vac · 8.0% maint · 8.0% mgmt
Financing live
Cash to close
- Down payment
- $21,250
- Closing costs
- $2,550
- Reserves months
- —
- Total cash needed
- —
Loan-product check · same deal, 3 products live
Conventional
25% down · 7.5% · 30yr
- Down + closing
- —
- Monthly P&I
- —
- Monthly cashflow
- —
- DSCR
- —
- Eligible?
- —
Personal DTI + credit; lowest rate.
DSCR
20% down · 8.5% · 30yr
- Down + closing
- —
- Monthly P&I
- —
- Monthly cashflow
- —
- DSCR
- —
- Eligible?
- —
No personal income docs; deal must DSCR.
Hard money
10% down · 12.0% · 12mo
- Down + closing
- —
- Monthly P&I
- —
- Monthly cashflow
- —
- DSCR
- —
- Eligible?
- —
Short-term bridge; refi at stabilization.
Listing history 18 events
-
2026-06-18days on market $85,000 Active 83 DOM
-
2026-06-17days on market $85,000 Active 82 DOM
-
2026-06-16days on market $85,000 Active 81 DOM
-
2026-06-15days on market $85,000 Active 80 DOM
-
2026-06-14days on market $85,000 Active 78 DOM
-
2026-06-13days on market $85,000 Active 77 DOM
-
2026-06-10days on market $85,000 Active 75 DOM
-
2026-06-09days on market $85,000 Active 74 DOM
-
2026-06-08days on market $85,000 Active 73 DOM
-
2026-06-07days on market $85,000 Active 72 DOM
-
2026-06-03days on market $85,000 Active 68 DOM
-
2026-06-02days on market $85,000 Active 67 DOM
-
2026-06-01days on market $85,000 Active 66 DOM
-
2026-05-31days on market $85,000 Active 65 DOM
-
2026-05-30days on market $85,000 Active 64 DOM
-
2026-05-04price $90,000 242-char remark
Show marketing remark (242 chars)
Fantastic opportunity to own your own duplex with this two-story brick home with loads of potential. Both the upstairs and main levels each have two bedrooms and 1 bathroom. Good sized garage too! House needs a lot of work to make it a home.
-
2026-03-27$95,000 Active 242-char remark
Show marketing remark (242 chars)
Fantastic opportunity to own your own duplex with this two-story brick home with loads of potential. Both the upstairs and main levels each have two bedrooms and 1 bathroom. Good sized garage too! House needs a lot of work to make it a home.
-
2025-09-04$95,000 Active
ⓘ Source: listings_history table (triggers on properties + properties_extension) + one-shot
backfill from property_details.listing_events for pre-trigger history.
Tax reassessment forecast IN · Partial reset (capped growth)
- Current annual tax
- $483 · $40/mo
- Projected year-2 tax
- $603 · $50/mo
- Expected delta
- +$120/yr (+$10/mo · 24.7%)
ⓘ Screening estimate from a state-policy table — verify with the county assessor before closing.
Climate risk First Street
- Flood 1/10 Low FEMA zone X (unshaded) · 0% chance over 30 yrs
- Wildfire 1/10 Low
- Heat 2/10 Low 7 d/yr ≥99°F today · 16 d/yr by 30 yrs out
- Wind 2/10 Low
- Air quality 3/10 Moderate 2 unhealthy d/yr today · 3 by 30 yrs out
Nearby sold comps map
Loading sold comps map…
Walkable amenities ~0.75 mi
Loading nearby amenities…
Taxation est. · year 1
- Rental income
- $26,604
- − Mortgage interest
- −$4,761
- − Property taxes
- −$483
- − Insurance
- −$425
- − Repairs & maintenance
- −$2,128
- − Management
- −$2,128
- − Depreciation
- −$2,473
- Taxable income
- $14,205
- Est. tax owed @ 24.0%
- −$3,409
- After-tax cash flow
- $11,351/yr
For passive investors: Depreciation is non-cash, so a rental often shows a tax loss while cash-flowing — sheltering income. Rental losses are passive: they offset passive income freely, and up to $25,000/yr can offset ordinary (W-2) income if you actively participate and your MAGI is under $100k (phasing out to $0 by $150k); unused losses carry forward. On sale, claimed depreciation is recaptured at up to 25%, and gains may owe capital-gains tax (a 1031 exchange can defer both). Figures are a year-1 estimate at your 24.0% rate — not tax advice; consult a CPA.
Schools (NCES district)
- District
- South Bend Community School Corporation
- NCES district ID
- 1810290
- Math proficiency
- 12% ▼ -10.00%
- Reading proficiency
- 21% ▼ -6.00%
- Median HH income
- $41,935
- Composite
- 14.21/100
- National rank
- #9452
- State rank
- #284 of 301 in IN
Livability — South Bend
- Score
- 64/100
- State rank
- #365
- US rank
- #13730
Category grades
Schools grade is shown separately in the Schools card above.
Census & demographics
- Census place
- South Bend, IN
- County
- Saint Joseph County · 189,048 people
- City population
- 99,767
- Metro
- South Bend-Mishawaka, IN-MI
- Population (ZIP)
- 12,279
- Household income
- $42,537
- Rent vs Own
- Severe rent burden
- 545.0
Population outlook (St. Joseph County) Hauer SSP2
- Today (2025)
- 273,186 people
- By 2030
- 273,594 · +0.1%
- By 2040
- 271,641 · -0.6%
- By 2050
- 269,187 · -1.5%
- By 2075
- 263,136 · -3.7%
- By 2100
- 245,659 · -10.1%
Race, ethnicity, and origin ACS 2023
- Neighborhood character
- Highly diverse neighborhood (Simpson 0.72)
- Race & ethnicity
- White 41% Hispanic / Latino 24% Black 23% Two or more races 22% Asian 2% Native American 1%
- Hispanic origin (detail)
- Mexican 22%
- Common ancestry
- Romanian 4% Italian 1% Slovak 1%
- Foreign-born
- 9% · Canada, Philippines
- Languages at home
- 81% English-only · Spanish 17% Other Asian/Pacific 1%
Political lean MEDSL · St. Joseph
- 2024 margin
- Toss-up / Even · D 50.0% · R 48.5% · Other 1.5%
- 2008→2024 swing
- -15.6pp toward R · 2008: 17.1pp · 2024: 1.5pp
- All cycles
- 2024: D+1.5 2020: D+5.8 2016: D+0.2 2012: D+3.5 2008: D+17.1
Not yet ingested
- Civics
- —
Market trends
- HPI YoY
- ▼ -20.88%
- Current HPI
- 270.0303
- Rent YoY
- ▲ 4.08%
- Metro
- South Bend-Mishawaka, IN-MI
- State GDP YoY
- ▲ 2.90%
- F500 in state
- 18
Industry mix (Fortune 500 HQ in IN)
| Industry | F500 HQs | Revenue |
|---|---|---|
| Industrial Machinery | 2 | $37B |
|
||
| Healthcare | 1 | $177B |
|
||
| Pharmaceuticals | 1 | $45B |
|
||
| Metals / Steel | 1 | $18B |
|
||
| Agriculture | 1 | $17B |
|
||
| Packaging | 1 | $12B |
|
||
Price history
-5.3% since first listed3 events — show timeline
- 2026-05-04 Price Changed $90,000 IRMLS
- 2026-03-27 Listed $95,000 IRMLS
- 2025-09-04 Listed $95,000 IRMLS
Property tax history
+6.7%/yrLatest (2023): $483 · -15.4% YoY. Source: county tax records.
Cash-flow waterfall
monthlySold comps — $/sqft
last 12 mo · ≤1 miLoading sold comps…