205 Las Palomas Rd · Las Palomas, NM
Flood risk 1/10 · Minimal
- FEMA flood zone
- X
- Chance of flooding over 30 yrs
- 0.0%
- Est. flood insurance / yr
- $507 – $1,088
Fire risk 5/10 · Moderate
- Est. fire insurance / yr
- $706 – $1,312
Heat risk 5/10 · Moderate
- Hot days now (above 99°F)
- 6 days/yr
- Hot days in 30 yrs
- 19 days/yr
Wind risk 1/10 · Minimal
- Chance of severe wind over 30 yrs
- —
Air-quality risk 1/10 · Minimal
- Unhealthy air days now
- 0 days/yr
- Unhealthy air days in 30 yrs
- 0 days/yr
Risk factors via First Street. Map © Google.
Why this score? — see what drove the D- grade
The composite is a weighted blend of 9 inputs, each scored 0–100. Each bar is that input's sub-score; the figure is the points it added to the 100-point composite (weight × sub-score).
- Cash flow +10.3/30.0
- ARV discount +7.5/15.0
- Appreciation +5.7/10.0
- 1% rule +3.1/10.0
- DSCR +3.0/10.0
- Livability +2.8/5.0
- Rent growth +2.5/5.0
- Condition / age +2.5/5.0
- Schools +2.0/10.0
$255,000
🖨 Deal sheet (PDF) 📄 Offer letter ✓ Due diligence
Listing remarks
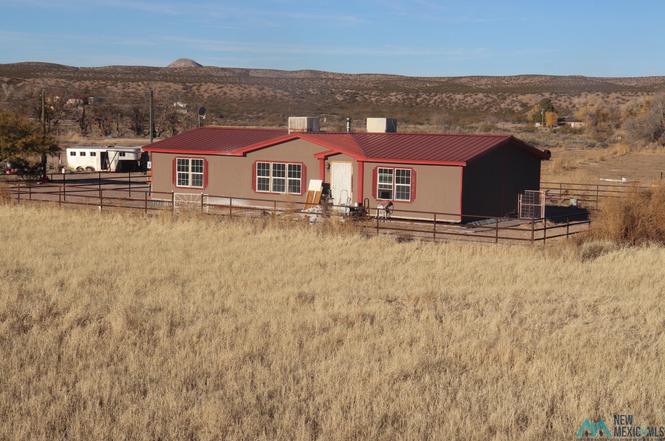
Three-bedroom, two-bath manufactured home situated on approximately on 8.6 acres in Las Palomas Canyon. Property includes an irrigation well and domestic well and septic system. Ideal for animal lovers or agricultural use, the land features a drive-through barn with horse pens, providing ample space for livestock, equipment, or farming. Usable acreage. Whether you’re looking for a small farm, horse property, or tranquil retreat with room to grow, this versatile property offers endless possibilities in a beautiful New Mexico setting.
Key facts
- Irrigation well
- Drive-through barn
- Horse pens
Tags
Neighborhood map
What this means for you Summary
Snapshot
- This is a 3-bed/2.0-bath manufactured listed at $255k.
Deal economics
- At list price, monthly cash flow is $-140 ($-2k/yr) — negative.
- To cash-flow at today's rent, offer at most $235k (7.9% below list).
- To meet the 1% rule (rent ≥ 1% of price), the offer needs to be $205k (19.5% below list).
- Recommended offer: $205k (19.5% below list) — sets the bar for 1% rule.
Location & tenants
- Location reads 55/100 on livability (#211 in NM) — a working-class tenant base; expect higher turnover. Strengths: cost of living A+; Watch: employment C-, schools D, crime F.
- T Or C Municipal Schools (town): math 25% / reading 25% proficiency, ranked #29 of 29 in NM (top 100%) — low school quality limits family demand, transient renter base, plan for 1-2y turnover; 70% free/reduced lunch — lower-income household profile, screen leases tightly.
- Market conditions: 19 active listings in the ZIP.
Forward outlook
- In year one you build about $5k of equity ($2k loan paydown + $3k appreciation (1.3% local appreciation)).
- Sierra County population projected at -38% by 2050 — secular population decline; favor cash flow + early exit over multi-decade hold.
- By year 7, paydown + projected appreciation supports a ~$34k cash-out refi (75% LTV) — recoverable capital for the next deal without selling this one.
Negotiation context
- It's been on market 59 days — a 3% lower offer ($247k) is reasonable based on typical stale-listing flexibility.
Risks & watch-outs
- Climate carrying-cost: moderate wildfire risk; extreme-heat days projected 6→19/yr by 2055 (HVAC capex compounding) — expect insurance premiums to compound above CPI over the hold.
Questions for the listing agent
- What do current leases actually rent for vs. the listed asking? Can we see a recent rent roll and the last 12 months of T-12 income?
- It's been on market 59 days. Have you received any prior offers? Is the seller open to a 19% concession, seller financing, or rate buy-down credit?
- Is there a deadline driving the sale (1031 exchange, divorce, estate, relocation)? That informs how much negotiation room exists.
- Schools are D-rated, which usually means shorter tenancies and higher turnover. Who's the typical renter profile here, and what's been the actual vacancy rate?
- Crime grade is F in this area — have there been break-ins, vandalism, or insurance claims at this property in the last 3 years? What carrier currently insures it and at what premium?
- The area grade is low — what's the realistic commute time and amenity access for the typical tenant pool here? Any planned neighborhood developments (good or bad) we should know about?
- What's the average days-on-market for RENTAL listings here right now (not sales)? A rising rental-DOM trend means longer vacancies and softer asking-rent achievability than the comps imply.
- What's the recent tenant-quality profile in this submarket — average credit score on applications, eviction rate, late-payment / NSF rate, and stable-employment percentage? A property-management company in the area should have these aggregated.
- How much new for-sale + rental construction is in the pipeline within 1–3 miles? Heavy new supply typically softens prices + rents 12–24 months out; constrained supply supports both.
Investment metrics
- 1% rule
- 0.81% ✗
- Cap rate
- 5.64%
- Cash-on-cash
- -2.35%
- DSCR
- 0.90
- GRM
- 10.3
CMA / ARV
No comps found within radius.
Projected returns pro-forma
1.31% appreciation · 3.0% rent growth · sell at horizon
- IRR
- -0.1%
- Equity multiple
- 1.00×
- Total profit
- $-208
- Equity at exit
- $91,189
- IRR
- 4.6%
- Equity multiple
- 1.58×
- Total profit
- $41,227
- Equity at exit
- $124,446
Cash invested: $71,400 (down + closing). Projections, not guarantees.
Landlord ↔ Tenant lean methodology
- Overall (STATE)
- 55 Moderately Landlord-Leaning
- State New Mexico
- 55 Moderately Landlord-Leaning · D+3
- County
- — inherits STATE
- City
- — inherits STATE
ZIP-level market 87942
- Home prices YoY
- 1.0%
- Active inventory
- 19
- Price-to-rent
- 10.3×
Monthly cashflow live
- Estimated rent
- $2,054 medium interval (Pro) →
- Mortgage (P&I)
- −$1,337
- Tax est. 1.5%
- −$319 /mo · $3,825/yr
- Insurance
- −$106
- HOA
- −$0
- Vacancy / Maint / Mgmt
- −$431
- Net cashflow
- $-140
Break-even live
Sensitivity live
| Price | -10% $37 | -5% $-52 | +0% $-140 | +5% $-228 | +10% $-316 |
|---|---|---|---|---|---|
| Rent | -10% $-302 | -5% $-221 | +0% $-140 | +5% $-59 | +10% $23 |
| Rate | -1.0pp $-11 | -0.5pp $-75 | base $-140 | +0.5pp $-206 | +1.0pp $-273 |
UW: 25.0% down · 7.5% · 30yr · 1.5% tax · 5.0% vac · 8.0% maint · 8.0% mgmt
Financing live
Cash to close
- Down payment
- $63,750
- Closing costs
- $7,650
- Reserves months
- —
- Total cash needed
- —
Loan-product check · same deal, 3 products live
Conventional
25% down · 7.5% · 30yr
- Down + closing
- —
- Monthly P&I
- —
- Monthly cashflow
- —
- DSCR
- —
- Eligible?
- —
Personal DTI + credit; lowest rate.
DSCR
20% down · 8.5% · 30yr
- Down + closing
- —
- Monthly P&I
- —
- Monthly cashflow
- —
- DSCR
- —
- Eligible?
- —
No personal income docs; deal must DSCR.
Hard money
10% down · 12.0% · 12mo
- Down + closing
- —
- Monthly P&I
- —
- Monthly cashflow
- —
- DSCR
- —
- Eligible?
- —
Short-term bridge; refi at stabilization.
Listing history 4 events
-
2026-02-14status Pending
-
2026-02-13price $255,000
-
2026-01-16price $299,900
-
2025-12-15$350,000 Active
ⓘ Source: listings_history table (triggers on properties + properties_extension) + one-shot
backfill from property_details.listing_events for pre-trigger history.
Climate risk First Street
- Flood 1/10 Low FEMA zone X · 0% chance over 30 yrs
- Wildfire 5/10 Major
- Heat 5/10 Major 6 d/yr ≥99°F today · 19 d/yr by 30 yrs out
- Wind 1/10 Low
- Air quality 1/10 Low 0 unhealthy d/yr today · 0 by 30 yrs out
Nearby sold comps map
Loading sold comps map…
Walkable amenities ~0.75 mi
Loading nearby amenities…
Taxation est. · year 1
- Rental income
- $24,647
- − Mortgage interest
- −$14,284
- − Property taxes
- −$3,825
- − Insurance
- −$1,275
- − Repairs & maintenance
- −$1,972
- − Management
- −$1,972
- − Depreciation
- −$7,418
- Taxable loss
- −$6,099
- Est. tax savings @ 24.0%
- +$1,464
- After-tax cash flow
- $-212/yr
For passive investors: Depreciation is non-cash, so a rental often shows a tax loss while cash-flowing — sheltering income. Rental losses are passive: they offset passive income freely, and up to $25,000/yr can offset ordinary (W-2) income if you actively participate and your MAGI is under $100k (phasing out to $0 by $150k); unused losses carry forward. On sale, claimed depreciation is recaptured at up to 25%, and gains may owe capital-gains tax (a 1031 exchange can defer both). Figures are a year-1 estimate at your 24.0% rate — not tax advice; consult a CPA.
Schools (NCES district)
- District
- T Or C Municipal Schools
- NCES district ID
- 3502610
- Math proficiency
- 25% ▲ 1.00%
- Reading proficiency
- 25% ▼ -7.00%
- Median HH income
- $28,449
- Composite
- 20.0/100
- National rank
- #8666
- State rank
- #29 of 29 in NM
Livability — Las Palomas
- Score
- 55/100
- State rank
- #211
- US rank
- #23548
Category grades
Schools grade is shown separately in the Schools card above.
Census & demographics
- Population (ZIP)
- 1,114
Population outlook (Sierra County) Hauer SSP2
- Today (2025)
- 9,498 people
- By 2030
- 8,580 · -9.7%
- By 2040
- 6,994 · -26.4%
- By 2050
- 5,914 · -37.7%
- By 2075
- 4,083 · -57.0%
- By 2100
- 2,499 · -73.7%
Race, ethnicity, and origin ACS 2023
- Neighborhood character
- Majority White (58%)
- Race & ethnicity
- White 58% Hispanic / Latino 41% Two or more races 16%
- Hispanic origin (detail)
- Mexican 36%
- Common ancestry
- Slovak 11% German 1% Romanian 1%
- Foreign-born
- 20% · Canada
- Languages at home
- 65% English-only · Spanish 35%
Political lean MEDSL · Sierra
- 2024 margin
- R (+19.2) · D 39.2% · R 58.3% · Other 2.5%
- 2008→2024 swing
- -7.1pp toward R · 2008: -12.1pp · 2024: -19.2pp
- All cycles
- 2024: R+19.2 2020: R+21.5 2016: R+27.2 2012: R+18.9 2008: R+12.1
Not yet ingested
- Civics
- —
Market trends
- HPI YoY
- ▲ 1.31%
- Current HPI
- 128.8108
- Rent YoY
- —
- Metro
- —
- State GDP YoY
- —
- F500 in state
- 0
Price history
-27.1% since first listed4 events — show timeline
- 2026-02-14 Pending — NMMLS
- 2026-02-13 Price Changed $255,000 NMMLS
- 2026-01-16 Price Changed $299,900 NMMLS
- 2025-12-15 Listed $350,000 NMMLS
Cash-flow waterfall
monthlySold comps — $/sqft
last 12 mo · ≤1 miLoading sold comps…