4939 Reidland Rd · Reidland, KY
Flood risk 1/10 · Minimal
- FEMA flood zone
- X (unshaded)
- Chance of flooding over 30 yrs
- 0.0%
- Est. flood insurance / yr
- $507 – $1,088
Fire risk 4/10 · Minor
- Est. fire insurance / yr
- $839 – $1,559
Heat risk 6/10 · Moderate
- Hot days now (above 108°F)
- 7 days/yr
- Hot days in 30 yrs
- 20 days/yr
Wind risk 3/10 · Minor
- Chance of severe wind over 30 yrs
- 5.0%
Air-quality risk 2/10 · Minimal
- Unhealthy air days now
- 0 days/yr
- Unhealthy air days in 30 yrs
- 1 days/yr
Risk factors via First Street. Map © Google.
Why this score? — see what drove the B- grade
The composite is a weighted blend of 9 inputs, each scored 0–100. Each bar is that input's sub-score; the figure is the points it added to the 100-point composite (weight × sub-score).
- Cash flow +30.0/30.0
- 1% rule +10.0/10.0
- DSCR +10.0/10.0
- ARV discount +7.5/15.0
- Schools +4.0/10.0
- Livability +3.5/5.0
- Rent growth +2.5/5.0
- Condition / age +2.5/5.0
- Appreciation +0.0/10.0
$35,000
🖨 Deal sheet 📄 Offer letter ✓ Due diligence
Listing remarks MLS
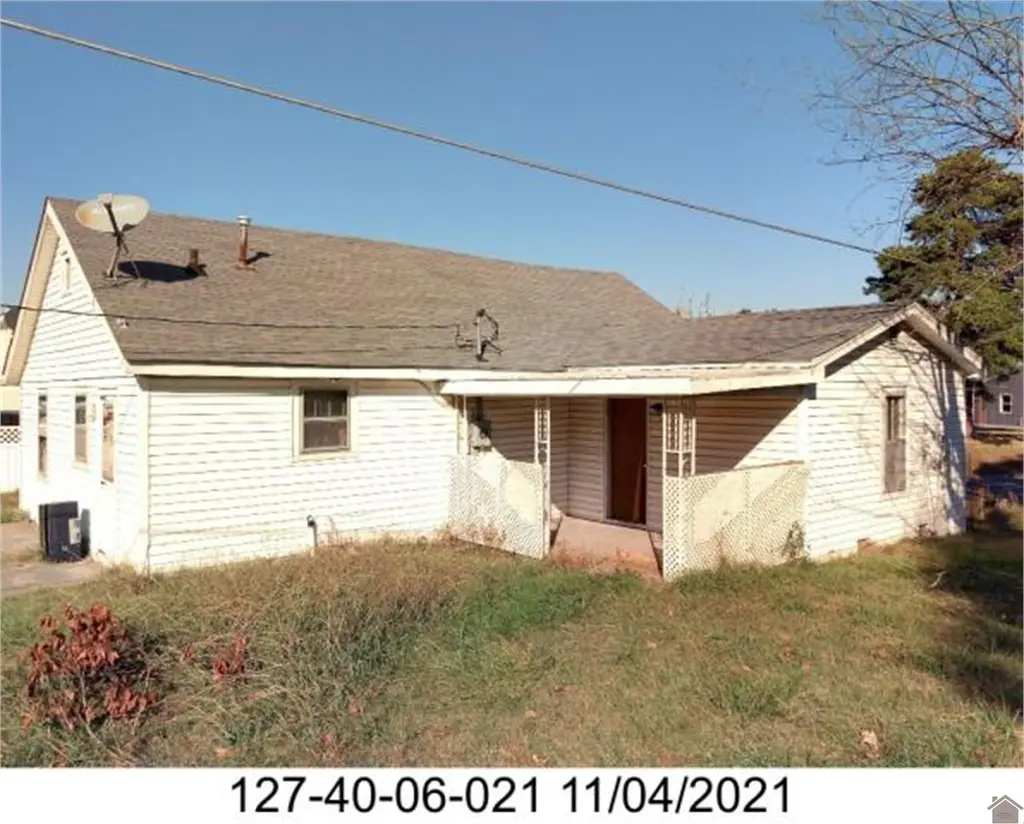
4939 Reidland Road Paducah. Located on a triangular shaped lot at the intersection of Reidland Rd and Martin Rd. Home features 2-3 bedrooms 1 bath, open living, dining & kitchen area. Equal Housing Opportunity. Sold in its current as is where is condition. HUD#201-519082.
Key facts
- Rental addition
- Blank canvas
- Kitchen empty
Tags
Property features AI
Exterior
- Utilities: Public water; Natural gas available
- Home design: Single-family residence; Single story
- Construction: Block and vinyl siding construction; Composition roof
- Exterior features: Level, corner lot
Interior
- Flooring: Wood flooring
- Bathrooms: 1 full bathroom
- Interior features: Eat-in kitchen; Storm windows
Neighborhood map
What this means for you Summary
Snapshot
- This is a 2-bed/1.0-bath single-family listed at $35k.
Deal economics
- At list price, monthly cash flow is $634 ($8k/yr) — positive.
- The deal already cash-flows at list — no discount required.
- Meets the 1% rule at list price ($1k rent vs $35k).
- Recommended offer: $34k (1.5% below list) — sets the bar for market timing.
- Cap rate 28.0% vs local median 3.8% in Reidland — top-decile yield for the area; either an underpriced asset or a hidden risk that comps aren't pricing in. Stress-test before assuming the spread holds.
Location & tenants
- Location reads 70/100 on livability (#162 in KY) — a middle-class / working-renter tenant base. Strengths: crime A+, cost of living A+, housing A+; Watch: amenities F, commute F, health & safety F.
- Mccracken County (town): math 41% / reading 52% proficiency, ranked #16 of 165 in KY (top 10%) — families likely to look elsewhere, expect single-tenant / working-renter base with shorter leases.
- Zoned schools: Reidland Elementary School (math 22% / reading 32%, grade F, #434 of 676 statewide, top 69%, 587 students, 70% FRL); Reidland Middle School (math 36% / reading 47%, grade F, #51 of 217 statewide, top 24%, 330 students, 64% FRL); Mccracken County High School (math 30% / reading 44%, grade F, #58 of 254 statewide, top 27%, 1,999 students, 43% FRL) — zoned schools average 59% FRL vs 41% district-wide (18 pts higher); higher-poverty schools than district average — tighter screening recommended.
- Market conditions: 268 active listings in the ZIP; 187 units permitted in McCracken County in 2024 (104 in 5+ unit buildings).
Forward outlook
- Local home prices are declining (-3.0%/yr); year-one equity from $242 of loan paydown is wiped out by about $1k of value loss. Plan a longer hold.
- McCracken County population projected to shrink 9% by 2050 — rents likely to lag national; underwrite the cash flow, not the appreciation.
- At projected returns (-3.0% appreciation + 3.0% rent growth), your $10k cash investment doubles in ~2 years — after that, you're playing with house money.
Negotiation context
- It's been on market 21 days — a 2% lower offer ($34k) is reasonable based on typical stale-listing flexibility.
- 2 sale attempts since 7y ago with the ask held roughly flat each time — persistent listings suggest the price (not the market) is what's stuck; bring a comps-based counter.
- Current owner paid $19k; list at $35k implies a 84% gain — meaningful room to come down on a strong offer.
Risks & watch-outs
- Climate carrying-cost: extreme-heat days projected 7→20/yr by 2055 (HVAC capex compounding) — expect insurance premiums to compound above CPI over the hold.
Questions for the listing agent
- Built in 1961 — when were the roof, HVAC, electrical panel, plumbing, and water heater last replaced?
- Is there a deadline driving the sale (1031 exchange, divorce, estate, relocation)? That informs how much negotiation room exists.
- What's the average days-on-market for RENTAL listings here right now (not sales)? A rising rental-DOM trend means longer vacancies and softer asking-rent achievability than the comps imply.
- What's the recent tenant-quality profile in this submarket — average credit score on applications, eviction rate, late-payment / NSF rate, and stable-employment percentage? A property-management company in the area should have these aggregated.
- How much new for-sale + rental construction is in the pipeline within 1–3 miles? Heavy new supply typically softens prices + rents 12–24 months out; constrained supply supports both.
Investment metrics
- 1% rule
- 3.22% ✓
- Cap rate
- 28.02%
- Cash-on-cash
- 77.60%
- DSCR
- 4.45
- GRM
- 2.6
CMA / ARV
- ARV (on-the-fly)
- $76,310
- Comps found
- 4
Show comp detail 4 sales within ~0.75 mi
| Address | Dist | Beds/Ba | Sqft | Sold | Price | $/sf | Match |
|---|---|---|---|---|---|---|---|
| 4939 Reidland Rd | 0.00mi | 2/1.0 | 1,174 (0%) | 0mo | $28,000 | $24 | 100 |
| 5225 Reidland Rd | 0.54mi | 2/1.0 | 1,178 (+0%) | 8mo | $76,000 | $65 | 68 |
| 5045 I.c. Ave | 0.32mi | 2/1.0 | 1,000 (-15%) | 9mo | $55,000 | $55 | 53 |
| 205 Myrna Dr | 0.32mi | 3/2.0 (+1) | 1,342 (+14%) | 24mo | $125,000 | $93 | 32 |
Match score weights: distance 35% · size 25% · config 20% · recency 20%. Top-matched comps best support the ARV.
Projected returns pro-forma
-3.0% appreciation · 3.0% rent growth · sell at horizon
- IRR
- 77.6%
- Equity multiple
- 4.54×
- Total profit
- $34,717
- Equity at exit
- $5,219
- IRR
- 81.2%
- Equity multiple
- 9.40×
- Total profit
- $82,310
- Equity at exit
- $3,026
Cash invested: $9,800 (down + closing). Projections, not guarantees.
Landlord ↔ Tenant lean methodology
- Overall (STATE)
- 83 Strongly Landlord-Friendly
- State Kentucky
- 83 Strongly Landlord-Friendly · R+16
- County
- — inherits STATE
- City
- — inherits STATE
ZIP-level market 42003
- Home prices YoY
- -19.8%
- Active inventory
- 268
- Price-to-rent
- 2.6×
Monthly cashflow live
- Estimated rent
- $1,127 medium interval (Pro) →
- Mortgage (P&I)
- −$184
- Tax from tax record
- −$58 /mo · $699/yr
- Insurance
- −$15
- HOA
- −$0
- Vacancy / Maint / Mgmt
- −$237
- Net cashflow
- $634
Break-even live
UW: 25.0% down · 7.5% · 30yr · 1.5% tax · 5.0% vac · 8.0% maint · 8.0% mgmt
Financing live
Cash to close
- Down payment
- $8,750
- Closing costs
- $1,050
- Reserves months
- —
- Total cash needed
- —
Loan-product check · same deal, 3 products live
Conventional
25% down · 7.5% · 30yr
- Down + closing
- —
- Monthly P&I
- —
- Monthly cashflow
- —
- DSCR
- —
- Eligible?
- —
Personal DTI + credit; lowest rate.
DSCR
20% down · 8.5% · 30yr
- Down + closing
- —
- Monthly P&I
- —
- Monthly cashflow
- —
- DSCR
- —
- Eligible?
- —
No personal income docs; deal must DSCR.
Hard money
10% down · 12.0% · 12mo
- Down + closing
- —
- Monthly P&I
- —
- Monthly cashflow
- —
- DSCR
- —
- Eligible?
- —
Short-term bridge; refi at stabilization.
Listing history 17 events
-
2026-06-17days on market $35,000 Active 21 DOM
-
2026-06-16days on market $35,000 Active 20 DOM
-
2026-06-15days on market $35,000 Active 19 DOM
-
2026-06-14days on market $35,000 Active 17 DOM
-
2026-06-12days on market $35,000 Active 16 DOM
-
2026-06-09days on market $35,000 Active 13 DOM
-
2026-06-08days on market $35,000 Active 12 DOM
-
2026-06-07days on market $35,000 Active 11 DOM
-
2026-06-05days on market $35,000 Active 8 DOM
-
2026-06-03days on market $35,000 Active 7 DOM
-
2026-06-02days on market $35,000 Active 6 DOM
-
2026-06-01days on market $35,000 Active 5 DOM
-
2026-05-31days on market $35,000 Active 4 DOM
-
2026-05-30days on market $35,000 Active 3 DOM
-
2026-05-28$35,000 Active
-
2020-03-20soldstatus $19,000 278-char remark
Show marketing remark (278 chars)
4939 Reidland Road Paducah. Located on a triangular shaped lot at the intersection of Reidland Rd and Martin Rd. Home features 2-3 bedrooms 1 bath, open living, dining & kitchen area. Equal Housing Opportunity. Sold in its current as is where is condition. HUD#201-519082.
-
2019-11-14$20,000 278-char remark
Show marketing remark (278 chars)
4939 Reidland Road Paducah. Located on a triangular shaped lot at the intersection of Reidland Rd and Martin Rd. Home features 2-3 bedrooms 1 bath, open living, dining & kitchen area. Equal Housing Opportunity. Sold in its current as is where is condition. HUD#201-519082.
ⓘ Source: listings_history table (triggers on properties + properties_extension) + one-shot
backfill from property_details.listing_events for pre-trigger history.
Tax reassessment forecast KY · Resets to sale price
- Current annual tax
- $699 · $58/mo
- Projected year-2 tax
- $699 · $58/mo
- Expected delta
- $0/yr ($0/mo · 0.0%)
ⓘ Screening estimate from a state-policy table — verify with the county assessor before closing.
Climate risk First Street
- Flood 1/10 Low FEMA zone X (unshaded) · 0% chance over 30 yrs
- Wildfire 4/10 Moderate
- Heat 6/10 Major 7 d/yr ≥108°F today · 20 d/yr by 30 yrs out
- Wind 3/10 Moderate 5% chance of damaging wind over 30 yrs
- Air quality 2/10 Low 0 unhealthy d/yr today · 1 by 30 yrs out
Nearby sold comps map
Loading sold comps map…
Walkable amenities ~0.75 mi
Loading nearby amenities…
Taxation est. · year 1
- Rental income
- $13,521
- − Mortgage interest
- −$1,961
- − Property taxes
- −$699
- − Insurance
- −$175
- − Repairs & maintenance
- −$1,082
- − Management
- −$1,082
- − Depreciation
- −$1,018
- Taxable income
- $7,505
- Est. tax owed @ 24.0%
- −$1,801
- After-tax cash flow
- $5,804/yr
For passive investors: Depreciation is non-cash, so a rental often shows a tax loss while cash-flowing — sheltering income. Rental losses are passive: they offset passive income freely, and up to $25,000/yr can offset ordinary (W-2) income if you actively participate and your MAGI is under $100k (phasing out to $0 by $150k); unused losses carry forward. On sale, claimed depreciation is recaptured at up to 25%, and gains may owe capital-gains tax (a 1031 exchange can defer both). Figures are a year-1 estimate at your 24.0% rate — not tax advice; consult a CPA.
Schools (NCES district)
- District
- Mccracken County
- NCES district ID
- 2103960
- Math proficiency
- 41% ▼ -15.00%
- Reading proficiency
- 52% ▼ -15.00%
- Median HH income
- $49,976
- Composite
- 39.84/100
- National rank
- #3871
- State rank
- #16 of 165 in KY
Livability — Reidland
- Score
- 70/100
- State rank
- #162
- US rank
- #8099
Category grades
Schools grade is shown separately in the Schools card above.
Census & demographics
- Census place
- Reidland, KY
- Population (ZIP)
- 29,384
Population outlook (McCracken County) Hauer SSP2
- Today (2025)
- 64,237 people
- By 2030
- 63,468 · -1.2%
- By 2040
- 61,221 · -4.7%
- By 2050
- 58,432 · -9.0%
- By 2075
- 52,668 · -18.0%
- By 2100
- 44,517 · -30.7%
Race, ethnicity, and origin ACS 2023
- Neighborhood character
- Predominantly White (83%)
- Race & ethnicity
- White 83% Black 9% Two or more races 5% Hispanic / Latino 4%
- Common ancestry
- Slovak 2% Lithuanian 1% Serbian 1%
- Foreign-born
- 2% · Canada
- Languages at home
- 97% English-only · Spanish 1% Other Asian/Pacific 1%
Political lean MEDSL · McCracken
- 2024 margin
- Solid R (+34.9) · D 31.9% · R 66.8% · Other 1.2%
- 2008→2024 swing
- -9.7pp toward R · 2008: -25.2pp · 2024: -34.9pp
- All cycles
- 2024: R+34.9 2020: R+31.7 2016: R+37.2 2012: R+32.5 2008: R+25.2
Not yet ingested
- Civics
- —
Market trends
- HPI YoY
- ▼ -58.31%
- Current HPI
- 236.3013
- Rent YoY
- —
- Metro
- —
- State GDP YoY
- ▲ 1.81%
- F500 in state
- 4
Industry mix (Fortune 500 HQ in KY)
| Industry | F500 HQs | Revenue |
|---|---|---|
| Healthcare | 1 | $118B |
|
||
| Food / Beverage | 1 | $7B |
|
||
Price history
+75.0% since first listed3 events — show timeline
- 2026-05-28 Listed $35,000 WKRMLS
- 2020-03-20 Sold (MLS) $19,000 WKRMLS
- 2019-11-14 Listed $20,000 WKRMLS
Property tax history
+4.9%/yrLatest (2025): $699 · -1.8% YoY. Source: county tax records.
Cash-flow waterfall
monthlySold comps — $/sqft
last 12 mo · ≤1 miLoading sold comps…