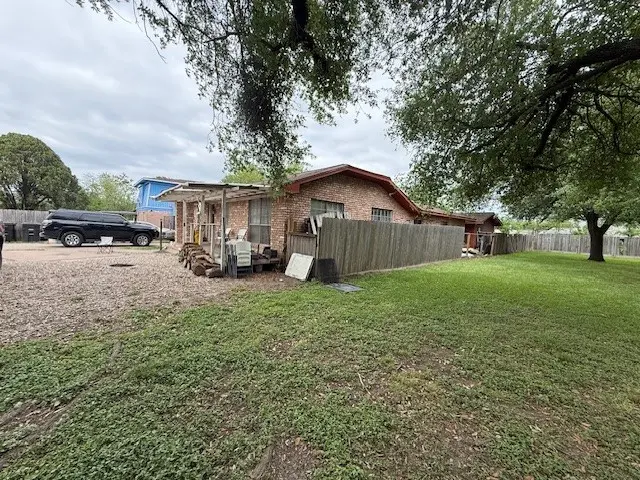
4334 Spring Valley Rd · Houston, TX
Flood risk 1/10 · Minimal
- FEMA flood zone
- X (unshaded)
- Chance of flooding over 30 yrs
- 0.0%
- Est. flood insurance / yr
- $507 – $1,088
Fire risk 1/10 · Minimal
- Est. fire insurance / yr
- $1,222 – $2,270
Heat risk 9/10 · Severe
- Hot days now (above 109°F)
- 7 days/yr
- Hot days in 30 yrs
- 23 days/yr
Wind risk 9/10 · Severe
- Chance of severe wind over 30 yrs
- 99.0%
Air-quality risk 3/10 · Minor
- Unhealthy air days now
- 3 days/yr
- Unhealthy air days in 30 yrs
- 3 days/yr
Risk factors via First Street. Map © Google.
Why this score? — see what drove the C+ grade
The composite is a weighted blend of 9 inputs, each scored 0–100. Each bar is that input's sub-score; the figure is the points it added to the 100-point composite (weight × sub-score).
- Cash flow +18.0/30.0
- ARV discount +15.0/15.0
- 1% rule +6.3/10.0
- DSCR +5.6/10.0
- Schools +4.4/10.0
- Appreciation +4.3/10.0
- Livability +3.7/5.0
- Rent growth +2.6/5.0
- Condition / age +2.5/5.0
$185,000
🖨 Deal sheet 📄 Offer letter ✓ Due diligence
Listing remarks
Main house with guest house in back. No HOA / no restrictions per owner. Estate sale. Main house needs work. Garage apartment in back is in better shape than main house. Selling as-is. Great opportunity for an unrestricted property. MULTIPLE OFFERS RECEIVED. FINAL DEADLINE FRIDAY, DEC 5TH AT NOON.
Key facts
- No restrictions
- Guest house
- No hoa
Tags
Neighborhood map
What this means for you Summary
Snapshot
- This is a 4-bed/2.0-bath single-family listed at $185k.
Deal economics
- At list price, monthly cash flow is $159 ($2k/yr) — positive.
- The deal already cash-flows at list — no discount required.
- Meets the 1% rule at list price ($2k rent vs $185k).
- Cap rate 7.3% vs local median 3.2% in Houston — top-decile yield for the area; either an underpriced asset or a hidden risk that comps aren't pricing in. Stress-test before assuming the spread holds.
Location & tenants
- Location reads 74/100 on livability (#184 in TX, #4,771 nationally) — a middle-class / working-renter tenant base. Strengths: amenities A+, cost of living A+, housing A+; Watch: crime F.
- Cypress-Fairbanks ISD (suburban): math 45% / reading 52% proficiency, ranked #161 of 826 in TX (top 20%) — families likely to look elsewhere, expect single-tenant / working-renter base with shorter leases.
- Zoned schools: Dean Middle (math 31% / reading 39%, grade F, #842 of 1,662 statewide, top 51%, 1,252 students, 88% FRL); Cypress Ridge H S (math 45% / reading 53%, grade D, #553 of 1,632 statewide, top 34%, 2,921 students, 76% FRL) — zoned schools average 82% FRL vs 43% district-wide (39 pts higher); higher-poverty schools than district average — tighter screening recommended.
- Market conditions: Rents flat; 171 active listings in the ZIP; 34 comparable units currently listed for rent nearby; rentals at typical pace (median 24d on market — plan ~3-4 weeks tenant-placement turnaround); 44% of comp listings sitting > 30 days — soft ceiling on asking rent; solid renter incomes; 29,883 units permitted in Harris County in 2024 (8,621 in 5+ unit buildings).
- This rent runs 33% of the median local income ($77k/yr) — at the standard rent-burdened threshold; future hikes will face affordability resistance.
Forward outlook
- Local home prices are declining (-1.5%/yr); year-one equity from $1k of loan paydown is wiped out by about $3k of value loss. Plan a longer hold.
- Harris County population projected at +47% by 2050 — long-run rental-demand tailwind backs the buy-and-hold thesis.
Negotiation context
- Only 1 days on market — expect competitive offers; lowballing is unlikely to land.
- 4 sale attempts with the ask held roughly flat each time — persistent listings suggest the price (not the market) is what's stuck; bring a comps-based counter.
Risks & watch-outs
- Watch-outs: property tax is 2.9% of price.
- Climate carrying-cost: severe wind risk, 99% chance of damaging wind over 30y; extreme-heat days projected 7→23/yr by 2055 (HVAC capex compounding) — expect insurance premiums to compound above CPI over the hold.
Questions for the listing agent
- Built in 1976 — when were the roof, HVAC, electrical panel, plumbing, and water heater last replaced?
- Property tax is high relative to price — has the assessment been appealed recently, and will the sale trigger a re-assessment?
- Is there a deadline driving the sale (1031 exchange, divorce, estate, relocation)? That informs how much negotiation room exists.
- Schools are D-rated, which usually means shorter tenancies and higher turnover. Who's the typical renter profile here, and what's been the actual vacancy rate?
- Crime grade is F in this area — have there been break-ins, vandalism, or insurance claims at this property in the last 3 years? What carrier currently insures it and at what premium?
- What's the average days-on-market for RENTAL listings here right now (not sales)? A rising rental-DOM trend means longer vacancies and softer asking-rent achievability than the comps imply.
- What's the recent tenant-quality profile in this submarket — average credit score on applications, eviction rate, late-payment / NSF rate, and stable-employment percentage? A property-management company in the area should have these aggregated.
- How much new for-sale + rental construction is in the pipeline within 1–3 miles? Heavy new supply typically softens prices + rents 12–24 months out; constrained supply supports both.
Investment metrics
- 1% rule
- 1.13% ✓
- Cap rate
- 7.33%
- Cash-on-cash
- 3.69%
- DSCR
- 1.16
- GRM
- 7.4
CMA / ARV
- ARV (on-the-fly)
- $358,028
- Comps found
- 12
Show comp detail 12 sales within ~0.75 mi
| Address | Dist | Beds/Ba | Sqft | Sold | Price | $/sf | Match |
|---|---|---|---|---|---|---|---|
| 4334 Spring Valley Rd | 0.00mi | 4/2.0 | 1,738 (0%) | 1mo | $185,000 | $106 | 99 |
| 9718 Springmont Dr | 0.34mi | 3/2.0 (-1) | 1,800 (+4%) | 0mo | $367,500 | $204 | 73 |
| 9626 Colleen Rd | 0.57mi | 4/2.0 | 1,642 (-6%) | 1mo | $394,800 | $240 | 63 |
| 9948 Storehouse Dr | 0.53mi | 3/2.5 (-1) | 1,785 (+3%) | 1mo | $325,000 | $182 | 62 |
| 4214 Farm Hollow St | 0.61mi | 3/2.5 (-1) | 1,727 (-1%) | 3mo | $385,240 | $223 | 61 |
| 10006 Rustic Charm St | 0.62mi | 3/2.5 (-1) | 1,727 (-1%) | 3mo | $376,640 | $218 | 61 |
| 10004 Rustic Charm St | 0.61mi | 3/2.5 (-1) | 1,703 (-2%) | 3mo | $350,340 | $206 | 59 |
| 10014 Rustic Charm St | 0.64mi | 3/2.5 (-1) | 1,703 (-2%) | 2mo | $351,140 | $206 | 58 |
| 2939 Rosefield Dr | 0.71mi | 3/2.0 (-1) | 1,815 (+4%) | 2mo | $395,000 | $218 | 53 |
| 10008 Rustic Charm St | 0.62mi | 3/2.5 (-1) | 1,607 (-8%) | 2mo | $332,240 | $207 | 50 |
| 9719 Lawngate Dr | 0.57mi | 4/3.0 | 1,990 (+14%) | 3mo | $385,000 | $193 | 43 |
| 10018 Rustic Charm St | 0.65mi | 4/2.5 | 1,989 (+14%) | 3mo | $384,890 | $194 | 41 |
Match score weights: distance 35% · size 25% · config 20% · recency 20%. Top-matched comps best support the ARV.
Projected returns pro-forma
-1.47% appreciation · 0.25% rent growth · sell at horizon
- IRR
- -6.2%
- Equity multiple
- 0.75×
- Total profit
- $-13,142
- Equity at exit
- $40,523
- IRR
- -2.1%
- Equity multiple
- 0.84×
- Total profit
- $-8,465
- Equity at exit
- $39,122
Cash invested: $51,800 (down + closing). Projections, not guarantees.
Landlord ↔ Tenant lean methodology
- Overall (STATE)
- 87 Strongly Landlord-Friendly
- State Texas
- 87 Strongly Landlord-Friendly · R+5
- County
- — inherits STATE
- City
- — inherits STATE
ZIP-level market 77041
- Home prices YoY
- -0.6%
- Rents YoY
- 0.2%
- Active inventory
- 171
- Price-to-rent
- 7.4×
Monthly cashflow live
- Estimated rent
- $2,095 high interval (Pro) →
- Mortgage (P&I)
- −$970
- Tax from tax record
- −$448 /mo · $5,380/yr
- Insurance
- −$77
- HOA
- −$0
- Vacancy / Maint / Mgmt
- −$440
- Net cashflow
- $159
Break-even live
UW: 25.0% down · 7.5% · 30yr · 1.5% tax · 5.0% vac · 8.0% maint · 8.0% mgmt
Financing live
Cash to close
- Down payment
- $46,250
- Closing costs
- $5,550
- Reserves months
- —
- Total cash needed
- —
Loan-product check · same deal, 3 products live
Conventional
25% down · 7.5% · 30yr
- Down + closing
- —
- Monthly P&I
- —
- Monthly cashflow
- —
- DSCR
- —
- Eligible?
- —
Personal DTI + credit; lowest rate.
DSCR
20% down · 8.5% · 30yr
- Down + closing
- —
- Monthly P&I
- —
- Monthly cashflow
- —
- DSCR
- —
- Eligible?
- —
No personal income docs; deal must DSCR.
Hard money
10% down · 12.0% · 12mo
- Down + closing
- —
- Monthly P&I
- —
- Monthly cashflow
- —
- DSCR
- —
- Eligible?
- —
Short-term bridge; refi at stabilization.
Rent comps 34 comps
| Address | Beds | Baths | Sqft | Rent | $/sqft | DOM | Units | Dist |
|---|---|---|---|---|---|---|---|---|
| 9811 Falling Fern Ln Houston, TX | 3.0 | 2.5 | 1942 | $2,425 | $1.25 | 13d | 1 | 0.28mi |
| 9813 Falling Fern Ln Houston, TX | 3.0 | 2.5 | 1650 | $2,295 | $1.39 | 24d | 1 | 0.29mi |
| 9826 Rugged Oaks Dr Houston, TX | 3.0 | 2.5 | 1942 | $2,250 | $1.16 | 24d | 1 | 0.30mi |
| 9614 Springmont Dr Unit 1042671P Houston, TX | 5.0 | 2.5 | 2174 | $14,296 | $6.58 | 21d | 1 | 0.33mi |
| 9945 Storehouse Dr Houston, TX | 3.0 | 2.5 | 2119 | $2,600 | $1.23 | 43d | 1 | 0.50mi |
| 9634 Rockhurst Dr Houston, TX | 4.0 | 2.0 | 1881 | $2,700 | $1.44 | 43d | 1 | 0.66mi |
| 9540 Kempwood Dr Houston, TX | 1.0–3.0 | 1.0–2.5 | 965 | $1,580 | $1.64 | 43d | 24 | 0.78mi |
| 3400 Campbell Rd Houston, TX | 1.0–3.0 | 1.0–2.0 | 954 | $1,299 | $1.36 | 5d | 12 | 0.79mi |
| 3125 Crestdale Dr Unit 3148 Houston, TX | 3.0 | 2.0 | 1241 | $1,541 | $1.24 | 2d | 1 | 0.95mi |
| 3125 Crestdale Dr Unit 3158 Houston, TX | 3.0 | 2.0 | 1241 | $1,573 | $1.27 | 10d | 1 | 0.95mi |
| 9911 Porto Rico Rd Unit A Houston, TX | 5.0 | 2.0 | 1500 | $2,650 | $1.77 | 24d | 1 | 0.99mi |
| 10105 Kempwood Dr Houston, TX | 1.0–3.0 | 1.0–2.0 | 925 | $1,575 | $1.70 | 2d | 24 | 1.01mi |
| 3125 Crestdale Dr Unit 1064 Houston, TX | 3.0 | 2.0 | 1400 | $1,399 | $1.00 | 43d | 1 | 1.02mi |
| 3125 Crestdale Dr Unit 1006 Houston, TX | 3.0 | 2.0 | 1500 | $1,629 | $1.09 | 43d | 1 | 1.02mi |
| 3125 Crestdale Dr Unit 1057 Houston, TX | 3.0 | 2.0 | 1241 | $1,419 | $1.14 | 43d | 1 | 1.02mi |
| 3125 Crestdale Dr Unit 1436 Houston, TX | 3.0 | 2.0 | 1450 | $1,599 | $1.10 | 43d | 1 | 1.02mi |
| 3125 Crestdale Dr Unit 1082 Houston, TX | 4.0 | 2.0 | 1600 | $1,200 | $0.75 | 43d | 1 | 1.02mi |
| 3125 Crestdale Dr Unit 1006 Houston, TX | 3.0 | 2.0 | 1495 | $1,629 | $1.09 | 24d | 1 | 1.02mi |
| 3125 Crestdale Dr Unit 1091 Houston, TX | 3.0 | 2.0 | 1450 | $1,500 | $1.03 | 43d | 1 | 1.02mi |
| 3125 Crestdale Dr Unit 1305 Houston, TX | 4.0 | 2.0 | 1600 | $1,819 | $1.14 | 43d | 1 | 1.02mi |
| 3125 Crestdale Dr Unit 2346 Houston, TX | 3.0 | 2.0 | 1354 | $1,499 | $1.11 | 43d | 1 | 1.02mi |
| 3125 Crestdale Dr Houston, TX | 3.0 | 3.0 | 1400 | $1,749 | $1.25 | 43d | 1 | 1.03mi |
| 10221 Centrepark Dr Unit 3174 Houston, TX | 3.0 | 2.0 | 1386 | $2,090 | $1.51 | 11d | 1 | 1.06mi |
| 10221 Centrepark Dr Unit 525 Houston, TX | 3.0 | 2.0 | 1386 | $2,047 | $1.48 | 2d | 1 | 1.06mi |
| 10221 Centrepark Dr Unit 10254 Houston, TX | 3.0 | 2.0 | 1386 | $2,014 | $1.45 | 43d | 1 | 1.06mi |
| 9219 Kempwood Dr Houston, TX | 4.0 | 3.0 | 1913 | $9,500 | $4.97 | 43d | 1 | 1.16mi |
| 9219 Kempwood Dr Unit 1019628P Houston, TX | 4.0 | 3.0 | 1905 | $14,940 | $7.84 | 24d | 1 | 1.16mi |
| 2823 Stetson Ln Houston, TX | 4.0 | 2.0 | 2050 | $3,050 | $1.49 | 43d | 1 | 1.27mi |
| 4006 Hollister Rd Houston, TX | 3.0 | 2.0 | 1344 | $1,776 | $1.32 | 24d | 1 | 1.34mi |
| 9007 Kempwood Dr Houston, TX | 3.0 | 2.0 | 1344 | $1,175 | $0.87 | 18d | 1 | 1.36mi |
| 9007 Kempwood Dr Houston, TX | 3.0 | 2.0 | 1344 | $1,175 | $0.87 | 15d | 1 | 1.36mi |
| 10615 Heatherford Dr Houston, TX | 4.0 | 2.0 | 2120 | $2,495 | $1.18 | 7d | 1 | 1.45mi |
| 3950 Hollister Rd Houston, TX | 1.0–3.0 | 1.0–2.0 | 972 | $1,199 | $1.23 | 2d | 6 | 1.45mi |
| 8018 Grow Ln Houston, TX | 3.0 | 2.5 | 1770 | $2,050 | $1.16 | 24d | 1 | 1.47mi |
Listing history 12 events
-
2026-04-14status Pending
-
2026-04-14$185,000 Active
-
2025-12-15historical
-
2025-11-24status Active
-
2025-10-21status Pending
-
2025-10-20$185,000 Active
-
2025-10-07historical
-
2025-09-12price $185,000
-
2025-08-07price $199,900
-
2025-05-08$225,000 Active
-
2025-05-06historical
-
1988-01-02soldstatus
ⓘ Source: listings_history table (triggers on properties + properties_extension) + one-shot
backfill from property_details.listing_events for pre-trigger history.
Tax reassessment forecast TX · Resets to sale price
- Current annual tax
- $5,380 · $448/mo
- Projected year-2 tax
- $5,380 · $448/mo
- Expected delta
- $0/yr ($0/mo · 0.0%)
ⓘ Screening estimate from a state-policy table — verify with the county assessor before closing.
Climate risk First Street
- Flood 1/10 Low FEMA zone X (unshaded) · 0% chance over 30 yrs
- Wildfire 1/10 Low
- Heat 9/10 Extreme 7 d/yr ≥109°F today · 23 d/yr by 30 yrs out
- Wind 9/10 Extreme 99% chance of damaging wind over 30 yrs
- Air quality 3/10 Moderate 3 unhealthy d/yr today · 3 by 30 yrs out
Nearby sold comps map
Loading sold comps map…
Walkable amenities ~0.75 mi
Loading nearby amenities…
Taxation est. · year 1
- Rental income
- $25,139
- − Mortgage interest
- −$10,363
- − Property taxes
- −$5,380
- − Insurance
- −$925
- − Repairs & maintenance
- −$2,011
- − Management
- −$2,011
- − Depreciation
- −$5,382
- Taxable loss
- −$933
- Est. tax savings @ 24.0%
- +$224
- After-tax cash flow
- $2,136/yr
For passive investors: Depreciation is non-cash, so a rental often shows a tax loss while cash-flowing — sheltering income. Rental losses are passive: they offset passive income freely, and up to $25,000/yr can offset ordinary (W-2) income if you actively participate and your MAGI is under $100k (phasing out to $0 by $150k); unused losses carry forward. On sale, claimed depreciation is recaptured at up to 25%, and gains may owe capital-gains tax (a 1031 exchange can defer both). Figures are a year-1 estimate at your 24.0% rate — not tax advice; consult a CPA.
Schools (NCES district)
- District
- Cypress-Fairbanks ISD
- NCES district ID
- 4816110
- Math proficiency
- 45% ▼ -12.00%
- Reading proficiency
- 52% ▼ -2.00%
- Median HH income
- $72,025
- Composite
- 43.63/100
- National rank
- #2968
- State rank
- #161 of 826 in TX
Livability — Houston
- Score
- 74/100
- State rank
- #184
- US rank
- #4771
Category grades
Schools grade is shown separately in the Schools card above.
Census & demographics
- Census place
- Houston, TX
- County
- Harris County · 4,702,590 people
- City population
- 3,226,434
- Metro
- Houston-The Woodlands-Sugar Land, TX
- Population (ZIP)
- 33,349
- Household income
- $77,083
- Rent vs Own
- Severe rent burden
- 537.0
Population outlook (Harris County) Hauer SSP2
- Today (2025)
- 5,571,493 people
- By 2030
- 6,089,821 · +9.3%
- By 2040
- 7,142,806 · +28.2%
- By 2050
- 8,185,864 · +46.9%
- By 2075
- 10,574,329 · +89.8%
- By 2100
- 12,109,958 · +117.4%
Race, ethnicity, and origin ACS 2023
- Neighborhood character
- Diverse neighborhood (Simpson 0.67)
- Race & ethnicity
- Hispanic / Latino 50% Two or more races 25% White 23% Asian 16% Black 9% Native American 3%
- Hispanic origin (detail)
- Mexican 36% Cuban 2% Salvadoran 1%
- Common ancestry
- Italian 1% Portuguese 1% Romanian 1%
- Foreign-born
- 38% · Canada, Vietnam, China
- Languages at home
- 45% English-only · Spanish 39% Vietnamese 8% Other Indo-European 3%
Political lean MEDSL · Harris
- 2024 margin
- Lean D (+5.5) · D 52.0% · R 46.4% · Other 1.6%
- 2008→2024 swing
- +3.9pp toward D · 2008: 1.6pp · 2024: 5.5pp
- All cycles
- 2024: D+5.5 2020: D+13.3 2016: D+12.4 2012: D+0.1 2008: D+1.6
Not yet ingested
- Civics
- —
Market trends
- HPI YoY
- ▼ -1.47%
- Current HPI
- 241.5096
- Rent YoY
- ▲ 0.25%
- Metro
- Houston-The Woodlands-Sugar Land, TX
- State GDP YoY
- ▲ 3.95%
- F500 in state
- 110
Industry mix (Fortune 500 HQ in TX)
| Industry | F500 HQs | Revenue |
|---|---|---|
| Energy | 16 | $1,198B |
|
||
| Technology | 5 | $198B |
|
||
| Engineering / Construction | 4 | $72B |
|
||
| Energy Services | 3 | $60B |
|
||
| Utilities | 3 | $41B |
|
||
| Healthcare | 2 | $330B |
|
||
Price history
-17.8% since first listed12 events — show timeline
- 2026-04-14 Pending — HARMLS
- 2026-04-14 Listed $185,000 HARMLS
- 2025-12-15 Listing Removed — HARMLS
- 2025-11-24 Relisted — HARMLS
- 2025-10-21 Pending — HARMLS
- 2025-10-20 Listed $185,000 HARMLS
- 2025-10-07 Listing Removed — HARMLS
- 2025-09-12 Price Changed $185,000 HARMLS
- 2025-08-07 Price Changed $199,900 HARMLS
- 2025-05-08 Listed $225,000 HARMLS
- 2025-05-06 Coming Soon — HARMLS
- 1988-01-02 Sold (Public Records) — Public Records
Property tax history
+7.5%/yrLatest (2025): $5,380 · +4.8% YoY. Source: county tax records.
Cash-flow waterfall
monthlySold comps — $/sqft
last 12 mo · ≤1 miLoading sold comps…