2112 Cumberland Rd · Bessemer, AL
Flood risk 1/10 · Minimal
- FEMA flood zone
- X (unshaded)
- Chance of flooding over 30 yrs
- 0.0%
- Est. flood insurance / yr
- $507 – $1,088
Fire risk 2/10 · Minimal
- Est. fire insurance / yr
- $916 – $1,700
Heat risk 6/10 · Moderate
- Hot days now (above 108°F)
- 7 days/yr
- Hot days in 30 yrs
- 19 days/yr
Wind risk 6/10 · Moderate
- Chance of severe wind over 30 yrs
- 44.0%
Air-quality risk 3/10 · Minor
- Unhealthy air days now
- 2 days/yr
- Unhealthy air days in 30 yrs
- 5 days/yr
Risk factors via First Street. Map © Google.
Why this score? — see what drove the B grade
The composite is a weighted blend of 9 inputs, each scored 0–100. Each bar is that input's sub-score; the figure is the points it added to the 100-point composite (weight × sub-score).
- Cash flow +28.0/30.0
- ARV discount +15.0/15.0
- DSCR +9.9/10.0
- 1% rule +6.8/10.0
- Rent growth +5.0/5.0
- Livability +3.0/5.0
- Condition / age +2.5/5.0
- Schools +0.8/10.0
- Appreciation +0.0/10.0
$139,900
🖨 Deal sheet (PDF) 📄 Offer letter ✓ Due diligence
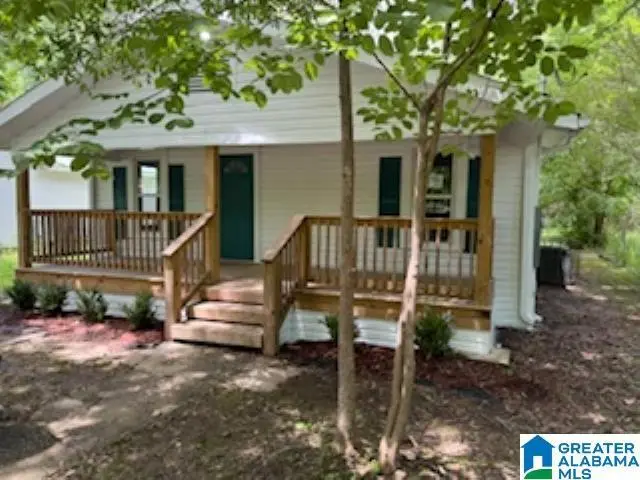
Listing remarks
Completely renovated 3-bed, 2-bath home on nearly half an acre in Bessemer. This charming 1,168 sq ft residence has been updated throughout and features a newly added 2nd full bathroom-an exceptional upgrade that dramatically increases function and value. Situated on a quiet street with wooded privacy, the property offers low-maintenance vinyl siding, a generous front porch, and ample-sized rooms throughout. New central A/C, windows, blinds, two new decks, flooring, updated kitchen with granite countertops and appliances, interior & exterior paint, fixtures & hardware throughout. Low maintenance vinyl siding, convenient access to I-20/I-59, minutes to downtown Bessemer & n
Key facts
- Generous front porch
- New central a/c
- Two new decks
Tags
Property features AI
Finance
- Other: Approximately 0.45 acre lot; Subdivision: HOPEWELL
Exterior
- Parking: Circular drive
- Utilities: Public water; Septic system; Internet service available
- Home design: Existing single-family residence; All main living rooms on level 1
- Construction: Vinyl siding; Crawl space foundation
- Exterior features: Covered patio; Open deck; Porch
Interior
- Kitchen: Solid surface countertops; Eating area; Electric oven; Refrigerator
- Bedrooms: Master bedroom (main level); Two additional bedrooms (main level)
- Flooring: Carpet; Vinyl
- Bathrooms: Two full bathrooms with tub/shower combo
- Heating & cooling: Central heating; Central cooling
- Interior features: Smooth ceilings; All window treatments remain; Attic present
- Laundry & utility: Electric water heater
Neighborhood map
What this means for you Summary
Snapshot
- This is a 3-bed/1.0-bath single-family listed at $140k.
Deal economics
- At list price, monthly cash flow is $435 ($5k/yr) — positive.
- The deal already cash-flows at list — no discount required.
- Meets the 1% rule at list price ($2k rent vs $140k).
- Recommended offer: $138k (1.5% below list) — sets the bar for market timing.
- Cap rate 10.0% vs local median 5.9% in Bessemer — top-decile yield for the area; either an underpriced asset or a hidden risk that comps aren't pricing in. Stress-test before assuming the spread holds.
Location & tenants
- Location reads 59/100 on livability (#331 in AL) — a working-class tenant base; expect higher turnover. Strengths: commute A+, cost of living A+, housing A; Watch: crime F, amenities F, employment F.
- Bessemer City (suburban): math 3% / reading 19% proficiency, ranked #120 of 129 in AL (top 93%) — low school quality limits family demand, transient renter base, plan for 1-2y turnover; 87% free/reduced lunch — lower-income household profile, screen leases tightly.
- Zoned schools: Greenwood Elementary School (math 2% / reading 27%, grade F, #508 of 627 statewide, top 84%, 286 students, 77% FRL); Bessemer City High School (math 2% / reading 8%, grade F, #276 of 305 statewide, top 95%, 850 students, 61% FRL) — zoned schools average 69% FRL vs 87% district-wide (18 pts lower); this property's tenant base skews higher-income than the district average.
- Market conditions: Rents rising fast (+14.8%/yr); 311 active listings in the ZIP; 3 comparable units currently listed for rent nearby; rentals at typical pace (median 17d on market — plan ~3-4 weeks tenant-placement turnaround); solid renter incomes; 2,114 units permitted in Jefferson County in 2024 (556 in 5+ unit buildings).
Forward outlook
- Local home prices are declining (-3.0%/yr); year-one equity from $967 of loan paydown is wiped out by about $4k of value loss. Plan a longer hold.
- Jefferson County population projected to shrink 4% by 2050 — rents likely to lag national; underwrite the cash flow, not the appreciation.
- At projected returns (-3.0% appreciation + 8.0% rent growth), your $39k cash investment doubles in ~7 years — after that, you're playing with house money.
Negotiation context
- It's been on market 23 days — a 2% lower offer ($138k) is reasonable based on typical stale-listing flexibility.
Risks & watch-outs
- Watch-outs: built in 1930 — expect roof / HVAC / electrical / plumbing capex.
- Climate carrying-cost: major wind risk, 44% chance of damaging wind over 30y; extreme-heat days projected 7→19/yr by 2055 (HVAC capex compounding) — expect insurance premiums to compound above CPI over the hold.
Questions for the listing agent
- Built in 1930 — when were the roof, HVAC, electrical panel, plumbing, and water heater last replaced?
- Is there a deadline driving the sale (1031 exchange, divorce, estate, relocation)? That informs how much negotiation room exists.
- Schools are D-rated, which usually means shorter tenancies and higher turnover. Who's the typical renter profile here, and what's been the actual vacancy rate?
- Crime grade is F in this area — have there been break-ins, vandalism, or insurance claims at this property in the last 3 years? What carrier currently insures it and at what premium?
- What's the average days-on-market for RENTAL listings here right now (not sales)? A rising rental-DOM trend means longer vacancies and softer asking-rent achievability than the comps imply.
- What's the recent tenant-quality profile in this submarket — average credit score on applications, eviction rate, late-payment / NSF rate, and stable-employment percentage? A property-management company in the area should have these aggregated.
- How much new for-sale + rental construction is in the pipeline within 1–3 miles? Heavy new supply typically softens prices + rents 12–24 months out; constrained supply supports both.
Investment metrics
- 1% rule
- 1.18% ✓
- Cap rate
- 10.02%
- Cash-on-cash
- 13.33%
- DSCR
- 1.59
- GRM
- 7.1
CMA / ARV
- ARV (on-the-fly)
- $185,920
- Comps found
- 2
Show comp detail 2 sales within ~0.75 mi
| Address | Dist | Beds/Ba | Sqft | Sold | Price | $/sf | Match |
|---|---|---|---|---|---|---|---|
| 118 Winchester Dr | 0.74mi | 3/2.0 | 1,152 (+3%) | 13mo | $181,000 | $157 | 46 |
| 3149 Pinecreek Loop | 0.50mi | 2/2.0 (-1) | 1,171 (+5%) | 24mo | $194,000 | $166 | 40 |
Match score weights: distance 35% · size 25% · config 20% · recency 20%. Top-matched comps best support the ARV.
Projected returns pro-forma
-3.0% appreciation · 8.0% rent growth · sell at horizon
- IRR
- 8.5%
- Equity multiple
- 1.35×
- Total profit
- $13,726
- Equity at exit
- $20,860
- IRR
- 21.4%
- Equity multiple
- 3.23×
- Total profit
- $87,204
- Equity at exit
- $12,096
Cash invested: $39,172 (down + closing). Projections, not guarantees.
Landlord ↔ Tenant lean methodology
- Overall (STATE)
- 90 Strongly Landlord-Friendly
- State Alabama
- 90 Strongly Landlord-Friendly · R+15
- County
- — inherits STATE
- City
- — inherits STATE
ZIP-level market 35022
- Home prices YoY
- -20.2%
- Rents YoY
- 14.8%
- Active inventory
- 311
- Price-to-rent
- 7.1×
Monthly cashflow live
- Estimated rent
- $1,651 medium interval (Pro) →
- Mortgage (P&I)
- −$734
- Tax from tax record
- −$78 /mo · $932/yr
- Insurance
- −$58
- HOA
- −$0
- Vacancy / Maint / Mgmt
- −$347
- Net cashflow
- $435
Break-even live
Sensitivity live
| Price | -10% $514 | -5% $475 | +0% $435 | +5% $395 | +10% $356 |
|---|---|---|---|---|---|
| Rent | -10% $305 | -5% $370 | +0% $435 | +5% $500 | +10% $565 |
| Rate | -1.0pp $505 | -0.5pp $471 | base $435 | +0.5pp $399 | +1.0pp $362 |
UW: 25.0% down · 7.5% · 30yr · 1.5% tax · 5.0% vac · 8.0% maint · 8.0% mgmt
Financing live
Cash to close
- Down payment
- $34,975
- Closing costs
- $4,197
- Reserves months
- —
- Total cash needed
- —
Loan-product check · same deal, 3 products live
Conventional
25% down · 7.5% · 30yr
- Down + closing
- —
- Monthly P&I
- —
- Monthly cashflow
- —
- DSCR
- —
- Eligible?
- —
Personal DTI + credit; lowest rate.
DSCR
20% down · 8.5% · 30yr
- Down + closing
- —
- Monthly P&I
- —
- Monthly cashflow
- —
- DSCR
- —
- Eligible?
- —
No personal income docs; deal must DSCR.
Hard money
10% down · 12.0% · 12mo
- Down + closing
- —
- Monthly P&I
- —
- Monthly cashflow
- —
- DSCR
- —
- Eligible?
- —
Short-term bridge; refi at stabilization.
Rent comps 3 comps
| Address | Beds | Baths | Sqft | Rent | $/sqft | DOM | Units | Dist |
|---|---|---|---|---|---|---|---|---|
| 4015 Goodwin Rd Bessemer, AL | 3.0 | 2.0 | 1200 | $1,211 | $1.01 | 17d | 1 | 0.09mi |
| 3626 Wind Ridge Ln Bessemer, AL | 3.0 | 2.0 | 1305 | $1,850 | $1.42 | 4d | 1 | 0.60mi |
| 2420 Carrolls Ln Bessemer, AL | 4.0 | 2.0 | 1204 | $1,375 | $1.14 | 25d | 1 | 1.21mi |
Listing history 15 events
-
2026-06-21days on market $139,900 Active 23 DOM
-
2026-06-18days on market $139,900 Active 20 DOM
-
2026-06-17days on market $139,900 Active 19 DOM
-
2026-06-16days on market $139,900 Active 18 DOM
-
2026-06-15days on market $139,900 Active 17 DOM
-
2026-06-13days on market $139,900 Active 15 DOM
-
2026-06-10days on market $139,900 Active 12 DOM
-
2026-06-09days on market $139,900 Active 11 DOM
-
2026-06-08days on market $139,900 Active 10 DOM
-
2026-06-07days on market $139,900 Active 9 DOM
-
2026-06-05days on market $139,900 Active 6 DOM
-
2026-06-03days on market $139,900 Active 5 DOM
-
2026-06-02days on market $139,900 Active 4 DOM
-
2026-06-01days on market $139,900 Active 3 DOM
-
2026-05-31days on market $139,900 Active 2 DOM
ⓘ Source: listings_history table (triggers on properties + properties_extension) + one-shot
backfill from property_details.listing_events for pre-trigger history.
Tax reassessment forecast AL · Resets to sale price
- Current annual tax
- $932 · $78/mo
- Projected year-2 tax
- $932 · $78/mo
- Expected delta
- $0/yr ($0/mo · 0.0%)
ⓘ Screening estimate from a state-policy table — verify with the county assessor before closing.
Climate risk First Street
- Flood 1/10 Low FEMA zone X (unshaded) · 0% chance over 30 yrs
- Wildfire 2/10 Low
- Heat 6/10 Major 7 d/yr ≥108°F today · 19 d/yr by 30 yrs out
- Wind 6/10 Major 44% chance of damaging wind over 30 yrs
- Air quality 3/10 Moderate 2 unhealthy d/yr today · 5 by 30 yrs out
Nearby sold comps map
Loading sold comps map…
Walkable amenities ~0.75 mi
Loading nearby amenities…
Taxation est. · year 1
- Rental income
- $19,816
- − Mortgage interest
- −$7,837
- − Property taxes
- −$932
- − Insurance
- −$700
- − Repairs & maintenance
- −$1,585
- − Management
- −$1,585
- − Depreciation
- −$4,070
- Taxable income
- $3,108
- Est. tax owed @ 24.0%
- −$746
- After-tax cash flow
- $4,474/yr
For passive investors: Depreciation is non-cash, so a rental often shows a tax loss while cash-flowing — sheltering income. Rental losses are passive: they offset passive income freely, and up to $25,000/yr can offset ordinary (W-2) income if you actively participate and your MAGI is under $100k (phasing out to $0 by $150k); unused losses carry forward. On sale, claimed depreciation is recaptured at up to 25%, and gains may owe capital-gains tax (a 1031 exchange can defer both). Figures are a year-1 estimate at your 24.0% rate — not tax advice; consult a CPA.
Schools (NCES district)
- District
- Bessemer City
- NCES district ID
- 0100330
- Math proficiency
- 3% ▼ -18.00%
- Reading proficiency
- 19% ▼ -3.00%
- Median HH income
- $29,721
- Composite
- 8.45/100
- National rank
- #9905
- State rank
- #120 of 129 in AL
Livability — Bessemer
- Score
- 59/100
- State rank
- #331
- US rank
- #20078
Category grades
Schools grade is shown separately in the Schools card above.
Census & demographics
- Census place
- Bessemer, AL
- County
- Jefferson County · 527,445 people
- City population
- 48,018
- Metro
- Birmingham-Hoover, AL
- Population (ZIP)
- 23,126
- Household income
- $81,846
- Rent vs Own
- Severe rent burden
- 554.0
Population outlook (Jefferson County) Hauer SSP2
- Today (2025)
- 669,185 people
- By 2030
- 669,694 · +0.1%
- By 2040
- 661,388 · -1.2%
- By 2050
- 643,086 · -3.9%
- By 2075
- 577,267 · -13.7%
- By 2100
- 474,758 · -29.1%
Race, ethnicity, and origin ACS 2023
- Neighborhood character
- Diverse neighborhood (Simpson 0.56)
- Race & ethnicity
- Black 53% White 41% Hispanic / Latino 3% Two or more races 2% Asian 1%
- Common ancestry
- Italian 1% Slovak 1% Iranian 1%
- Foreign-born
- 4% · Canada, China
- Languages at home
- 96% English-only · Spanish 3% Chinese 1%
Political lean MEDSL · Jefferson
- 2024 margin
- D (+10.4) · D 54.6% · R 44.2% · Other 1.2%
- 2008→2024 swing
- +5.4pp toward D · 2008: 5.1pp · 2024: 10.4pp
- All cycles
- 2024: D+10.4 2020: D+13.2 2016: D+7.2 2012: D+6.0 2008: D+5.1
Not yet ingested
- Civics
- —
Market trends
- HPI YoY
- ▼ -55.40%
- Current HPI
- 219.3839
- Rent YoY
- ▲ 14.80%
- Metro
- Birmingham-Hoover, AL
- State GDP YoY
- ▲ 2.94%
- F500 in state
- 4
Industry mix (Fortune 500 HQ in AL)
| Industry | F500 HQs | Revenue |
|---|---|---|
| Financial Services | 1 | $8B |
|
||
| Healthcare | 1 | $5B |
|
||
Price history
-15.2% since first listed10 events — show timeline
- 2026-05-29 Listed $139,900 Greater Alabama MLS
- 2026-02-08 Price Changed $99,900 Greater Alabama MLS
- 2026-01-18 Price Changed $107,500 Greater Alabama MLS
- 2025-12-17 Price Changed $117,500 Greater Alabama MLS
- 2025-11-15 Price Changed $123,000 Greater Alabama MLS
- 2025-01-09 Price Changed $128,000 Greater Alabama MLS
- 2024-12-05 Price Changed $132,900 Greater Alabama MLS
- 2024-11-09 Price Changed $144,900 Greater Alabama MLS
- 2024-09-27 Price Changed $154,900 Greater Alabama MLS
- 2024-08-25 Price Changed $165,000 Greater Alabama MLS
Property tax history
+2.7%/yrLatest (2025): $932 · +6.9% YoY. Source: county tax records.
Cash-flow waterfall
monthlySold comps — $/sqft
last 12 mo · ≤1 miLoading sold comps…